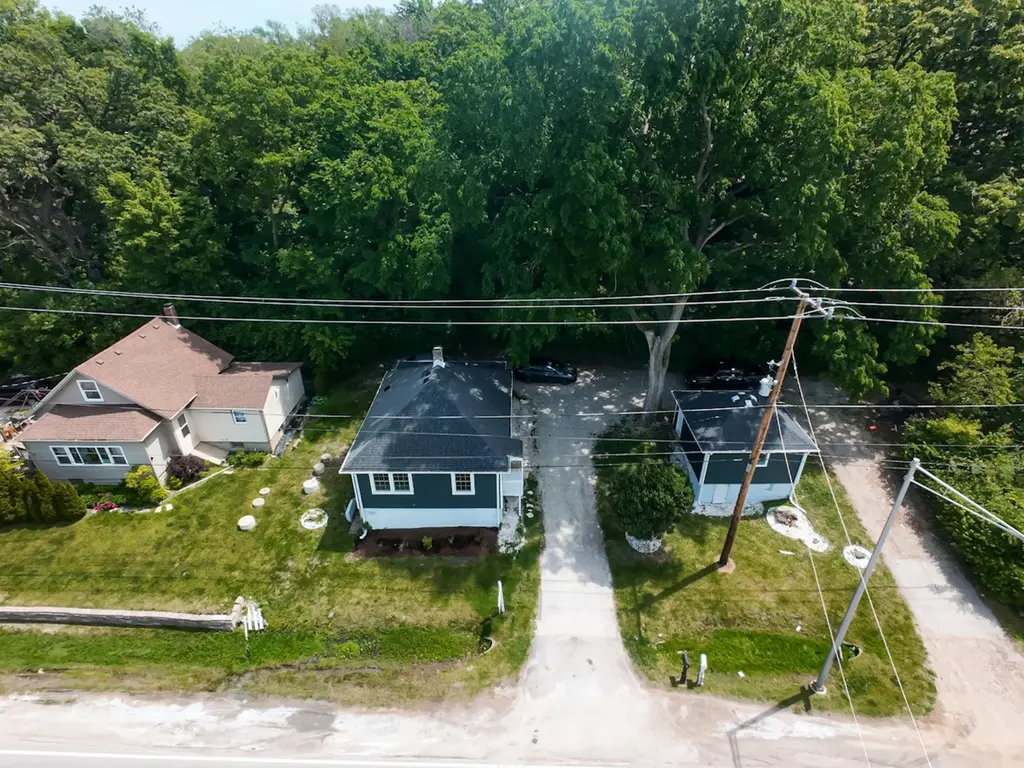
365 New Ave · Romeoville, IL
Flood risk 1/10 · Minimal
- FEMA flood zone
- X (unshaded)
- Chance of flooding over 30 yrs
- 0.0%
- Est. flood insurance / yr
- $507 – $1,088
Fire risk 1/10 · Minimal
- Est. fire insurance / yr
- $804 – $1,492
Heat risk 3/10 · Minor
- Hot days now (above 103°F)
- 7 days/yr
- Hot days in 30 yrs
- 15 days/yr
Wind risk 2/10 · Minimal
- Chance of severe wind over 30 yrs
- —
Air-quality risk 3/10 · Minor
- Unhealthy air days now
- 2 days/yr
- Unhealthy air days in 30 yrs
- 4 days/yr
Risk factors via First Street. Map © Google.
Why this score? — see what drove the D- grade
The composite is a weighted blend of 9 inputs, each scored 0–100. Each bar is that input's sub-score; the figure is the points it added to the 100-point composite (weight × sub-score).
- Cash flow +11.2/30.0
- ARV discount +7.5/15.0
- Livability +3.7/5.0
- Rent growth +3.5/5.0
- Schools +3.4/10.0
- DSCR +3.3/10.0
- 1% rule +3.2/10.0
- Condition / age +2.5/5.0
- Appreciation +0.0/10.0
$225,000
🖨 Deal sheet (PDF) 📄 Offer letter ✓ Due diligence
Listing remarks MLS
Motivated seller offering $5000 in buyers credits and 5 year warranty on windows, siding, and roof. Bring all offers. Welcome to this totally remodeled, walk-out ranch home that is bright and airy! All new roof, siding, gutters, windows and doors (2022) adorn the view as you move up the paver service walk. The front porch leads into an open-concept home and a welcoming foyer with plenty of space for coats and coffee. The living room with its three windows is bathed in sunlight, yet private, as it sits high above the street, overlooking nature. A wood accent wall and glass chandelier surround the dining room with warm tones, while the AC mini split keeps things cool. Walk into an all-new kitchen that offers white cabinets with tile backsplash, an exterior vented hood range, a large single-bowl sink, and a commercial-style faucet (2022). In the rear of the home, a sliding glass door provides access to the mudroom. The all-new bathroom has a water-fall style faucet, a tile shower surround, a tubular skylight and a multi-color shower fixture with integrated Bluetooth speaker (2022). The ample master bedroom features crown molding and space for a large bed and home office. The second bedroom boasts a larger closet and outlets with built-in USB connections. The whole home shines with fresh paint, waterproof flooring, and new light fixtures; ceiling fans keep the kitchen and bedrooms fresh. Walk down the carpeted stairs to the laundry room which has a new water softener, instant hot water heater, stainless steel utility sink, plus gas dryer and washing machine recently installed(2023). A new submersible well-pump supplies fresh water and is under warranty (2023). The home uses a septic system as well, so you only pay gas/electric bills! As you walk outside the basement door, discover an oversized shed (18'x18') with new roof/siding/gutters (2022), motorized overhead door, 240V 30 AMP service and full basement. The long horseshoe driveway conveniently wraps around the house and shed; you can park next to the house's front steps, rear entry floating deck, or up close to the shed! Privacy abounds with only three houses on the street and professionally trimmed trees lining the rear and right of the lot. This property is in unincorporated Lockport but has service from Romeoville's award-winning schools, police, and fire department plus the Metra train across the street. Low taxes ($3011), no water bill/sewer bill, and school bus pick-up in front of your home, all included! This home is move-in ready and easy to view. The accessible fire pit is not part of the property. Minutes from i55, tollway 355, Target, Home Depot, and more. 3D Tour Available!
Key facts
- 4,455 sq ft lot
- 2 garage spots
- Built 1899
Property features AI
Finance
- Other: Property is not currently leased; Rehab year: 2023
- HOA & community: No master association fees required
Exterior
- Parking: Detached garage (owned) with gravel driveway — 2 garage spaces and 2 total parking spaces
- Utilities: Well water; Mechanical septic system; Electric service available
- Home design: Detached single-family home; One-story layout; Fee simple ownership; Built over 100 years ago; Home was built before 1978
- Construction: Vinyl siding exterior; Asphalt roof; Block foundation
- Exterior features: Lot dimensions approximately 99 x 45; Lot listed as less than 0.25 acre; Rehab completed in 2023
Interior
- Kitchen: Main-level kitchen (12 x 11)
- Bedrooms: Three bedrooms (including a main-level master bedroom); Bedroom dimensions include 12 x 12 for the master and 12 x 11 for one secondary bedroom; living room is 9 x 12
- Bathrooms: One full bathroom
- Heating & cooling: Natural gas heating; Cooling: Other
- Interior features: Unfinished full basement; Four total rooms
- Laundry & utility: Dedicated laundry room
Neighborhood map
What this means for you Summary
Snapshot
- This is a 2-bed/1.0-bath single-family listed at $225k.
Deal economics
- At list price, monthly cash flow is $-85 ($-1k/yr) — negative.
- To cash-flow at today's rent, offer at most $210k (6.7% below list).
- To meet the 1% rule (rent ≥ 1% of price), the offer needs to be $184k (18.1% below list).
- Recommended offer: $184k (18.1% below list) — sets the bar for 1% rule.
- Cap rate 5.8% vs local median 4.5% in Romeoville — top-decile yield for the area; either an underpriced asset or a hidden risk that comps aren't pricing in. Stress-test before assuming the spread holds.
Location & tenants
- Location reads 74/100 on livability (#266 in IL, #4,960 nationally) — a middle-class / working-renter tenant base. Strengths: employment A+, housing A+, crime A; Watch: commute D, amenities F, health & safety F.
- Lockport Twp Hsd 205 (suburban): math 35% / reading 38% proficiency, ranked #153 of 620 in IL (top 25%) — families likely to look elsewhere, expect single-tenant / working-renter base with shorter leases.
- Zoned schools: Walsh Elem School (341 students, 0% FRL); Oak Prairie Jr High School (math 25% / reading 41%, grade F, #217 of 665 statewide, top 33%, 452 students, 0% FRL); Lockport Township High Sch East (math 35% / reading 38%, grade F, #117 of 693 statewide, top 17%, 3,872 students, 0% FRL).
- Market conditions: Rents rising (+3.9%/yr); 132 active listings in the ZIP; solid renter incomes; 2,028 units permitted in Will County in 2024 (530 in 5+ unit buildings).
Forward outlook
- Local home prices are declining (-3.0%/yr); year-one equity from $2k of loan paydown is wiped out by about $7k of value loss. Plan a longer hold.
- Will County population projected to shrink 4% by 2050 — rents likely to lag national; underwrite the cash flow, not the appreciation.
Negotiation context
- It's been on market 25 days — a 2% lower offer ($222k) is reasonable based on typical stale-listing flexibility.
- 21 sale attempts since 18y ago; this cycle's ask is 7% above the opening price — seller raised mid-cycle; expect resistance to lowballs.
- Current owner paid $195k; 15% above their basis — modest negotiation headroom, anchor on the comps not their cost.
Risks & watch-outs
- Watch-outs: built in 1899 — expect roof / HVAC / electrical / plumbing capex.
Questions for the listing agent
- What do current leases actually rent for vs. the listed asking? Can we see a recent rent roll and the last 12 months of T-12 income?
- Built in 1899 — when were the roof, HVAC, electrical panel, plumbing, and water heater last replaced?
- Is there a deadline driving the sale (1031 exchange, divorce, estate, relocation)? That informs how much negotiation room exists.
- Schools are D-rated, which usually means shorter tenancies and higher turnover. Who's the typical renter profile here, and what's been the actual vacancy rate?
- The area grade is low — what's the realistic commute time and amenity access for the typical tenant pool here? Any planned neighborhood developments (good or bad) we should know about?
- What's the average days-on-market for RENTAL listings here right now (not sales)? A rising rental-DOM trend means longer vacancies and softer asking-rent achievability than the comps imply.
- What's the recent tenant-quality profile in this submarket — average credit score on applications, eviction rate, late-payment / NSF rate, and stable-employment percentage? A property-management company in the area should have these aggregated.
- How much new for-sale + rental construction is in the pipeline within 1–3 miles? Heavy new supply typically softens prices + rents 12–24 months out; constrained supply supports both.
Investment metrics
- 1% rule
- 0.82% ✗
- Cap rate
- 5.84%
- Cash-on-cash
- -1.62%
- DSCR
- 0.93
- GRM
- 10.2
CMA / ARV
No comps found within radius.
Projected returns pro-forma
-3.0% appreciation · 3.91% rent growth · sell at horizon
- IRR
- -18.0%
- Equity multiple
- 0.36×
- Total profit
- $-40,160
- Equity at exit
- $33,548
- IRR
- -8.5%
- Equity multiple
- 0.45×
- Total profit
- $-34,760
- Equity at exit
- $19,454
Cash invested: $63,000 (down + closing). Projections, not guarantees.
Landlord ↔ Tenant lean methodology
- Overall (STATE)
- 43 Moderately Tenant-Leaning
- State Illinois
- 43 Moderately Tenant-Leaning · D+7
- County
- — inherits STATE
- City
- — inherits STATE
ZIP-level market 60441
- Home prices YoY
- -33.0%
- Rents YoY
- 3.9%
- Active inventory
- 132
- Price-to-rent
- 10.2×
Monthly cashflow live
- Estimated rent
- $1,842 medium interval (Pro) →
- Mortgage (P&I)
- −$1,180
- Tax from tax record
- −$267 /mo · $3,200/yr
- Insurance
- −$94
- HOA
- −$0
- Vacancy / Maint / Mgmt
- −$387
- Net cashflow
- $-85
Break-even live
Sensitivity live
| Price | -10% $42 | -5% $-21 | +0% $-85 | +5% $-149 | +10% $-212 |
|---|---|---|---|---|---|
| Rent | -10% $-231 | -5% $-158 | +0% $-85 | +5% $-12 | +10% $60 |
| Rate | -1.0pp $28 | -0.5pp $-28 | base $-85 | +0.5pp $-143 | +1.0pp $-203 |
UW: 25.0% down · 7.5% · 30yr · 1.5% tax · 5.0% vac · 8.0% maint · 8.0% mgmt
Financing live
Cash to close
- Down payment
- $56,250
- Closing costs
- $6,750
- Reserves months
- —
- Total cash needed
- —
Loan-product check · same deal, 3 products live
Conventional
25% down · 7.5% · 30yr
- Down + closing
- —
- Monthly P&I
- —
- Monthly cashflow
- —
- DSCR
- —
- Eligible?
- —
Personal DTI + credit; lowest rate.
DSCR
20% down · 8.5% · 30yr
- Down + closing
- —
- Monthly P&I
- —
- Monthly cashflow
- —
- DSCR
- —
- Eligible?
- —
No personal income docs; deal must DSCR.
Hard money
10% down · 12.0% · 12mo
- Down + closing
- —
- Monthly P&I
- —
- Monthly cashflow
- —
- DSCR
- —
- Eligible?
- —
Short-term bridge; refi at stabilization.
Listing history 16 events
-
2026-06-21days on market $225,000 Active 25 DOM
-
2026-06-18days on market $225,000 Active 22 DOM
-
2026-06-17days on market $225,000 Active 21 DOM
-
2026-06-16days on market $225,000 Active 20 DOM
-
2026-06-15days on market $225,000 Active 19 DOM
-
2026-06-13days on market $225,000 Active 17 DOM
-
2026-06-10pricestatus $225,000 Active 13 DOM
-
2026-06-09days on market $235,000 Contingent - Continue to Show 13 DOM
-
2026-06-08days on market $235,000 Contingent - Continue to Show 12 DOM
-
2026-06-07days on market $235,000 Contingent - Continue to Show 11 DOM
-
2026-06-04days on market $235,000 Contingent - Continue to Show 8 DOM
-
2026-06-03statusdays on market $235,000 Contingent - Continue to Show 7 DOM
-
2026-06-02days on market $235,000 Active 6 DOM
-
2026-06-02price $235,000 Active 5 DOM
-
2026-06-01days on market $249,900 Active 5 DOM
-
2026-05-31days on market $249,900 Active 4 DOM
ⓘ Source: listings_history table (triggers on properties + properties_extension) + one-shot
backfill from property_details.listing_events for pre-trigger history.
Tax reassessment forecast IL · Partial reset (capped growth)
- Current annual tax
- $3,200 · $267/mo
- Projected year-2 tax
- $4,154 · $346/mo
- Expected delta
- +$954/yr (+$79/mo · 29.8%)
ⓘ Screening estimate from a state-policy table — verify with the county assessor before closing.
Climate risk First Street
- Flood 1/10 Low FEMA zone X (unshaded) · 0% chance over 30 yrs
- Wildfire 1/10 Low
- Heat 3/10 Moderate 7 d/yr ≥103°F today · 15 d/yr by 30 yrs out
- Wind 2/10 Low
- Air quality 3/10 Moderate 2 unhealthy d/yr today · 4 by 30 yrs out
Nearby sold comps map
Loading sold comps map…
Walkable amenities ~0.75 mi
Loading nearby amenities…
Taxation est. · year 1
- Rental income
- $22,104
- − Mortgage interest
- −$12,603
- − Property taxes
- −$3,200
- − Insurance
- −$1,125
- − Repairs & maintenance
- −$1,768
- − Management
- −$1,768
- − Depreciation
- −$6,545
- Taxable loss
- −$4,906
- Est. tax savings @ 24.0%
- +$1,177
- After-tax cash flow
- $156/yr
For passive investors: Depreciation is non-cash, so a rental often shows a tax loss while cash-flowing — sheltering income. Rental losses are passive: they offset passive income freely, and up to $25,000/yr can offset ordinary (W-2) income if you actively participate and your MAGI is under $100k (phasing out to $0 by $150k); unused losses carry forward. On sale, claimed depreciation is recaptured at up to 25%, and gains may owe capital-gains tax (a 1031 exchange can defer both). Figures are a year-1 estimate at your 24.0% rate — not tax advice; consult a CPA.
Schools (NCES district)
- District
- Lockport Twp Hsd 205
- NCES district ID
- 1723350
- Math proficiency
- 35% ▼ -5.00%
- Reading proficiency
- 38% ▼ -4.00%
- Median HH income
- $69,994
- Composite
- 33.5/100
- National rank
- #5440
- State rank
- #153 of 620 in IL
Livability — Romeoville
- Score
- 74/100
- State rank
- #266
- US rank
- #4960
Category grades
Schools grade is shown separately in the Schools card above.
Census & demographics
- Census place
- Romeoville, IL
- County
- Will County · 412,448 people
- City population
- 41,672
- Metro
- Chicago-Naperville-Elgin, IL-IN-WI
- Population (ZIP)
- 36,844
- Household income
- $103,374
- Rent vs Own
- Severe rent burden
- 519.0
Population outlook (Will County) Hauer SSP2
- Today (2025)
- 705,368 people
- By 2030
- 708,154 · +0.4%
- By 2040
- 702,692 · -0.4%
- By 2050
- 680,249 · -3.6%
- By 2075
- 611,990 · -13.2%
- By 2100
- 516,215 · -26.8%
Race, ethnicity, and origin ACS 2023
- Neighborhood character
- Predominantly White (76%)
- Race & ethnicity
- White 76% Hispanic / Latino 12% Two or more races 9% Black 7%
- Hispanic origin (detail)
- Mexican 9% Puerto Rican 1%
- Common ancestry
- Romanian 18% Iranian 2% Lithuanian 2%
- Foreign-born
- 7% · Canada
- Languages at home
- 86% English-only · Spanish 7% Russian/Polish/Slavic 4% Other Indo-European 2%
Political lean MEDSL · Will
- 2024 margin
- Toss-up / Even · D 50.1% · R 48.5% · Other 1.4%
- 2008→2024 swing
- -11.6pp toward R · 2008: 13.2pp · 2024: 1.6pp
- All cycles
- 2024: D+1.6 2020: D+8.3 2016: D+5.7 2012: D+3.7 2008: D+13.2
Not yet ingested
- Civics
- —
Market trends
- HPI YoY
- ▼ -99.43%
- Current HPI
- 201.5857
- Rent YoY
- ▲ 3.91%
- Metro
- Chicago-Naperville-Elgin, IL-IN-WI
- State GDP YoY
- ▲ 1.59%
- F500 in state
- 60
Industry mix (Fortune 500 HQ in IL)
| Industry | F500 HQs | Revenue |
|---|---|---|
| Insurance | 4 | $201B |
|
||
| Consumer Goods | 4 | $87B |
|
||
| Industrial Machinery | 3 | $64B |
|
||
| Healthcare | 2 | $55B |
|
||
| Retail / Pharmacy | 1 | $148B |
|
||
| Agriculture / Food | 1 | $86B |
|
||
Price history
+146.8% since first listed59 events — show timeline
- 2024-02-28 Sold (Public Records) $195,000 Public Records
- 2024-02-23 Sold (MLS) $195,000 MRED as Distributed by MLS Grid
- 2024-01-14 Contingent — MRED as Distributed by MLS Grid
- 2024-01-11 Relisted — MRED as Distributed by MLS Grid
- 2024-01-05 Contingent — MRED as Distributed by MLS Grid
- 2024-01-02 Price Changed $186,500 MRED as Distributed by MLS Grid
- 2024-01-02 Relisted — MRED as Distributed by MLS Grid
- 2023-12-10 Contingent — MRED as Distributed by MLS Grid
- 2023-11-21 Price Changed $195,990 MRED as Distributed by MLS Grid
- 2023-11-02 Price Changed $199,990 MRED as Distributed by MLS Grid
- 2023-10-20 Listed $209,990 MRED as Distributed by MLS Grid
- 2023-03-10 Listing Removed — MRED as Distributed by MLS Grid
- 2023-03-10 Relisted — MRED as Distributed by MLS Grid
- 2022-12-09 Listing Removed — MRED as Distributed by MLS Grid
- 2022-12-09 Relisted — MRED as Distributed by MLS Grid
- 2022-12-08 Listing Removed — MRED as Distributed by MLS Grid
- 2022-10-13 Price Changed — MRED as Distributed by MLS Grid
- 2022-10-13 Relisted — MRED as Distributed by MLS Grid
- 2022-10-12 Listing Removed — MRED as Distributed by MLS Grid
- 2022-10-12 Relisted — MRED as Distributed by MLS Grid
- 2022-10-11 Listing Removed — MRED as Distributed by MLS Grid
- 2022-10-11 Relisted — MRED as Distributed by MLS Grid
- 2022-10-07 Listing Removed — MRED as Distributed by MLS Grid
- 2022-10-07 Relisted — MRED as Distributed by MLS Grid
- 2022-10-07 Listing Removed — MRED as Distributed by MLS Grid
- 2022-09-28 Relisted — MRED as Distributed by MLS Grid
- 2022-09-28 Listing Removed — MRED as Distributed by MLS Grid
- 2022-09-28 Relisted — MRED as Distributed by MLS Grid
- 2022-09-27 Listing Removed — MRED as Distributed by MLS Grid
- 2022-09-27 Relisted — MRED as Distributed by MLS Grid
- 2022-09-26 Listing Removed — MRED as Distributed by MLS Grid
- 2022-09-26 Relisted — MRED as Distributed by MLS Grid
- 2022-09-26 Listing Removed — MRED as Distributed by MLS Grid
- 2022-09-20 Price Changed — MRED as Distributed by MLS Grid
- 2022-09-02 Price Changed — MRED as Distributed by MLS Grid
- 2022-08-16 Listed — MRED as Distributed by MLS Grid
- 2021-08-19 Sold (Public Records) $70,000 Public Records
- 2021-07-01 Sold (MLS) $70,000 MRED as Distributed by MLS Grid
- 2021-06-22 Pending — MRED as Distributed by MLS Grid
- 2021-06-17 Relisted — MRED as Distributed by MLS Grid
- 2021-05-18 Pending — MRED as Distributed by MLS Grid
- 2021-05-07 Price Changed $89,900 MRED as Distributed by MLS Grid
- 2021-05-06 Relisted — MRED as Distributed by MLS Grid
- 2021-04-30 Pending — MRED as Distributed by MLS Grid
- 2021-04-23 Listed $99,900 MRED as Distributed by MLS Grid
- 2019-03-06 Listing Removed — MRED as Distributed by MLS Grid
- 2019-01-17 Price Changed — MRED as Distributed by MLS Grid
- 2018-10-17 Price Changed — MRED as Distributed by MLS Grid
- 2018-10-15 Relisted — MRED as Distributed by MLS Grid
- 2018-10-13 Contingent — MRED as Distributed by MLS Grid
- 2018-09-15 Price Changed — MRED as Distributed by MLS Grid
- 2018-09-04 Listing Removed — MRED as Distributed by MLS Grid
- 2018-09-04 Listed — MRED as Distributed by MLS Grid
- 2018-08-01 Price Changed — MRED as Distributed by MLS Grid
- 2018-07-13 Price Changed — MRED as Distributed by MLS Grid
- 2018-06-25 Listed — MRED as Distributed by MLS Grid
- 2008-07-25 Listing Removed — MRED as Distributed by MLS Grid
- 2008-04-28 Listed — MRED as Distributed by MLS Grid
- 2002-09-25 Sold (Public Records) $79,000 Public Records
Property tax history
+2.6%/yrLatest (2024): $3,200 · +6.3% YoY. Source: county tax records.
Cash-flow waterfall
monthlySold comps — $/sqft
last 12 mo · ≤1 miLoading sold comps…