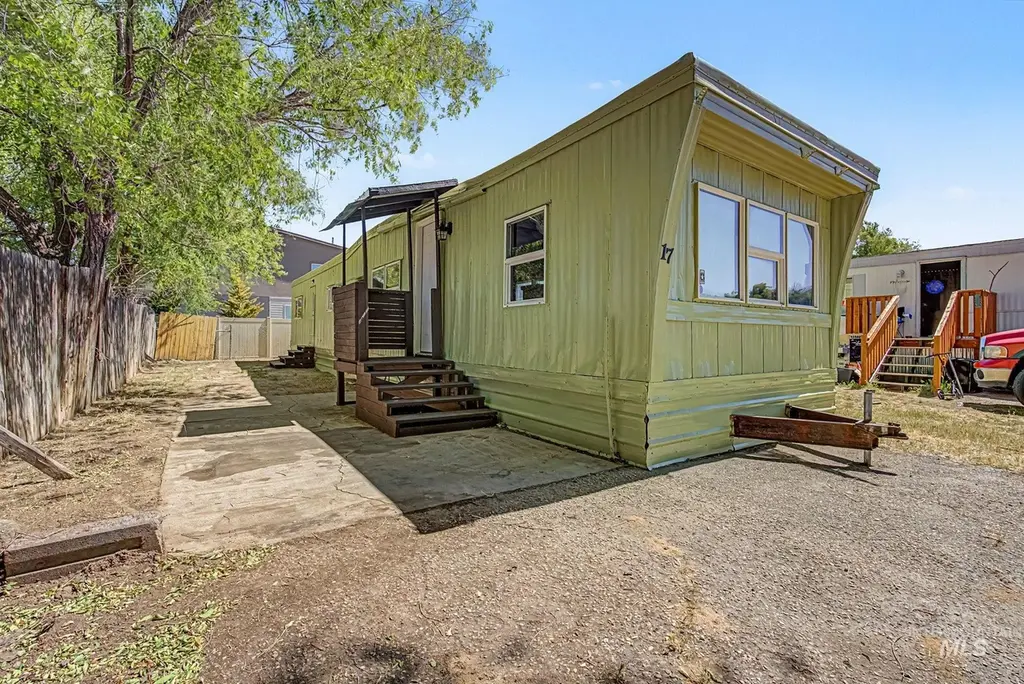
501 E 44th St# 17 · Garden City, ID
Flood risk No data
- FEMA flood zone
- —
- Chance of flooding over 30 yrs
- —
- Est. flood insurance / yr
- —
Fire risk No data
- Est. fire insurance / yr
- —
Heat risk No data
- Hot days now (above threshold)
- —
- Hot days in 30 yrs
- —
Wind risk No data
- Chance of severe wind over 30 yrs
- —
Air-quality risk No data
- Unhealthy air days now
- —
- Unhealthy air days in 30 yrs
- —
Risk factors via First Street. Map © Google.
Why this score? — see what drove the B- grade
The composite is a weighted blend of 9 inputs, each scored 0–100. Each bar is that input's sub-score; the figure is the points it added to the 100-point composite (weight × sub-score).
- Cash flow +30.0/30.0
- 1% rule +10.0/10.0
- DSCR +10.0/10.0
- Schools +4.2/10.0
- Livability +4.1/5.0
- Condition / age +4.0/5.0
- Rent growth +3.7/5.0
- ARV discount +0.0/15.0
- Appreciation +0.0/10.0
$69,999
🖨 Deal sheet 📄 Offer letter ✓ Due diligence
Listing remarks
Completely remodeled manufactured home in a convenient Garden City location. This 2-bedroom, 1-bath home offers 720 square feet of refreshed living space with a clean, move-in-ready feel throughout. The remodeled kitchen features new cabinets, laminate countertops, breakfast bar seating, gas range, refrigerator, and a practical layout that opens into the main living area. Durable LVP flooring flows through the kitchen, living room, and main traffic areas, while carpet in the bedrooms adds warmth and comfort. Additional improvements include a new water heater and updated finishes throughout the home. The open living area provides natural light and efficient use of space, making the home feel
Key facts
- Remodeled kitchen
- New cabinets
- Laminate countertops
Tags
Property features AI
Exterior
- Utilities: City water service; Sewer connected
- Home design: Mobile/manufactured home in a rented-lot mobile home park; Built in 1971
- Construction: Other roof type
- Exterior features: Partial wood and metal fencing; Paved road access
Interior
- Kitchen: Dishwasher; Oven/Range (freestanding); Refrigerator; Pantry
- Bedrooms: 2 bedrooms on the main level
- Bathrooms: 1 bathroom
- Heating & cooling: Electric and natural gas heating with forced air; Wall/window AC unit(s)
- Interior features: Pantry; Laminate counters
- Laundry & utility: Utility room on the main level; Electric water heater; Gas water heater; Tank water heater
Neighborhood map
What this means for you Summary
Snapshot
- This is a 2-bed/1.0-bath manufactured listed at $70k. Condition is rated good.
Deal economics
- At list price, monthly cash flow is $825 ($10k/yr) — positive.
- The deal already cash-flows at list — no discount required.
- Meets the 1% rule at list price ($2k rent vs $70k).
- Recommended offer: $69k (1.5% below list) — sets the bar for market timing.
- Cap rate 20.4% vs local median 2.5% in Garden City — top-decile yield for the area; either an underpriced asset or a hidden risk that comps aren't pricing in. Stress-test before assuming the spread holds.
Location & tenants
- Location reads 82/100 on livability (#11 in ID, #1,264 nationally) — a professional / high-income tenant draw. Strengths: commute A+, health & safety A+, housing A; Watch: crime F.
- Boise Independent District (urban): math 42% / reading 56% proficiency, ranked #36 of 92 in ID (top 39%) — families likely to look elsewhere, expect single-tenant / working-renter base with shorter leases.
- Zoned schools: Whittier Elementary School (math 31% / reading 38%, grade F, #272 of 357 statewide, top 80%, 572 students, 99% FRL); Capital Senior High School (math 34% / reading 57%, grade D-, #59 of 169 statewide, top 35%, 1,220 students, 28% FRL) — zoned schools average 63% FRL vs 33% district-wide (30 pts higher); higher-poverty schools than district average — tighter screening recommended.
- Market conditions: Rents rising fast (+4.9%/yr); 445 active listings in the ZIP; 16 comparable units currently listed for rent nearby; rentals at typical pace (median 23d on market — plan ~3-4 weeks tenant-placement turnaround); solid renter incomes; 5,129 units permitted in Ada County in 2024 (414 in 5+ unit buildings).
Forward outlook
- Local home prices are declining (-3.0%/yr); year-one equity from $484 of loan paydown is wiped out by about $2k of value loss. Plan a longer hold.
- Ada County population projected at +45% by 2050 — long-run rental-demand tailwind backs the buy-and-hold thesis.
- At projected returns (-3.0% appreciation + 4.9% rent growth), your $20k cash investment doubles in ~3 years — after that, you're playing with house money.
Negotiation context
- It's been on market 27 days — a 2% lower offer ($69k) is reasonable based on typical stale-listing flexibility.
- 4 sale attempts since 3y ago with the ask held roughly flat each time — persistent listings suggest the price (not the market) is what's stuck; bring a comps-based counter.
Questions for the listing agent
- Built in 1971 — when were the roof, HVAC, electrical panel, plumbing, and water heater last replaced?
- Is there a deadline driving the sale (1031 exchange, divorce, estate, relocation)? That informs how much negotiation room exists.
- Crime grade is F in this area — have there been break-ins, vandalism, or insurance claims at this property in the last 3 years? What carrier currently insures it and at what premium?
- What's the average days-on-market for RENTAL listings here right now (not sales)? A rising rental-DOM trend means longer vacancies and softer asking-rent achievability than the comps imply.
- What's the recent tenant-quality profile in this submarket — average credit score on applications, eviction rate, late-payment / NSF rate, and stable-employment percentage? A property-management company in the area should have these aggregated.
- How much new for-sale + rental construction is in the pipeline within 1–3 miles? Heavy new supply typically softens prices + rents 12–24 months out; constrained supply supports both.
Investment metrics
- 1% rule
- 2.37% ✓
- Cap rate
- 20.43%
- Cash-on-cash
- 50.49%
- DSCR
- 3.25
- GRM
- 3.5
CMA / ARV
- ARV (on-the-fly)
- $54,000
- Comps found
- 7
Show comp detail 7 sales within ~0.75 mi
| Address | Dist | Beds/Ba | Sqft | Sold | Price | $/sf | Match |
|---|---|---|---|---|---|---|---|
| 415 E 44th St #12 | 0.07mi | 3/1.0 (+1) | 720 (0%) | 5mo | $55,000 | $76 | 88 |
| 301 E 45th St #18 | 0.21mi | 2/1.0 | 728 (+1%) | 24mo | $54,900 | $75 | 69 |
| 208 E 44th St #5 | 0.28mi | 2/1.0 | 672 (-7%) | 10mo | $75,000 | $112 | 67 |
| 3929 Reed St #3 | 0.59mi | 2/1.0 | 672 (-7%) | 14mo | $29,000 | $43 | 50 |
| 122 W 41st St #2 | 0.61mi | 2/1.0 | 672 (-7%) | 13mo | $115,000 | $171 | 50 |
| 308 E 48th St Trlr 6 | 0.57mi | 3/1.0 (+1) | 684 (-5%) | 19mo | $24,900 | $36 | 44 |
| 301 E 40th St #17 | 0.55mi | 2/1.0 | 640 (-11%) | 20mo | $43,000 | $67 | 39 |
Match score weights: distance 35% · size 25% · config 20% · recency 20%. Top-matched comps best support the ARV.
Projected returns pro-forma
-3.0% appreciation · 4.87% rent growth · sell at horizon
- IRR
- 50.4%
- Equity multiple
- 3.26×
- Total profit
- $44,375
- Equity at exit
- $10,437
- IRR
- 56.6%
- Equity multiple
- 7.12×
- Total profit
- $119,900
- Equity at exit
- $6,052
Cash invested: $19,600 (down + closing). Projections, not guarantees.
Landlord ↔ Tenant lean methodology
- Overall (STATE)
- 91 Strongly Landlord-Friendly
- State Idaho
- 91 Strongly Landlord-Friendly · R+18
- County
- — inherits STATE
- City
- — inherits STATE
ZIP-level market 83714
- Home prices YoY
- -31.5%
- Rents YoY
- 4.9%
- Active inventory
- 445
- Price-to-rent
- 3.5×
Monthly cashflow live
- Estimated rent
- $1,656 high interval (Pro) →
- Mortgage (P&I)
- −$367
- Tax est. 1.5%
- −$87 /mo · $1,050/yr
- Insurance
- −$29
- HOA
- −$0
- Vacancy / Maint / Mgmt
- −$348
- Net cashflow
- $825
Break-even live
UW: 25.0% down · 7.5% · 30yr · 1.5% tax · 5.0% vac · 8.0% maint · 8.0% mgmt
Financing live
Cash to close
- Down payment
- $17,500
- Closing costs
- $2,100
- Reserves months
- —
- Total cash needed
- —
Loan-product check · same deal, 3 products live
Conventional
25% down · 7.5% · 30yr
- Down + closing
- —
- Monthly P&I
- —
- Monthly cashflow
- —
- DSCR
- —
- Eligible?
- —
Personal DTI + credit; lowest rate.
DSCR
20% down · 8.5% · 30yr
- Down + closing
- —
- Monthly P&I
- —
- Monthly cashflow
- —
- DSCR
- —
- Eligible?
- —
No personal income docs; deal must DSCR.
Hard money
10% down · 12.0% · 12mo
- Down + closing
- —
- Monthly P&I
- —
- Monthly cashflow
- —
- DSCR
- —
- Eligible?
- —
Short-term bridge; refi at stabilization.
Rent comps 16 comps
| Address | Beds | Baths | Sqft | Rent | $/sqft | DOM | Units | Dist |
|---|---|---|---|---|---|---|---|---|
| 4220 N Adams St Garden City, ID | 2.0 | 1.0–2.0 | 767 | $2,333 | $3.04 | 2d | 7 | 0.24mi |
| 385 E 42nd St Garden City, ID | 1.0–2.0 | 1.0–2.0 | 832 | $1,495 | $1.80 | 3d | 1 | 0.28mi |
| 4632 N Iota Ln Unit 300 Garden City, ID | 1.0 | 1.0 | 563 | $1,375 | $2.44 | 23d | 1 | 0.33mi |
| 4632 N Iota Ln Unit 200 Garden City, ID | 1.0 | 1.0 | 563 | $1,375 | $2.44 | 19d | 1 | 0.33mi |
| 4633 N Iota Ln Unit 201 Garden City, ID | 1.0 | 1.0 | 563 | $1,375 | $2.44 | 23d | 1 | 0.34mi |
| 521 E 41st St Garden City, ID | 2.0 | 1.0–2.0 | 814 | $5,000 | $6.14 | 23d | 18 | 0.39mi |
| 331 E 40th St Garden City, ID | 2.0 | 2.0 | 678 | $1,875 | $2.77 | 2d | 1 | 0.52mi |
| 3115 Sycamore Dr Boise, ID | 1.0 | 1.0 | 454 | $1,520 | $3.35 | 23d | 1 | 0.81mi |
| 3304 N Lakeharbor Ln Boise, ID | 1.0–3.0 | 1.0–2.0 | 1000 | $1,935 | $1.94 | 2d | 16 | 0.83mi |
| 1901 N 32nd St Boise, ID | 2.0 | 1.0 | 616 | $1,245 | $2.02 | 23d | 1 | 1.03mi |
| 1680 N Phillippi St Boise, ID | 1.0 | 1.0 | 450 | $1,145 | $2.54 | 23d | 1 | 1.24mi |
| 7460 W Holbrook Ln Boise, ID | 1.0 | 1.0 | 674 | $1,095 | $1.62 | 23d | 1 | 1.44mi |
| 2815 Madison Ave Boise, ID | 1.0 | 1.0 | 423 | $1,240 | $2.93 | 3d | 3 | 1.46mi |
| 1677 N Raymond St Boise, ID | 1.0 | 1.0 | 685 | $1,395 | $2.04 | 23d | 1 | 1.46mi |
| 7479 W Holbrook Ln Boise, ID | 1.0 | 1.0 | 650 | $1,095 | $1.68 | 23d | 1 | 1.47mi |
| 2722 N Retirement Ln Boise, ID | 1.0 | 1.0 | 590 | $1,095 | $1.86 | 23d | 1 | 1.48mi |
Listing history 22 events
-
2026-06-18days on market $69,999 Active 27 DOM
-
2026-06-17days on market $69,999 Active 26 DOM
-
2026-06-16days on market $69,999 Active 25 DOM
-
2026-06-15days on market $69,999 Active 24 DOM
-
2026-06-13days on market $69,999 Active 22 DOM
-
2026-06-10days on market $69,999 Active 19 DOM
-
2026-06-09days on market $69,999 Active 18 DOM
-
2026-06-08days on market $69,999 Active 17 DOM
-
2026-06-07days on market $69,999 Active 16 DOM
-
2026-06-05days on market $69,999 Active 13 DOM
-
2026-06-03days on market $69,999 Active 12 DOM
-
2026-06-03days on market $69,999 Active 11 DOM
-
2026-06-01days on market $69,999 Active 10 DOM
-
2026-05-31days on market $69,999 Active 9 DOM
-
2026-05-22$69,999 Active
-
2025-07-06historical $72,900
-
2025-04-24$72,900
-
2025-01-10historical $59,900
-
2025-01-04$59,900
-
2023-05-08historical
-
2023-03-31price $52,500
-
2023-03-06$55,000 Active
ⓘ Source: listings_history table (triggers on properties + properties_extension) + one-shot
backfill from property_details.listing_events for pre-trigger history.
Nearby sold comps map
Loading sold comps map…
Walkable amenities ~0.75 mi
Loading nearby amenities…
Taxation est. · year 1
- Rental income
- $19,873
- − Mortgage interest
- −$3,921
- − Property taxes
- −$1,050
- − Insurance
- −$350
- − Repairs & maintenance
- −$1,590
- − Management
- −$1,590
- − Depreciation
- −$2,036
- Taxable income
- $9,336
- Est. tax owed @ 24.0%
- −$2,241
- After-tax cash flow
- $7,654/yr
For passive investors: Depreciation is non-cash, so a rental often shows a tax loss while cash-flowing — sheltering income. Rental losses are passive: they offset passive income freely, and up to $25,000/yr can offset ordinary (W-2) income if you actively participate and your MAGI is under $100k (phasing out to $0 by $150k); unused losses carry forward. On sale, claimed depreciation is recaptured at up to 25%, and gains may owe capital-gains tax (a 1031 exchange can defer both). Figures are a year-1 estimate at your 24.0% rate — not tax advice; consult a CPA.
Condition & rehab AI · 13 photos
This completely remodeled manufactured home in Garden City is in good condition with cosmetic updates, making it a move-in-ready property with good resale and rental potential.
Value-add opportunities
- Both paint exterior — enhances curb appeal and resale value
- Both replace carpet in bedrooms — improves comfort and rental appeal
Renovation cost estimate screening
Value-add ROI direction
- Both paint exterior — enhances curb appeal and resale value ↑
- Both replace carpet in bedrooms — improves comfort and rental appeal ↑
ⓘ Cost ranges are severity-bucket heuristics (US national rule-of-thumb). Get contractor quotes + a written scope before underwriting a rehab budget.
Schools (NCES district)
- District
- Boise Independent District
- NCES district ID
- 1600360
- Math proficiency
- 42% ▼ -5.00%
- Reading proficiency
- 56% ▼ -1.00%
- Median HH income
- $49,135
- Composite
- 41.82/100
- National rank
- #3388
- State rank
- #36 of 92 in ID
Livability — Garden City
- Score
- 82/100
- State rank
- #11
- US rank
- #1264
Category grades
Schools grade is shown separately in the Schools card above.
Census & demographics
- Census place
- Garden City, ID
- County
- Ada County · 522,161 people
- Metro
- Boise City, ID
- Population (ZIP)
- 27,564
- Household income
- $87,651
- Rent vs Own
- Severe rent burden
- 557.0
Population outlook (Ada County) Hauer SSP2
- Today (2025)
- 535,818 people
- By 2030
- 585,751 · +9.3%
- By 2040
- 682,435 · +27.4%
- By 2050
- 775,818 · +44.8%
- By 2075
- 994,458 · +85.6%
- By 2100
- 1,148,884 · +114.4%
Race, ethnicity, and origin ACS 2023
- Neighborhood character
- Predominantly White (86%)
- Race & ethnicity
- White 86% Hispanic / Latino 9% Two or more races 7%
- Hispanic origin (detail)
- Mexican 7%
- Common ancestry
- Italian 4% Slovak 4% Portuguese 4%
- Foreign-born
- 5% · Canada
- Languages at home
- 92% English-only · Spanish 5% Russian/Polish/Slavic 2% Other Indo-European 1%
Political lean MEDSL · Ada
- 2024 margin
- R (+10.3) · D 43.4% · R 53.8% · Other 2.8%
- 2008→2024 swing
- -4.2pp toward R · 2008: -6.2pp · 2024: -10.3pp
- All cycles
- 2024: R+10.3 2020: R+3.9 2016: R+9.2 2012: R+11.3 2008: R+6.2
Not yet ingested
- Civics
- —
Market trends
- HPI YoY
- ▼ -155.87%
- Current HPI
- 339.0701
- Rent YoY
- ▲ 4.87%
- Metro
- Boise City, ID
- State GDP YoY
- ▲ 4.51%
- F500 in state
- 6
Industry mix (Fortune 500 HQ in ID)
| Industry | F500 HQs | Revenue |
|---|---|---|
| Retail | 1 | $79B |
|
||
| Technology | 1 | $25B |
|
||
| Food / Agriculture | 1 | $6B |
|
||
Price history
+27.3% since first listed8 events — show timeline
- 2026-05-22 Listed $69,999 IMLS
- 2025-07-06 Rental Removed $72,900 LISTANZA
- 2025-04-24 Listed for Rent $72,900 LISTANZA
- 2025-01-10 Rental Removed $59,900 LISTANZA
- 2025-01-04 Listed for Rent $59,900 LISTANZA
- 2023-05-08 Listing Removed — IMLS
- 2023-03-31 Price Changed $52,500 IMLS
- 2023-03-06 Listed $55,000 IMLS
Cash-flow waterfall
monthlySold comps — $/sqft
last 12 mo · ≤1 miLoading sold comps…