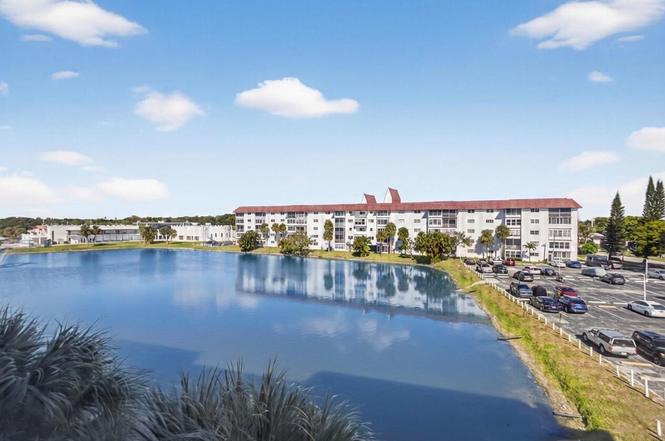
4751 NW 21st St #417 · Lauderhill, FL
Flood risk 1/10 · Minimal
- FEMA flood zone
- X (shaded)
- Chance of flooding over 30 yrs
- 0.0%
- Est. flood insurance / yr
- $507 – $1,088
Fire risk 1/10 · Minimal
- Est. fire insurance / yr
- $947 – $1,759
Heat risk 10/10 · Severe
- Hot days now (above 105°F)
- 7 days/yr
- Hot days in 30 yrs
- 26 days/yr
Wind risk 10/10 · Severe
- Chance of severe wind over 30 yrs
- 99.0%
Air-quality risk 3/10 · Minor
- Unhealthy air days now
- 3 days/yr
- Unhealthy air days in 30 yrs
- 3 days/yr
Risk factors via First Street. Map © Google.
Why this score? — see what drove the C- grade
The composite is a weighted blend of 9 inputs, each scored 0–100. Each bar is that input's sub-score; the figure is the points it added to the 100-point composite (weight × sub-score).
- Cash flow +16.8/30.0
- 1% rule +10.0/10.0
- ARV discount +7.5/15.0
- DSCR +5.2/10.0
- Schools +4.1/10.0
- Livability +4.0/5.0
- Rent growth +2.6/5.0
- Condition / age +2.5/5.0
- Appreciation +0.0/10.0
$87,500
🖨 Deal sheet (PDF) 📄 Offer letter ✓ Due diligence
Listing remarks
Welcome To Castle Gardens, A Newly Updated Complex. 50 Year Inspection Complete. This 1 Bed, 1.5 Bath Unit Features An Open Area With Natural Light & A Private Balcony Perfect With Relaxing LAKE VIEWS. The Kitchen Has Ample Cabinet & Counter Space, While It's Bedroom Provides A Quiet & Comfortable Retreat. This Community Incudes A Clubhouse, Library, Lounges, Media Room, Movie Theater, Bowling Alley, Billiards, Card Room, Game Room, Fitness Center, Sauna, Steam Room, Water Aerobics, Group Fitness, 3 Heated Pools, Shuffleboard Tennis & Pickleball Courts, Courtesy Bus, Common Laundry Facilities, Landscaping Services, Secure Entry, Picnic Areas, & BBQ Areas. Close
Key facts
- $526 HOA
- Parking
- Community pool
Property features AI
Finance
- HOA & community: Monthly HOA ($526) covering insurance, grounds maintenance, pest control, security, sewer, trash, water, common areas, elevator, hot water, and recreation facilities; Community amenities: billiard room, clubhouse, elevator(s), fitness center, game room, laundry, picnic area, pool, sauna, shuffleboard court, spa/hot tub, storage, tennis courts, workshop area, trash chute, library; Pets allowed (restrictions and limits possible); Senior community
Exterior
- Parking: Assigned parking; Guest parking; One open parking space
- Security: Key card entry; Security system; Entry phone/intercom
- Utilities: Public water; Public sewer; Three-phase electric; Cable available; Water available; Sewer available
- Home design: Condominium; Resale property; Entry-level living area; Faces south; 6-story building
- Construction: Block and concrete construction
- Exterior features: Porch; Glass-enclosed porch; Waterfront
Interior
- Kitchen: Dishwasher; Refrigerator; Electric water heater
- Bedrooms: 1 main level bedroom
- Flooring: Ceramic tile; Laminate
- Bathrooms: 1 full bathroom; 1 half bathroom (2 total bathrooms)
- Heating & cooling: Central heating; Central air; Ceiling fan(s)
- Interior features: Built-in features; Walk-in closet(s); Partially furnished
- Laundry & utility: Laundry facilities in building
Neighborhood map
What this means for you Summary
Snapshot
- This is a 1-bed/2.0-bath condo listed at $88k.
Deal economics
- At list price, monthly cash flow is $56 ($669/yr) — positive.
- The deal already cash-flows at list — no discount required.
- Meets the 1% rule at list price ($2k rent vs $88k).
- Recommended offer: $77k (12.0% below list) — sets the bar for market timing.
- Cap rate 7.1% vs local median 4.3% in Lauderhill — top-decile yield for the area; either an underpriced asset or a hidden risk that comps aren't pricing in. Stress-test before assuming the spread holds.
Location & tenants
- Location reads 79/100 on livability (#139 in FL, #2,059 nationally) — a middle-class / working-renter tenant base. Strengths: commute A+, cost of living A+, housing A+; Watch: employment D, amenities F.
- Broward (suburban): math 42% / reading 53% proficiency, ranked #46 of 73 in FL (top 63%) — families likely to look elsewhere, expect single-tenant / working-renter base with shorter leases.
- Zoned schools: Castle Hill Elementary School (math 22% / reading 22%, grade F, #2,080 of 2,144 statewide, top 97%, 562 students, 86% FRL); Boyd H. Anderson High School (math 10% / reading 14%, grade F, #622 of 667 statewide, top 93%, 2,038 students, 72% FRL) — zoned schools average 79% FRL vs 51% district-wide (28 pts higher); higher-poverty schools than district average — tighter screening recommended.
- Zoned-school proficiency averages 17% at this address vs 48% district-wide (-30 pts) — the specific schools serving this property underperform the Broward average; the district grade overstates school quality for this exact location.
- Market conditions: Rents flat; 656 active listings in the ZIP; 40 comparable units currently listed for rent nearby; rentals at typical pace (median 23d on market — plan ~3-4 weeks tenant-placement turnaround); 2,111 units permitted in Broward County in 2024 (1,265 in 5+ unit buildings).
Forward outlook
- Local home prices are declining (-3.0%/yr); year-one equity from $605 of loan paydown is wiped out by about $3k of value loss. Plan a longer hold.
- Broward County population projected at +34% by 2050 — long-run rental-demand tailwind backs the buy-and-hold thesis.
Negotiation context
- It's been on market 147 days — a 12% lower offer ($77k) is reasonable based on typical stale-listing flexibility.
- 3 sale attempts with the ask held roughly flat each time — persistent listings suggest the price (not the market) is what's stuck; bring a comps-based counter.
- Current owner paid $65k; 35% above their basis — modest negotiation headroom, anchor on the comps not their cost.
Risks & watch-outs
- Watch-outs: property tax is 2.6% of price; HOA is 33% of rent.
- Climate carrying-cost: severe wind risk, 99% chance of damaging wind over 30y; extreme-heat days projected 7→26/yr by 2055 (HVAC capex compounding) — expect insurance premiums to compound above CPI over the hold.
Questions for the listing agent
- It's been on market 147 days. Have you received any prior offers? Is the seller open to a 12% concession, seller financing, or rate buy-down credit?
- Built in 1974 — when were the roof, HVAC, electrical panel, plumbing, and water heater last replaced?
- Property tax is high relative to price — has the assessment been appealed recently, and will the sale trigger a re-assessment?
- What does the HOA fee cover, when was the last increase, and are there any pending special assessments or reserve-fund shortfalls?
- Any open or pending special assessments — roof, HVAC, plumbing, elevator, façade? What's the per-unit balance and payoff schedule, and is the seller paying it off at close or rolling it to the buyer?
- Why hasn't it sold? Are there any deal-killer items the seller is aware of (foundation, flood, title, zoning, code violations)?
- Is there a deadline driving the sale (1031 exchange, divorce, estate, relocation)? That informs how much negotiation room exists.
- Schools are D-rated, which usually means shorter tenancies and higher turnover. Who's the typical renter profile here, and what's been the actual vacancy rate?
- What's the average days-on-market for RENTAL listings here right now (not sales)? A rising rental-DOM trend means longer vacancies and softer asking-rent achievability than the comps imply.
- What's the recent tenant-quality profile in this submarket — average credit score on applications, eviction rate, late-payment / NSF rate, and stable-employment percentage? A property-management company in the area should have these aggregated.
- How much new apartment / multifamily construction is in the pipeline within 1–3 miles? Heavy new supply (>2% of stock underway) typically softens rents 12–24 months out; light construction supports rent growth.
Investment metrics
- 1% rule
- 1.84% ✓
- Cap rate
- 7.06%
- Cash-on-cash
- 2.73%
- DSCR
- 1.12
- GRM
- 4.5
CMA / ARV
No comps found within radius.
Projected returns pro-forma
-3.0% appreciation · 0.26% rent growth · sell at horizon
- IRR
- -17.7%
- Equity multiple
- 0.41×
- Total profit
- $-14,543
- Equity at exit
- $13,047
- IRR
- -26.5%
- Equity multiple
- 0.05×
- Total profit
- $-23,228
- Equity at exit
- $7,565
Cash invested: $24,500 (down + closing). Projections, not guarantees.
Landlord ↔ Tenant lean methodology
- Overall (STATE)
- 87 Strongly Landlord-Friendly
- State Florida
- 87 Strongly Landlord-Friendly · R+3
- County
- — inherits STATE
- City
- — inherits STATE
ZIP-level market 33313
- Rents YoY
- 0.3%
- Active inventory
- 656
- Price-to-rent
- 4.5×
Monthly cashflow live
- Estimated rent
- $1,607 high interval (Pro) →
- Mortgage (P&I)
- −$459
- Tax from tax record
- −$193 /mo · $2,312/yr
- Insurance
- −$36
- HOA
- −$526
- Vacancy / Maint / Mgmt
- −$338
- Net cashflow
- $56
Break-even live
Sensitivity live
| Price | -10% $105 | -5% $80 | +0% $56 | +5% $31 | +10% $6 |
|---|---|---|---|---|---|
| Rent | -10% $-71 | -5% $-8 | +0% $56 | +5% $119 | +10% $183 |
| Rate | -1.0pp $100 | -0.5pp $78 | base $56 | +0.5pp $33 | +1.0pp $10 |
UW: 25.0% down · 7.5% · 30yr · 1.5% tax · 5.0% vac · 8.0% maint · 8.0% mgmt
Financing live
Cash to close
- Down payment
- $21,875
- Closing costs
- $2,625
- Reserves months
- —
- Total cash needed
- —
Loan-product check · same deal, 3 products live
Conventional
25% down · 7.5% · 30yr
- Down + closing
- —
- Monthly P&I
- —
- Monthly cashflow
- —
- DSCR
- —
- Eligible?
- —
Personal DTI + credit; lowest rate.
DSCR
20% down · 8.5% · 30yr
- Down + closing
- —
- Monthly P&I
- —
- Monthly cashflow
- —
- DSCR
- —
- Eligible?
- —
No personal income docs; deal must DSCR.
Hard money
10% down · 12.0% · 12mo
- Down + closing
- —
- Monthly P&I
- —
- Monthly cashflow
- —
- DSCR
- —
- Eligible?
- —
Short-term bridge; refi at stabilization.
Rent comps 40 comps
| Address | Beds | Baths | Sqft | Rent | $/sqft | DOM | Units | Dist |
|---|---|---|---|---|---|---|---|---|
| 4740 NW 21st St Lauderhill, FL | 1.0 | 1.5 | 1003 | $1,575 | $1.57 | 20d | 2 | 0.04mi |
| 2061 NW 47th Ter Lauderhill, FL | 1.0 | 1.5 | 928 | $1,620 | $1.75 | 4d | 2 | 0.08mi |
| 4750 NW 22nd Ct #502 Lauderhill, FL | 1.0 | 1.5 | 928 | $1,600 | $1.72 | 25d | 1 | 0.09mi |
| 2060 NW 48th Ter Lauderhill, FL | 1.0–2.0 | 1.0–2.0 | 886 | $1,395 | $1.57 | 8d | 2 | 0.10mi |
| 4851 NW 21st St Unit 2P Lauderhill, FL | 1.0 | 1.5 | 1074 | $1,400 | $1.30 | 25d | 1 | 0.10mi |
| 2017 NW 46th Ave Unit A110 Lauderhill, FL | 1.0 | 1.5 | 800 | $1,650 | $2.06 | 25d | 1 | 0.21mi |
| 2029 NW 46th Ave Lauderhill, FL | 1.0 | 1.5 | 800 | $1,500 | $1.88 | 25d | 1 | 0.21mi |
| 4848 NW 24th Ct Lauderdale Lakes, FL | 1.0–3.0 | 1.0–2.0 | 1045 | $1,450 | $1.39 | 6d | 4 | 0.27mi |
| 4848 NW 24th Ct Lauderdale Lakes, FL | 1.0–3.0 | 1.0–2.0 | 1045 | $1,550 | $1.48 | 17d | 3 | 0.27mi |
| 1861 NW 46th Ave Lauderhill, FL | 2.0 | 1.0–2.0 | 730 | $1,490 | $2.04 | 2d | 13 | 0.34mi |
| 4491 NW 19th St Lauderhill, FL | 1.0–3.0 | 1.0–2.5 | 1358 | $1,550 | $1.14 | 2d | 39 | 0.35mi |
| 2070 NW 43rd Ter #6 Lauderhill, FL | 1.0 | 1.0 | 600 | $1,600 | $2.67 | 22d | 1 | 0.40mi |
| 1701 NW 46th Ave #109 Lauderhill, FL | 2.0 | 2.0 | 828 | $1,800 | $2.17 | 22d | 1 | 0.45mi |
| 2306 NW 52nd Ave Lauderhill, FL | 2.0 | 1.5 | 1020 | $1,900 | $1.86 | 17d | 1 | 0.46mi |
| 5321 NW 21st Ct Lauderhill, FL | 2.0 | 1.0 | 750 | $1,900 | $2.53 | 25d | 1 | 0.49mi |
| 2410 NW 52nd Ave #2410 Lauderhill, FL | 2.0 | 1.5 | 1020 | $1,700 | $1.67 | 6d | 1 | 0.49mi |
| 2410 NW 52nd Ave #2410 Lauderhill, FL | 2.0 | 1.5 | 1020 | $1,700 | $1.67 | 14d | 1 | 0.49mi |
| 4851 NW 26th Ct #338 Lauderdale Lakes, FL | 1.0 | 1.0 | 705 | $1,650 | $2.34 | 17d | 1 | 0.51mi |
| 1631 NW 46th Ave #118 Lauderhill, FL | 2.0 | 2.0 | 828 | $1,750 | $2.11 | 25d | 1 | 0.52mi |
| 5411 NW 22nd St Unit 5411 Lauderhill, FL | 2.0 | 1.0 | 850 | $2,050 | $2.41 | 13d | 1 | 0.53mi |
| 5411 NW 22nd St Unit 5411 Lauderhill, FL | 2.0 | 1.0 | 850 | $2,050 | $2.41 | 6d | 1 | 0.53mi |
| 5415 NW 22nd St #5415 Lauderhill, FL | 2.0 | 1.0 | 936 | $2,150 | $2.30 | 25d | 1 | 0.53mi |
| 5314 NW 24th St #143 Lauderhill, FL | 2.0 | 1.0 | 829 | $1,995 | $2.41 | 21d | 1 | 0.54mi |
| 4240 NW 21st St #134 Lauderhill, FL | 1.0 | 1.0 | 812 | $1,500 | $1.85 | 25d | 1 | 0.54mi |
| 1621 NW 46th Ave #101 Lauderhill, FL | 1.0 | 1.0 | 576 | $1,600 | $2.78 | 25d | 1 | 0.54mi |
| 5405 NW 23rd St #187 Lauderhill, FL | 2.0 | 1.0 | 829 | $1,850 | $2.23 | 4d | 1 | 0.55mi |
| 2512 NW 52nd Ave Unit 22B Lauderhill, FL | 2.0 | 1.5 | 940 | $1,700 | $1.81 | 18d | 1 | 0.56mi |
| 4321 NW 16th St Unit 202C Lauderhill, FL | 2.0 | 2.0 | 867 | $1,700 | $1.96 | 25d | 1 | 0.56mi |
| 5323 NW 24th St #118 Lauderhill, FL | 2.0 | 1.0 | 829 | $1,550 | $1.87 | 25d | 1 | 0.56mi |
| 4160 NW 21st St Lauderhill, FL | 1.0–2.0 | 1.0 | 810 | $1,599 | $1.97 | 8d | 2 | 0.58mi |
| 4160 NW 21st St Lauderhill, FL | 1.0–2.0 | 1.0 | 810 | $1,675 | $2.07 | 25d | 3 | 0.58mi |
| 2552 NW 52nd Ave Unit B19 Lauderhill, FL | 2.0 | 1.5 | 940 | $1,900 | $2.02 | 4d | 1 | 0.59mi |
| 2800 NW 47th Ter Unit 106B Lauderdale Lakes, FL | 1.0 | 1.0 | 768 | $1,650 | $2.15 | 25d | 1 | 0.61mi |
| 2101 NW 55th Ave Lauderhill, FL | 2.0 | 2.0 | 900 | $1,949 | $2.17 | 2d | 8 | 0.62mi |
| 2606 NW 52nd Ave Unit D15 Lauderhill, FL | 2.0 | 1.5 | 1020 | $1,950 | $1.91 | 25d | 1 | 0.62mi |
| 2604 NW 52nd Ave Unit C15 Lauderhill, FL | 2.0 | 1.5 | 940 | $1,800 | $1.91 | 25d | 1 | 0.62mi |
| 4299 NW 16th St #103 Lauderhill, FL | 1.0 | 1.0 | 700 | $1,400 | $2.00 | 8d | 1 | 0.63mi |
| 4299 NW 16th St #103 Lauderhill, FL | 1.0 | 1.0 | 700 | $1,400 | $2.00 | 25d | 1 | 0.63mi |
| 2861 NW 47th Ter Lauderdale Lakes, FL | 2.0 | 2.0 | 1021 | $1,700 | $1.67 | 25d | 1 | 0.64mi |
| 2861 NW 47th Ter Unit 207B Lauderdale Lakes, FL | 1.0 | 1.0 | 768 | $1,400 | $1.82 | 25d | 1 | 0.64mi |
HOA detail condo
- Monthly dues
- $526 · $6,312/yr
- Likely covers
- waterlandscapingpoolgym
- Assessments
- None detected in remarks — confirm with the listing agent.
Listing history 23 events
-
2026-06-18days on market $87,500 Active 147 DOM
-
2026-06-17days on market $87,500 Active 146 DOM
-
2026-06-16days on market $87,500 Active 145 DOM
-
2026-06-15days on market $87,500 Active 144 DOM
-
2026-06-13days on market $87,500 Active 142 DOM
-
2026-06-09days on market $87,500 Active 138 DOM
-
2026-06-07days on market $87,500 Active 136 DOM
-
2026-06-04days on market $87,500 Active 133 DOM
-
2026-06-03days on market $87,500 Active 132 DOM
-
2026-06-02days on market $87,500 Active 131 DOM
-
2026-06-01days on market $87,500 Active 130 DOM
-
2026-05-31days on market $87,500 Active 129 DOM
-
2026-04-20status Active
-
2026-04-20price $87,500
-
2026-03-25historical Active Under Contract
-
2026-03-18status Active
-
2026-02-17historical Active Under Contract
-
2026-01-22$90,000 Active
-
2026-01-22historical $90,000
-
2006-07-14soldstatus $65,000
-
2006-07-14soldstatus $32,500
-
1980-07-01soldstatus $41,000
-
1973-09-01soldstatus $26,000
ⓘ Source: listings_history table (triggers on properties + properties_extension) + one-shot
backfill from property_details.listing_events for pre-trigger history.
Tax reassessment forecast FL · Resets to sale price
- Current annual tax
- $2,312 · $193/mo
- Projected year-2 tax
- $2,312 · $193/mo
- Expected delta
- $0/yr ($0/mo · 0.0%)
ⓘ Screening estimate from a state-policy table — verify with the county assessor before closing.
Climate risk First Street
- Flood 1/10 Low FEMA zone X (shaded) · 0% chance over 30 yrs
- Wildfire 1/10 Low
- Heat 10/10 Extreme 7 d/yr ≥105°F today · 26 d/yr by 30 yrs out
- Wind 10/10 Extreme 99% chance of damaging wind over 30 yrs
- Air quality 3/10 Moderate 3 unhealthy d/yr today · 3 by 30 yrs out
Nearby sold comps map
Loading sold comps map…
Walkable amenities ~0.75 mi
Loading nearby amenities…
Taxation est. · year 1
- Rental income
- $19,287
- − Mortgage interest
- −$4,901
- − Property taxes
- −$2,312
- − Insurance
- −$438
- − Repairs & maintenance
- −$1,543
- − Management
- −$1,543
- − HOA
- −$6,312
- − Depreciation
- −$2,545
- Taxable loss
- −$307
- Est. tax savings @ 24.0%
- +$74
- After-tax cash flow
- $743/yr
For passive investors: Depreciation is non-cash, so a rental often shows a tax loss while cash-flowing — sheltering income. Rental losses are passive: they offset passive income freely, and up to $25,000/yr can offset ordinary (W-2) income if you actively participate and your MAGI is under $100k (phasing out to $0 by $150k); unused losses carry forward. On sale, claimed depreciation is recaptured at up to 25%, and gains may owe capital-gains tax (a 1031 exchange can defer both). Figures are a year-1 estimate at your 24.0% rate — not tax advice; consult a CPA.
Schools (NCES district)
- District
- Broward
- NCES district ID
- 1200180
- Math proficiency
- 42% ▼ -18.00%
- Reading proficiency
- 53% ▼ -5.00%
- Median HH income
- $52,139
- Composite
- 40.88/100
- National rank
- #3621
- State rank
- #46 of 73 in FL
Livability — Lauderhill
- Score
- 79/100
- State rank
- #139
- US rank
- #2059
Category grades
Schools grade is shown separately in the Schools card above.
Census & demographics
- Census place
- Lauderhill, FL
- County
- Broward County · 1,963,430 people
- City population
- 62,807
- Metro
- Miami-Fort Lauderdale-Pompano Beach, FL
- Population (ZIP)
- 62,807
- Household income
- $46,305
- Rent vs Own
- Severe rent burden
- 5692.0
Population outlook (Broward County) Hauer SSP2
- Today (2025)
- 2,207,033 people
- By 2030
- 2,360,704 · +7.0%
- By 2040
- 2,661,208 · +20.6%
- By 2050
- 2,946,698 · +33.5%
- By 2075
- 3,602,273 · +63.2%
- By 2100
- 3,970,984 · +79.9%
Race, ethnicity, and origin ACS 2023
- Neighborhood character
- Predominantly Black (77%)
- Race & ethnicity
- Black 77% Hispanic / Latino 12% Two or more races 8% White 7% Asian 2%
- Hispanic origin (detail)
- Puerto Rican 2% Cuban 3% Dominican 1%
- Common ancestry
- Hispanic 20%
- Foreign-born
- 39% · Canada, Jamaica, Dominican Republic
- Languages at home
- 66% English-only · French/Haitian/Cajun 22% Spanish 10%
Political lean MEDSL · Broward
- 2024 margin
- D (+17.0) · D 58.0% · R 41.0%
- 2008→2024 swing
- -17.8pp toward R · 2008: 34.7pp · 2024: 17.0pp
- All cycles
- 2024: D+17.0 2020: D+29.8 2016: D+35.0 2012: D+34.9 2008: D+34.7
Not yet ingested
- Civics
- —
Market trends
- HPI YoY
- ▼ -338.15%
- Current HPI
- 288.9345
- Rent YoY
- ▲ 0.26%
- Metro
- Miami-Fort Lauderdale-Pompano Beach, FL
- State GDP YoY
- ▲ 3.28%
- F500 in state
- 36
Industry mix (Fortune 500 HQ in FL)
| Industry | F500 HQs | Revenue |
|---|---|---|
| Industrial Technology | 2 | $29B |
|
||
| Insurance | 2 | $17B |
|
||
| Retail | 1 | $60B |
|
||
| Technology Distribution | 1 | $58B |
|
||
| Homebuilding | 1 | $35B |
|
||
| Technology Manufacturing | 1 | $35B |
|
||
Price history
+236.5% since first listed11 events — show timeline
- 2026-04-20 Relisted — Beaches MLS
- 2026-04-20 Price Changed $87,500 Beaches MLS
- 2026-03-25 Contingent — Beaches MLS
- 2026-03-18 Relisted — Beaches MLS
- 2026-02-17 Contingent — Beaches MLS
- 2026-01-22 Listed $90,000 Beaches MLS
- 2026-01-22 Coming Soon $90,000 Beaches MLS
- 2006-07-14 Sold (Public Records) $32,500 Public Records
- 2006-07-14 Sold (Public Records) $65,000 Public Records
- 1980-07-01 Sold (Public Records) $41,000 Public Records
- 1973-09-01 Sold (Public Records) $26,000 Public Records
Property tax history
+7.3%/yrLatest (2025): $2,312 · +2.5% YoY. Source: county tax records.
Cash-flow waterfall
monthlySold comps — $/sqft
last 12 mo · ≤1 miLoading sold comps…