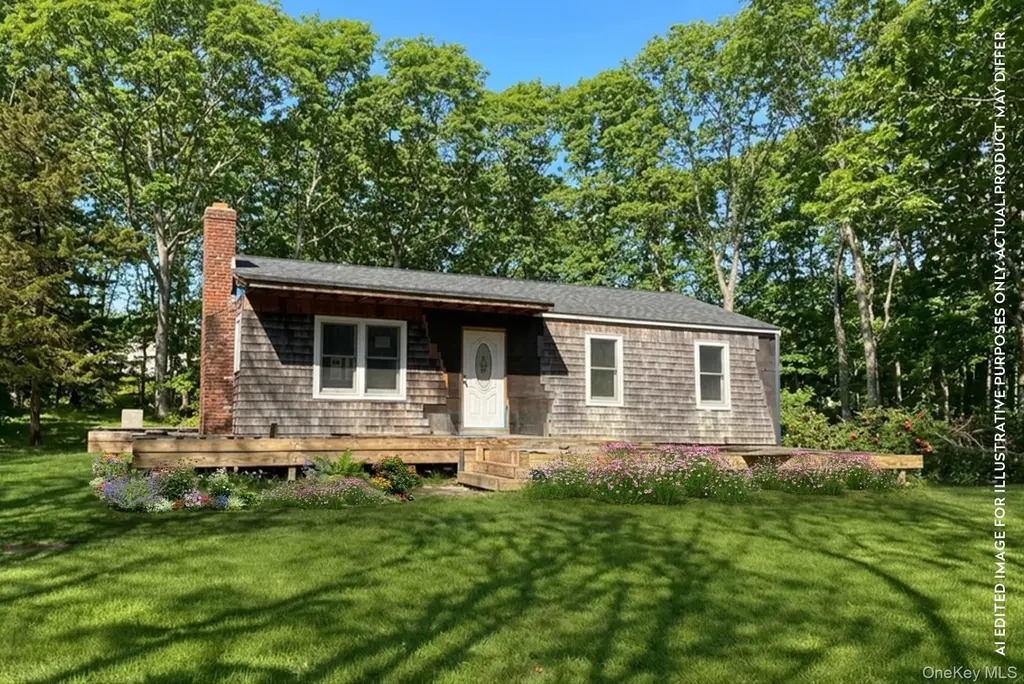
9 Clinton St · Springs, NY
Flood risk 1/10 · Minimal
- FEMA flood zone
- X (unshaded)
- Chance of flooding over 30 yrs
- 0.0%
- Est. flood insurance / yr
- $473 – $860
Fire risk 1/10 · Minimal
- Est. fire insurance / yr
- $691 – $1,283
Heat risk 4/10 · Minor
- Hot days now (above 89°F)
- 7 days/yr
- Hot days in 30 yrs
- 19 days/yr
Wind risk 8/10 · Major
- Chance of severe wind over 30 yrs
- 80.0%
Air-quality risk 3/10 · Minor
- Unhealthy air days now
- 2 days/yr
- Unhealthy air days in 30 yrs
- 3 days/yr
Risk factors via First Street. Map © Google.
Why this score? — see what drove the B+ grade
The composite is a weighted blend of 9 inputs, each scored 0–100. Each bar is that input's sub-score; the figure is the points it added to the 100-point composite (weight × sub-score).
- Cash flow +30.0/30.0
- ARV discount +13.2/15.0
- 1% rule +10.0/10.0
- DSCR +10.0/10.0
- Schools +5.1/10.0
- Rent growth +5.0/5.0
- Livability +3.2/5.0
- Condition / age +2.5/5.0
- Appreciation +0.0/10.0
$1,150,000
🖨 Deal sheet 📄 Offer letter ✓ Due diligence
Listing remarks MLS
Ready to make this charming Springs cottage yours! 3 bedrooms, 3 bathrooms, 1,250 sqft of cozy renovation potential. Features include: New roof, wood-burning fireplace, wrap-around deck. Plans by world renowned interior designer also included. 0.67 acres on a serene tree-lined street.
Key facts
- Wrap around deck
- New roof
- 0.53 acre lot
Tags
Neighborhood map
What this means for you Summary
Snapshot
- This is a 3-bed/3.0-bath single-family listed at $1.15M.
Deal economics
- At list price, monthly cash flow is $9k ($108k/yr) — positive.
- The deal already cash-flows at list — no discount required.
- Meets the 1% rule at list price ($20k rent vs $1.15M).
- Recommended offer: $1.08M (6.0% below list) — sets the bar for market timing.
- Cap rate 15.7% vs local median 11.1% in Springs — top-decile yield for the area; either an underpriced asset or a hidden risk that comps aren't pricing in. Stress-test before assuming the spread holds.
Location & tenants
- Location reads 63/100 on livability (#809 in NY) — a middle-class / working-renter tenant base. Strengths: crime A+, employment A+; Watch: housing C-, schools D-, amenities F.
- Springs Union Free School District (town): math 55% / reading 60% proficiency, ranked #239 of 590 in NY (top 40%) — acceptable for families but not a draw, mixed tenant base, ~2y average lease; only 9% free/reduced lunch — higher-income household profile.
- Market conditions: Rents rising fast (+12.3%/yr); 135 active listings in the ZIP; 7 comparable units currently listed for rent nearby; rentals at typical pace (median 19d on market — plan ~3-4 weeks tenant-placement turnaround); high-income renter base; 1,366 units permitted in Suffolk County in 2024 (216 in 5+ unit buildings).
- At $20,312/mo this rent would consume 188% of the median local household income ($130k/yr) (locally 896% of renters already pay >50% of income on rent) — very limited rent-growth headroom before tenants either downsize or default.
Forward outlook
- Local home prices are declining (-3.0%/yr); year-one equity from $8k of loan paydown is wiped out by about $34k of value loss. Plan a longer hold.
- Suffolk County population projected to shrink 5% by 2050 — rents likely to lag national; underwrite the cash flow, not the appreciation.
- At projected returns (-3.0% appreciation + 8.0% rent growth), your $322k cash investment doubles in ~4 years — after that, you're playing with house money.
Negotiation context
- It's been on market 81 days — a 6% lower offer ($1.08M) is reasonable based on typical stale-listing flexibility.
- Current owner paid $970k; 19% above their basis — modest negotiation headroom, anchor on the comps not their cost.
Risks & watch-outs
- Climate carrying-cost: severe wind risk, 80% chance of damaging wind over 30y — expect insurance premiums to compound above CPI over the hold.
Questions for the listing agent
- It's been on market 81 days. Have you received any prior offers? Is the seller open to a 6% concession, seller financing, or rate buy-down credit?
- Why hasn't it sold? Are there any deal-killer items the seller is aware of (foundation, flood, title, zoning, code violations)?
- Is there a deadline driving the sale (1031 exchange, divorce, estate, relocation)? That informs how much negotiation room exists.
- Schools are D-rated, which usually means shorter tenancies and higher turnover. Who's the typical renter profile here, and what's been the actual vacancy rate?
- What's the average days-on-market for RENTAL listings here right now (not sales)? A rising rental-DOM trend means longer vacancies and softer asking-rent achievability than the comps imply.
- What's the recent tenant-quality profile in this submarket — average credit score on applications, eviction rate, late-payment / NSF rate, and stable-employment percentage? A property-management company in the area should have these aggregated.
- How much new for-sale + rental construction is in the pipeline within 1–3 miles? Heavy new supply typically softens prices + rents 12–24 months out; constrained supply supports both.
Investment metrics
- 1% rule
- 1.77% ✓
- Cap rate
- 15.68%
- Cash-on-cash
- 33.53%
- DSCR
- 2.49
- GRM
- 4.7
CMA / ARV
- ARV (median comp)
- $1,318,045
- List price
- $1,150,000
- Delta
- -12.75%
- Verdict
- UNDERPRICED
- Comps
- 16 within 1.0 mi
Show comp detail 5 sales within ~0.75 mi
| Address | Dist | Beds/Ba | Sqft | Sold | Price | $/sf | Match |
|---|---|---|---|---|---|---|---|
| 51 Cedar Ridge Dr | 0.20mi | 3/1.0 | 1,300 (+4%) | 14mo | $1,100,000 | $846 | 64 |
| 158 Woodbine Dr | 0.37mi | 3/2.0 | 1,418 (+13%) | 7mo | $1,075,000 | $758 | 50 |
| 143 Gardiner Ave | 0.60mi | 3/1.5 | 1,200 (-4%) | 12mo | $1,130,000 | $942 | 49 |
| 3 Ninth St | 0.49mi | 3/2.0 | 1,083 (-13%) | 18mo | $750,000 | $693 | 36 |
| 76 Camberly Rd | 0.75mi | 4/2.0 (+1) | 1,400 (+12%) | 20mo | $1,500,000 | $1,071 | 20 |
Match score weights: distance 35% · size 25% · config 20% · recency 20%. Top-matched comps best support the ARV.
Projected returns pro-forma
-3.0% appreciation · 8.0% rent growth · sell at horizon
- IRR
- 34.1%
- Equity multiple
- 2.53×
- Total profit
- $493,844
- Equity at exit
- $171,469
- IRR
- 43.4%
- Equity multiple
- 6.14×
- Total profit
- $1,655,546
- Equity at exit
- $99,431
Cash invested: $322,000 (down + closing). Projections, not guarantees.
Landlord ↔ Tenant lean methodology
- Overall (STATE)
- 15 Strongly Tenant-Friendly
- State New York
- 15 Strongly Tenant-Friendly · D+10
- County
- — inherits STATE
- City
- — inherits STATE
ZIP-level market 11937
- Rents YoY
- 12.3%
- Active inventory
- 135
- Price-to-rent
- 4.7×
Monthly cashflow live
- Estimated rent
- $20,312 medium interval (Pro) →
- Mortgage (P&I)
- −$6,031
- Tax from tax record
- −$538 /mo · $6,459/yr
- Insurance
- −$479
- HOA
- −$0
- Vacancy / Maint / Mgmt
- −$4,265
- Net cashflow
- $8,998
Break-even live
UW: 25.0% down · 7.5% · 30yr · 1.5% tax · 5.0% vac · 8.0% maint · 8.0% mgmt
Financing live
Cash to close
- Down payment
- $287,500
- Closing costs
- $34,500
- Reserves months
- —
- Total cash needed
- —
Loan-product check · same deal, 3 products live
Conventional
25% down · 7.5% · 30yr
- Down + closing
- —
- Monthly P&I
- —
- Monthly cashflow
- —
- DSCR
- —
- Eligible?
- —
Personal DTI + credit; lowest rate.
DSCR
20% down · 8.5% · 30yr
- Down + closing
- —
- Monthly P&I
- —
- Monthly cashflow
- —
- DSCR
- —
- Eligible?
- —
No personal income docs; deal must DSCR.
Hard money
10% down · 12.0% · 12mo
- Down + closing
- —
- Monthly P&I
- —
- Monthly cashflow
- —
- DSCR
- —
- Eligible?
- —
Short-term bridge; refi at stabilization.
Rent comps 7 comps
| Address | Beds | Baths | Sqft | Rent | $/sqft | DOM | Units | Dist |
|---|---|---|---|---|---|---|---|---|
| 117 Woodbine Dr East Hampton, NY | 3.0 | 2.0 | 1496 | $65,000 | $43.45 | 43d | 1 | 0.26mi |
| 38 Woodbine Dr East Hampton, NY | 3.0 | 2.0 | 1000 | $10,000 | $10.00 | 18d | 1 | 0.33mi |
| 289 Three Mile Harbor Hog Creek Rd East Hampton, NY | 3.0 | 3.0 | 1600 | $45,600 | $28.50 | 43d | 1 | 0.54mi |
| 8 Beverly Rd East Hampton, NY | 4.0 | 2.0 | 1269 | $20,000 | $15.76 | 1d | 1 | 0.65mi |
| 66 Crystal Dr East Hampton, NY | 2.0 | 3.0 | 960 | $20,000 | $20.83 | 1d | 1 | 1.31mi |
| 319 Three Mile Harbor Rd East Hampton, NY | 2.0 | 1.0 | 1100 | $5,500 | $5.00 | 1d | 1 | 1.39mi |
| 3 Forest Ct East Hampton, NY | 3.0 | 2.0 | 1750 | $50,000 | $28.57 | 24d | 1 | 1.46mi |
Listing history 17 events
-
2026-06-18days on market $1,150,000 Active 81 DOM
-
2026-06-17days on market $1,150,000 Active 80 DOM
-
2026-06-16days on market $1,150,000 Active 79 DOM
-
2026-06-15days on market $1,150,000 Active 78 DOM
-
2026-06-13days on market $1,150,000 Active 76 DOM
-
2026-06-13days on market $1,150,000 Active 75 DOM
-
2026-06-09days on market $1,150,000 Active 72 DOM
-
2026-06-08days on market $1,150,000 Active 71 DOM
-
2026-06-07days on market $1,150,000 Active 70 DOM
-
2026-06-04days on market $1,150,000 Active 67 DOM
-
2026-06-03days on market $1,150,000 Active 66 DOM
-
2026-06-02days on market $1,150,000 Active 65 DOM
-
2026-06-01days on market $1,150,000 Active 64 DOM
-
2026-05-31days on market $1,150,000 Active 63 DOM
-
2026-03-29$1,150,000 Active 285-char remark
Show marketing remark (285 chars)
Ready to make this charming Springs cottage yours! 3 bedrooms, 3 bathrooms, 1,250 sqft of cozy renovation potential. Features include: New roof, wood-burning fireplace, wrap-around deck. Plans by world renowned interior designer also included. 0.67 acres on a serene tree-lined street.
-
2022-07-20soldstatus $970,000
-
1994-06-07soldstatus $110,000
ⓘ Source: listings_history table (triggers on properties + properties_extension) + one-shot
backfill from property_details.listing_events for pre-trigger history.
Tax reassessment forecast NY · Partial reset (capped growth)
- Current annual tax
- $6,459 · $538/mo
- Projected year-2 tax
- $12,947 · $1,079/mo
- Expected delta
- +$6,488/yr (+$541/mo · 100.5%)
ⓘ Screening estimate from a state-policy table — verify with the county assessor before closing.
Climate risk First Street
- Flood 1/10 Low FEMA zone X (unshaded) · 0% chance over 30 yrs
- Wildfire 1/10 Low
- Heat 4/10 Moderate 7 d/yr ≥89°F today · 19 d/yr by 30 yrs out
- Wind 8/10 Severe 80% chance of damaging wind over 30 yrs
- Air quality 3/10 Moderate 2 unhealthy d/yr today · 3 by 30 yrs out
Nearby sold comps map
Loading sold comps map…
Walkable amenities ~0.75 mi
Loading nearby amenities…
Taxation est. · year 1
- Rental income
- $243,741
- − Mortgage interest
- −$64,418
- − Property taxes
- −$6,459
- − Insurance
- −$5,750
- − Repairs & maintenance
- −$19,499
- − Management
- −$19,499
- − Depreciation
- −$33,455
- Taxable income
- $94,661
- Est. tax owed @ 24.0%
- −$22,719
- After-tax cash flow
- $85,259/yr
For passive investors: Depreciation is non-cash, so a rental often shows a tax loss while cash-flowing — sheltering income. Rental losses are passive: they offset passive income freely, and up to $25,000/yr can offset ordinary (W-2) income if you actively participate and your MAGI is under $100k (phasing out to $0 by $150k); unused losses carry forward. On sale, claimed depreciation is recaptured at up to 25%, and gains may owe capital-gains tax (a 1031 exchange can defer both). Figures are a year-1 estimate at your 24.0% rate — not tax advice; consult a CPA.
Schools (NCES district)
- District
- Springs Union Free School District
- NCES district ID
- 3627900
- Math proficiency
- 55% ▲ 6.00%
- Reading proficiency
- 60% ▲ 10.00%
- Median HH income
- $75,413
- Composite
- 51.42/100
- National rank
- #1728
- State rank
- #239 of 590 in NY
Livability — Springs
- Score
- 63/100
- State rank
- #809
- US rank
- #15666
Category grades
Schools grade is shown separately in the Schools card above.
Census & demographics
- Census place
- Springs, NY
- County
- Suffolk County · 679,920 people
- Metro
- New York-Newark-Jersey City, NY-NJ-PA
- Population (ZIP)
- 21,882
- Household income
- $129,883
- Rent vs Own
- Severe rent burden
- 896.0
Population outlook (Suffolk County) Hauer SSP2
- Today (2025)
- 1,505,262 people
- By 2030
- 1,498,318 · -0.5%
- By 2040
- 1,471,101 · -2.3%
- By 2050
- 1,424,848 · -5.3%
- By 2075
- 1,337,157 · -11.2%
- By 2100
- 1,217,720 · -19.1%
Race, ethnicity, and origin ACS 2023
- Neighborhood character
- Majority White (61%)
- Race & ethnicity
- White 61% Hispanic / Latino 32% Two or more races 23% Black 2% Asian 2%
- Hispanic origin (detail)
- Mexican 2% Puerto Rican 1%
- Common ancestry
- Romanian 5% Scotch-Irish 4% Italian 2%
- Foreign-born
- 25% · Canada, Guatemala, Jamaica
- Languages at home
- 68% English-only · Spanish 28% Other Indo-European 1% Russian/Polish/Slavic 1%
Political lean MEDSL · Suffolk
- 2024 margin
- Lean R (+10.0) · D 45.0% · R 55.0%
- 2008→2024 swing
- -16.0pp toward R · 2008: 6.0pp · 2024: -10.0pp
- All cycles
- 2024: R+10.0 2020: R+0.0 2016: R+8.2 2012: D+2.9 2008: D+6.0
Not yet ingested
- Civics
- —
Market trends
- HPI YoY
- ▼ -285.21%
- Current HPI
- 444.1499
- Rent YoY
- ▲ 12.28%
- Metro
- New York-Newark-Jersey City, NY-NJ-PA
- State GDP YoY
- ▲ 2.60%
- F500 in state
- 92
Industry mix (Fortune 500 HQ in NY)
| Industry | F500 HQs | Revenue |
|---|---|---|
| Financial Services | 10 | $950B |
|
||
| Consumer Goods | 9 | $162B |
|
||
| Insurance | 4 | $225B |
|
||
| Telecommunications | 2 | $144B |
|
||
| Pharmaceuticals | 2 | $112B |
|
||
| Media / Entertainment | 2 | $69B |
|
||
Price history
+945.5% since first listed3 events — show timeline
- 2026-03-29 Listed $1,150,000 OneKey® MLS as Distributed by MLS Grid
- 2022-07-20 Sold (Public Records) $970,000 Public Records
- 1994-06-07 Sold (Public Records) $110,000 Public Records
Property tax history
+3.5%/yrLatest (2025): $6,459 · +0.0% YoY. Source: county tax records.
Cash-flow waterfall
monthlySold comps — $/sqft
last 12 mo · ≤1 miLoading sold comps…