 Duplex
1423 E Elm St · Tyler, TX
Flood risk 1/10 · Minimal
- FEMA flood zone
- X (unshaded)
- Chance of flooding over 30 yrs
- 0.0%
- Est. flood insurance / yr
- $507 – $1,088
Fire risk 4/10 · Minor
- Est. fire insurance / yr
- $1,222 – $2,270
Heat risk 6/10 · Moderate
- Hot days now (above 109°F)
- 7 days/yr
- Hot days in 30 yrs
- 26 days/yr
Wind risk 6/10 · Moderate
- Chance of severe wind over 30 yrs
- 60.0%
Air-quality risk 2/10 · Minimal
- Unhealthy air days now
- 0 days/yr
- Unhealthy air days in 30 yrs
- 1 days/yr
Risk factors via First Street. Map © Google.
Why this score? — see what drove the F grade
The composite is a weighted blend of 9 inputs, each scored 0–100. Each bar is that input's sub-score; the figure is the points it added to the 100-point composite (weight × sub-score).
- Cash flow +12.4/30.0
- Livability +3.8/5.0
- DSCR +3.7/10.0
- Schools +3.3/10.0
- 1% rule +3.2/10.0
- Rent growth +3.1/5.0
- Condition / age +2.5/5.0
- ARV discount +0.3/15.0
- Appreciation +0.0/10.0
$275,000
🖨 Deal sheet (PDF) 📄 Offer letter ✓ Due diligence
Multi-family units
County records classify this as Multi-Family (2-4 Unit). Listing-text estimate: 2 units. confirmed
Listing remarks MLS
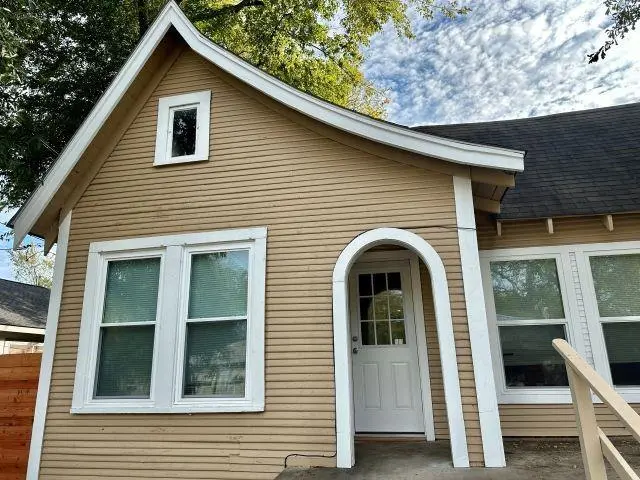
Recently remodeled and full of opportunity, this 2-bedroom, 1-bath duplex is an ideal option for both investors and first-time buyers. Each unit offers comfortable living with updated finishes. Live in one side and rent the other to help offset your mortgage, or add this low-maintenance property to your investment portfolio. Located just minutes from downtown, this duplex provides convenient access to shopping, dining, and local amenities. Major hospitals are nearby, and Tyler Junior College is only a few blocks away, making this an attractive rental option for students and healthcare professionals alike. With a desirable central location and recent updates already completed, this property offers flexibility, income potential, and long-term value. A smart buy for anyone looking to combine lifestyle and investment in one property. The duplex features one side currently leased on a month-to-month basis, while the second unit is vacant, offering immediate opportunity for owner-occupancy or additional rental income.
Key facts
- Recently remodeled
- Updated finishes
- Income potential
Tags
Neighborhood map
What this means for you Summary
Snapshot
- This is a 2 × 2-bed/1.0-bath units multifamily listed at $275k.
Deal economics
- At list price, monthly cash flow is $-45 ($-542/yr) — negative. Per door: $-23/mo.
- To cash-flow at today's rent, offer at most $267k (2.9% below list).
- To meet the 1% rule (rent ≥ 1% of price), the offer needs to be $226k (17.6% below list).
- Recommended offer: $226k (17.6% below list) — sets the bar for 1% rule.
- Cap rate 6.1% vs local median 3.5% in Tyler — top-decile yield for the area; either an underpriced asset or a hidden risk that comps aren't pricing in. Stress-test before assuming the spread holds.
Location & tenants
- Location reads 75/100 on livability (#147 in TX, #4,181 nationally) — a middle-class / working-renter tenant base. Strengths: cost of living A+, housing A+, health & safety A+; Watch: employment C-, crime D+, commute F.
- Tyler ISD (urban): math 39% / reading 38% proficiency, ranked #449 of 826 in TX (top 54%) — families likely to look elsewhere, expect single-tenant / working-renter base with shorter leases; 66% free/reduced lunch — lower-income household profile, screen leases tightly.
- Zoned schools: Bonner El (math 36% / reading 26%, grade F, #2,429 of 4,322 statewide, top 57%, 415 students, 93% FRL); Moore Mst Magnet School (math 46% / reading 39%, grade D-, #553 of 1,662 statewide, top 34%, 1,113 students, 87% FRL); Tyler H S (math 26% / reading 27%, grade F, #1,228 of 1,632 statewide, top 76%, 2,164 students, 90% FRL) — zoned schools average 90% FRL vs 66% district-wide (24 pts higher); higher-poverty schools than district average — tighter screening recommended.
- Market conditions: Rents rising (+2.3%/yr); 156 active listings in the ZIP; 15 comparable units currently listed for rent nearby; rentals lingering (median 46d on market — plan ~5-8 weeks vacancy on turnover, expect pricing pressure); 60% of comp listings sitting > 30 days — soft ceiling on asking rent; 595 units permitted in Smith County in 2024 (45 in 5+ unit buildings).
- At $2,265/mo this rent would consume 53% of the median local household income ($52k/yr) (locally 803% of renters already pay >50% of income on rent) — very limited rent-growth headroom before tenants either downsize or default.
Forward outlook
- Local home prices are declining (-3.0%/yr); year-one equity from $2k of loan paydown is wiped out by about $8k of value loss. Plan a longer hold.
- Smith County population projected at +24% by 2050 — long-run rental-demand tailwind backs the buy-and-hold thesis.
Negotiation context
- It's been on market 152 days — a 12% lower offer ($242k) is reasonable based on typical stale-listing flexibility.
- 6 sale attempts since 4y ago with the ask held roughly flat each time — persistent listings suggest the price (not the market) is what's stuck; bring a comps-based counter.
Risks & watch-outs
- Watch-outs: built in 1930 — expect roof / HVAC / electrical / plumbing capex.
- Climate carrying-cost: major wind risk, 60% chance of damaging wind over 30y; extreme-heat days projected 7→26/yr by 2055 (HVAC capex compounding) — expect insurance premiums to compound above CPI over the hold.
Questions for the listing agent
- What do current leases actually rent for vs. the listed asking? Can we see a recent rent roll and the last 12 months of T-12 income?
- It's been on market 152 days. Have you received any prior offers? Is the seller open to a 18% concession, seller financing, or rate buy-down credit?
- Can we see the unit-by-unit rent roll, current vacancy, and any below-market leases? What's the average tenancy length?
- What capital expenditures (roof, boiler, parking lot, exteriors) have been made in the last 5 years, and what's planned in the next 2?
- Built in 1930 — when were the roof, HVAC, electrical panel, plumbing, and water heater last replaced?
- Why hasn't it sold? Are there any deal-killer items the seller is aware of (foundation, flood, title, zoning, code violations)?
- Is there a deadline driving the sale (1031 exchange, divorce, estate, relocation)? That informs how much negotiation room exists.
- Schools are D-rated, which usually means shorter tenancies and higher turnover. Who's the typical renter profile here, and what's been the actual vacancy rate?
- Crime grade is D in this area — have there been break-ins, vandalism, or insurance claims at this property in the last 3 years? What carrier currently insures it and at what premium?
- The area grade is low — what's the realistic commute time and amenity access for the typical tenant pool here? Any planned neighborhood developments (good or bad) we should know about?
- What's the average days-on-market for RENTAL listings here right now (not sales)? A rising rental-DOM trend means longer vacancies and softer asking-rent achievability than the comps imply.
- What's the recent tenant-quality profile in this submarket — average credit score on applications, eviction rate, late-payment / NSF rate, and stable-employment percentage? A property-management company in the area should have these aggregated.
- How much new apartment / multifamily construction is in the pipeline within 1–3 miles? Heavy new supply (>2% of stock underway) typically softens rents 12–24 months out; light construction supports rent growth.
Investment metrics
- 1% rule
- 0.82% ✗
- Cap rate
- 6.10%
- Cash-on-cash
- -0.70%
- DSCR
- 0.97
- GRM
- 10.1
CMA / ARV
- ARV (median comp)
- $237,103
- List price
- $275,000
- Delta
- 15.98%
- Verdict
- OVERPRICED
- Comps
- 2 within 2.0 mi
Projected returns pro-forma
-3.0% appreciation · 2.27% rent growth · sell at horizon
- IRR
- -18.3%
- Equity multiple
- 0.36×
- Total profit
- $-49,095
- Equity at exit
- $41,003
- IRR
- -12.0%
- Equity multiple
- 0.31×
- Total profit
- $-53,159
- Equity at exit
- $23,777
Cash invested: $77,000 (down + closing). Projections, not guarantees.
Landlord ↔ Tenant lean methodology
- Overall (STATE)
- 87 Strongly Landlord-Friendly
- State Texas
- 87 Strongly Landlord-Friendly · R+5
- County
- — inherits STATE
- City
- — inherits STATE
ZIP-level market 75702
- Home prices YoY
- -5.8%
- Rents YoY
- 2.3%
- Active inventory
- 156
- Price-to-rent
- 20.2×
Monthly cashflow live
- Estimated rent
- $2,265 high interval (Pro) →
- Mortgage (P&I)
- −$1,442
- Tax from tax record
- −$278 /mo · $3,333/yr
- Insurance
- −$115
- HOA
- −$0
- Lot rent
- −$0
- Vacancy / Maint / Mgmt
- −$476
- Net cashflow
- $-45
Break-even live
Sensitivity live
| Price | -10% $111 | -5% $33 | +0% $-45 | +5% $-123 | +10% $-201 |
|---|---|---|---|---|---|
| Rent | -10% $-224 | -5% $-135 | +0% $-45 | +5% $44 | +10% $134 |
| Rate | -1.0pp $93 | -0.5pp $25 | base $-45 | +0.5pp $-116 | +1.0pp $-189 |
2-unit breakdown (identical units grouped — click to expand)
| Units | Beds | Baths | Est. rent |
|---|---|---|---|
| 2× units | 2 | 1 | $2,266 |
| #1 | 2 | 1 | $1,133 |
| #2 | 2 | 1 | $1,133 |
| Total (2 units) | $2,265 | ||
UW: 25.0% down · 7.5% · 30yr · 1.5% tax · 5.0% vac · 8.0% maint · 8.0% mgmt
Financing live
Cash to close
- Down payment
- $68,750
- Closing costs
- $8,250
- Reserves months
- —
- Total cash needed
- —
Loan-product check · same deal, 3 products live
Conventional
25% down · 7.5% · 30yr
- Down + closing
- —
- Monthly P&I
- —
- Monthly cashflow
- —
- DSCR
- —
- Eligible?
- —
Personal DTI + credit; lowest rate.
DSCR
20% down · 8.5% · 30yr
- Down + closing
- —
- Monthly P&I
- —
- Monthly cashflow
- —
- DSCR
- —
- Eligible?
- —
No personal income docs; deal must DSCR.
Hard money
10% down · 12.0% · 12mo
- Down + closing
- —
- Monthly P&I
- —
- Monthly cashflow
- —
- DSCR
- —
- Eligible?
- —
Short-term bridge; refi at stabilization.
Rent comps 15 comps
| Address | Beds | Baths | Sqft | Rent | $/sqft | DOM | Units | Dist |
|---|---|---|---|---|---|---|---|---|
| 211 Patricia Ct Tyler, TX | 3.0 | 2.0 | 1314 | $1,795 | $1.37 | 46d | 1 | 0.22mi |
| 411 N Fuller Ave Tyler, TX | 3.0 | 2.0 | 1246 | $1,850 | $1.48 | 46d | 1 | 0.27mi |
| 324 S Saunders Ave Tyler, TX | 3.0 | 2.0 | 1650 | $2,100 | $1.27 | 46d | 1 | 0.43mi |
| 811 S Mahon Ave Tyler, TX | 3.0 | 2.0 | 1761 | $1,900 | $1.08 | 46d | 1 | 0.70mi |
| 425 E Oakwood St Tyler, TX | 3.0 | 2.0 | 1298 | $1,540 | $1.19 | 46d | 1 | 0.84mi |
| 1118 S Fleishel Ave Tyler, TX | 3.0 | 2.0 | 1425 | $1,495 | $1.05 | 15d | 1 | 1.01mi |
| 1712 Redbud Ave Tyler, TX | 3.0 | 1.5 | 1561 | $1,475 | $0.94 | 15d | 1 | 1.33mi |
| 1712 Redbud Ave Tyler, TX | 3.0 | 1.5 | 1305 | $1,475 | $1.13 | 23d | 1 | 1.33mi |
| 2401 Airline Dr Tyler, TX | 3.0 | 2.5 | 1512 | $1,325 | $0.88 | 46d | 1 | 1.35mi |
| 540 W Erwin St Tyler, TX | 3.0 | 3.5 | 1956 | $4,000 | $2.04 | 46d | 1 | 1.36mi |
| 548 W Erwin St Tyler, TX | 3.0 | 3.5 | 1956 | $2,295 | $1.17 | 23d | 1 | 1.37mi |
| 548 W Erwin St Tyler, TX | 3.0 | 3.5 | 1956 | $2,495 | $1.28 | 46d | 1 | 1.37mi |
| 556 W Erwin St Tyler, TX | 3.0 | 3.5 | 1956 | $2,550 | $1.30 | 23d | 1 | 1.39mi |
| 1403 S Donnybrook Ave Tyler, TX | 3.0 | 3.0 | 1834 | $2,150 | $1.17 | 46d | 1 | 1.41mi |
| 1225 San Antonio St Tyler, TX | 3.0 | 2.0 | 1754 | $1,695 | $0.97 | 15d | 1 | 1.48mi |
Listing history 27 events
-
2026-06-22days on market $275,000 Active 152 DOM
-
2026-06-19days on market $275,000 Active 150 DOM
-
2026-06-18days on market $275,000 Active 149 DOM
-
2026-06-17days on market $275,000 Active 148 DOM
-
2026-06-16days on market $275,000 Active 147 DOM
-
2026-06-15days on market $275,000 Active 146 DOM
-
2026-06-14days on market $275,000 Active 144 DOM
-
2026-06-13days on market $275,000 Active 143 DOM
-
2026-06-10days on market $275,000 Active 141 DOM
-
2026-06-09days on market $275,000 Active 140 DOM
-
2026-06-08days on market $275,000 Active 139 DOM
-
2026-06-07days on market $275,000 Active 138 DOM
-
2026-06-05days on market $275,000 Active 135 DOM
-
2026-06-02days on market $275,000 Active 133 DOM
-
2026-06-01days on market $275,000 Active 132 DOM
-
2026-05-31days on market $275,000 Active 131 DOM
-
2026-05-30days on market $275,000 Active 130 DOM
-
2026-01-20$275,000 Active 1027-char remark
Show marketing remark (1033 chars)
Recently remodeled and full of opportunity, this 2-bedroom, 1-bath duplex is an ideal option for both investors and first-time buyers. Each unit offers comfortable living with updated finishes. Live in one side and rent the other to help offset your mortgage, or add this low-maintenance property to your investment portfolio. Located just minutes from downtown, this duplex provides convenient access to shopping, dining, and local amenities. Major hospitals are nearby, and Tyler Junior College is only a few blocks away, making this an attractive rental option for students and healthcare professionals alike. With a desirable central location and recent updates already completed, this property offers flexibility, income potential, and long-term value. A smart buy for anyone looking to combine lifestyle and investment in one property. The duplex features one side currently leased on a month-to-month basis, while the second unit is vacant, offering immediate opportunity for owner-occupancy or additional rental income.
-
2026-01-20$275,000 Active 1033-char remark
Show marketing remark (1033 chars)
Recently remodeled and full of opportunity, this 2-bedroom, 1-bath duplex is an ideal option for both investors and first-time buyers. Each unit offers comfortable living with updated finishes. Live in one side and rent the other to help offset your mortgage, or add this low-maintenance property to your investment portfolio. Located just minutes from downtown, this duplex provides convenient access to shopping, dining, and local amenities. Major hospitals are nearby, and Tyler Junior College is only a few blocks away, making this an attractive rental option for students and healthcare professionals alike. With a desirable central location and recent updates already completed, this property offers flexibility, income potential, and long-term value. A smart buy for anyone looking to combine lifestyle and investment in one property. The duplex features one side currently leased on a month-to-month basis, while the second unit is vacant, offering immediate opportunity for owner-occupancy or additional rental income.
-
2026-01-08$275,000 Active
-
2022-12-30status Active
-
2022-07-08historical
-
2022-07-08soldstatus
-
2022-07-01soldstatus Closed
-
2022-07-01soldstatus
-
2022-05-20$181,500
-
2022-05-13$181,500 Active
ⓘ Source: listings_history table (triggers on properties + properties_extension) + one-shot
backfill from property_details.listing_events for pre-trigger history.
Tax reassessment forecast TX · Resets to sale price
- Current annual tax
- $3,333 · $278/mo
- Projected year-2 tax
- $5,032 · $419/mo
- Expected delta
- +$1,699/yr (+$142/mo · 51.0%)
ⓘ Screening estimate from a state-policy table — verify with the county assessor before closing.
Climate risk First Street
- Flood 1/10 Low FEMA zone X (unshaded) · 0% chance over 30 yrs
- Wildfire 4/10 Moderate
- Heat 6/10 Major 7 d/yr ≥109°F today · 26 d/yr by 30 yrs out
- Wind 6/10 Major 60% chance of damaging wind over 30 yrs
- Air quality 2/10 Low 0 unhealthy d/yr today · 1 by 30 yrs out
Nearby sold comps map
Loading sold comps map…
Walkable amenities ~0.75 mi
Loading nearby amenities…
Taxation est. · year 1
- Rental income
- $27,180
- − Mortgage interest
- −$15,404
- − Property taxes
- −$3,333
- − Insurance
- −$1,375
- − Repairs & maintenance
- −$2,174
- − Management
- −$2,174
- − Depreciation
- −$8,000
- Taxable loss
- −$5,282
- Est. tax savings @ 24.0%
- +$1,268
- After-tax cash flow
- $726/yr
For passive investors: Depreciation is non-cash, so a rental often shows a tax loss while cash-flowing — sheltering income. Rental losses are passive: they offset passive income freely, and up to $25,000/yr can offset ordinary (W-2) income if you actively participate and your MAGI is under $100k (phasing out to $0 by $150k); unused losses carry forward. On sale, claimed depreciation is recaptured at up to 25%, and gains may owe capital-gains tax (a 1031 exchange can defer both). Figures are a year-1 estimate at your 24.0% rate — not tax advice; consult a CPA.
Schools (NCES district)
- District
- Tyler ISD
- NCES district ID
- 4843470
- Math proficiency
- 39% ▼ -4.00%
- Reading proficiency
- 38% ▼ -1.00%
- Median HH income
- $44,090
- Composite
- 32.69/100
- National rank
- #5650
- State rank
- #449 of 826 in TX
Livability — Tyler
- Score
- 75/100
- State rank
- #147
- US rank
- #4181
Category grades
Schools grade is shown separately in the Schools card above.
Census & demographics
- Census place
- Tyler, TX
- County
- Smith County · 180,570 people
- City population
- 127,842
- Metro
- Tyler, TX
- Population (ZIP)
- 27,927
- Household income
- $51,564
- Rent vs Own
- Severe rent burden
- 803.0
Population outlook (Smith County) Hauer SSP2
- Today (2025)
- 248,890 people
- By 2030
- 261,665 · +5.1%
- By 2040
- 286,114 · +15.0%
- By 2050
- 308,006 · +23.8%
- By 2075
- 354,171 · +42.3%
- By 2100
- 372,828 · +49.8%
Race, ethnicity, and origin ACS 2023
- Neighborhood character
- Diverse neighborhood (Simpson 0.61)
- Race & ethnicity
- Hispanic / Latino 49% Black 37% White 12% Two or more races 11% Native American 1%
- Hispanic origin (detail)
- Mexican 47%
- Common ancestry
- Lithuanian 1%
- Foreign-born
- 20% · Canada
- Languages at home
- 56% English-only · Spanish 44%
Political lean MEDSL · Smith
- 2024 margin
- Solid R (+45.1) · D 27.0% · R 72.1%
- 2008→2024 swing
- -5.6pp toward R · 2008: -39.5pp · 2024: -45.1pp
- All cycles
- 2024: R+45.1 2020: R+39.4 2016: R+43.9 2012: R+46.9 2008: R+39.5
Not yet ingested
- Civics
- —
Market trends
- HPI YoY
- ▼ -12.63%
- Current HPI
- 207.1573
- Rent YoY
- ▲ 2.27%
- Metro
- Tyler, TX
- State GDP YoY
- ▲ 3.95%
- F500 in state
- 110
Industry mix (Fortune 500 HQ in TX)
| Industry | F500 HQs | Revenue |
|---|---|---|
| Energy | 16 | $1,198B |
|
||
| Technology | 5 | $198B |
|
||
| Engineering / Construction | 4 | $72B |
|
||
| Energy Services | 3 | $60B |
|
||
| Utilities | 3 | $41B |
|
||
| Healthcare | 2 | $330B |
|
||
Price history
+51.5% since first listed10 events — show timeline
- 2026-01-20 Listed $275,000 LAAR
- 2026-01-20 Listed $275,000 NTREIS
- 2026-01-08 Listed $275,000 GTAR
- 2022-12-30 Relisted — NTREIS
- 2022-07-08 Sold (MLS) — GTAR
- 2022-07-08 Listing Removed — NTREIS
- 2022-07-01 Sold (Public Records) — Public Records
- 2022-07-01 Sold (MLS) — NTREIS
- 2022-05-20 Listed $181,500 GTAR
- 2022-05-13 Listed $181,500 NTREIS
Property tax history
+12.2%/yrLatest (2024): $3,333 · +17.1% YoY. Source: county tax records.
Cash-flow waterfall
monthlySold comps — $/sqft
last 12 mo · ≤1 miLoading sold comps…