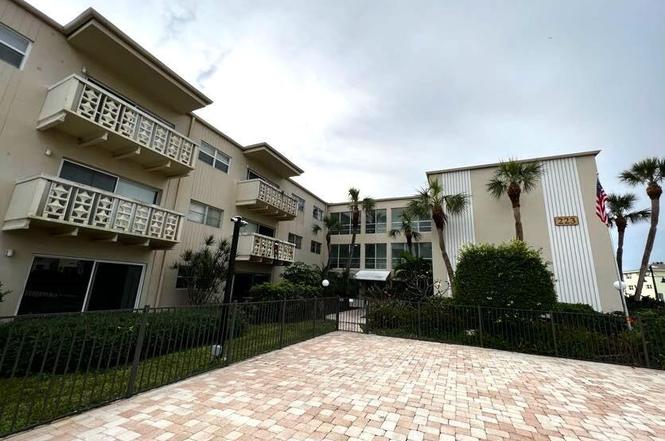
223 Columbia Dr #317 · Cape Canaveral, FL
Flood risk No data
- FEMA flood zone
- —
- Chance of flooding over 30 yrs
- —
- Est. flood insurance / yr
- —
Fire risk No data
- Est. fire insurance / yr
- —
Heat risk No data
- Hot days now (above threshold)
- —
- Hot days in 30 yrs
- —
Wind risk No data
- Chance of severe wind over 30 yrs
- —
Air-quality risk No data
- Unhealthy air days now
- —
- Unhealthy air days in 30 yrs
- —
Risk factors via First Street. Map © Google.
Why this score? — see what drove the C grade
The composite is a weighted blend of 9 inputs, each scored 0–100. Each bar is that input's sub-score; the figure is the points it added to the 100-point composite (weight × sub-score).
- Cash flow +19.0/30.0
- 1% rule +10.0/10.0
- ARV discount +7.5/15.0
- DSCR +6.0/10.0
- Schools +4.7/10.0
- Livability +4.2/5.0
- Rent growth +3.5/5.0
- Condition / age +2.5/5.0
- Appreciation +0.0/10.0
$75,000
🖨 Deal sheet 📄 Offer letter ✓ Due diligence
Listing remarks
Desirable 1 bedroom & 1 bathroom condo in a secure building located at The Plaza condo. Tile flooring throughout, open floor plan, window treatment, walk-in closet, ceiling fans, and sliding glass door to balcony. The complex offers a fenced in-ground community pool, open parking, elevators, on-site laundry room on each floor, and secured building entrance. XLNT location near all thoroughfares with easy access to Port Canaveral, Kennedy Space Center, amenities & services, shopping centers, restaurants, downtown Cocoa Beach, 520, 528, entertainments, Patrick AFB, and just an hour to Orlando/ attractions.
Key facts
- On-site laundry room
- $566 HOA
- Community pool
Tags
Property features AI
Finance
- Financial info: Association fee: $566 monthly
- HOA & community: Has association: The Plaza Condo; Association amenities include elevator(s) and laundry; Monthly association fee
Exterior
- Parking: Guest parking in a parking lot
- Security: Secured lobby; Smoke detectors
- Utilities: Public sewer; Cable available; Electricity available; Sewer available; Water available
- Home design: Condominium; Three or more levels; 3 total stories; Faces north; Entry on level 3; Residential use
- Construction: Concrete and stucco construction
- Exterior features: Balcony; Paved road access; Lot features: Other
Interior
- Kitchen: Dishwasher; Electric range; Refrigerator; Electric water heater
- Bedrooms: 1 bedroom (Entry level: 3)
- Flooring: Tile
- Bathrooms: 1 full bathroom
- Heating & cooling: Central heating (electric); Central air conditioning (electric)
- Interior features: Ceiling fans; Open floor plan; Primary bathroom with tub and shower; Walk-in closet
- Laundry & utility: Building offers laundry (association amenity)
Neighborhood map
What this means for you Summary
Snapshot
- This is a 1-bed/1.0-bath condo listed at $75k.
Deal economics
- At list price, monthly cash flow is $78 ($941/yr) — positive.
- The deal already cash-flows at list — no discount required.
- Meets the 1% rule at list price ($1k rent vs $75k).
- Recommended offer: $66k (12.0% below list) — sets the bar for market timing.
Location & tenants
- Location reads 84/100 on livability (#34 in FL, #677 nationally) — a professional / high-income tenant draw. Strengths: crime A+, commute A+, housing A+; Watch: amenities F.
- Brevard (suburban): math 53% / reading 57% proficiency, ranked #19 of 73 in FL (top 26%) — acceptable for families but not a draw, mixed tenant base, ~2y average lease.
- Zoned schools: Cape View Elementary School (math 62% / reading 62%, grade B, #608 of 2,144 statewide, top 29%, 305 students, 61% FRL); Cocoa Beach Junior/Senior High School (math 65% / reading 66%, grade B, #75 of 667 statewide, top 11%, 982 students, 30% FRL) — zoned schools at 45% FRL track the district average.
- Market conditions: Rents rising fast (+4.0%/yr); 219 active listings in the ZIP; 30 comparable units currently listed for rent nearby; rentals at typical pace (median 21d on market — plan ~3-4 weeks tenant-placement turnaround); 4,602 units permitted in Brevard County in 2024 (702 in 5+ unit buildings).
Forward outlook
- Local home prices are declining (-3.0%/yr); year-one equity from $519 of loan paydown is wiped out by about $2k of value loss. Plan a longer hold.
- Brevard County population projected at +15% by 2050 — modest demand growth; plan on rents tracking national, not racing it.
Negotiation context
- It's been on market 144 days — a 12% lower offer ($66k) is reasonable based on typical stale-listing flexibility.
- Current owner paid $26k; list at $75k implies a 183% gain — meaningful room to come down on a strong offer.
Risks & watch-outs
- Watch-outs: HOA is 38% of rent.
Questions for the listing agent
- It's been on market 144 days. Have you received any prior offers? Is the seller open to a 12% concession, seller financing, or rate buy-down credit?
- Built in 1966 — when were the roof, HVAC, electrical panel, plumbing, and water heater last replaced?
- What does the HOA fee cover, when was the last increase, and are there any pending special assessments or reserve-fund shortfalls?
- Any open or pending special assessments — roof, HVAC, plumbing, elevator, façade? What's the per-unit balance and payoff schedule, and is the seller paying it off at close or rolling it to the buyer?
- Why hasn't it sold? Are there any deal-killer items the seller is aware of (foundation, flood, title, zoning, code violations)?
- Is there a deadline driving the sale (1031 exchange, divorce, estate, relocation)? That informs how much negotiation room exists.
- Schools are B-rated — typically a magnet for longer-tenancy family renters. What's the average tenant stay here, and is there a school-zone premium baked into asking?
- What's the average days-on-market for RENTAL listings here right now (not sales)? A rising rental-DOM trend means longer vacancies and softer asking-rent achievability than the comps imply.
- What's the recent tenant-quality profile in this submarket — average credit score on applications, eviction rate, late-payment / NSF rate, and stable-employment percentage? A property-management company in the area should have these aggregated.
- How much new apartment / multifamily construction is in the pipeline within 1–3 miles? Heavy new supply (>2% of stock underway) typically softens rents 12–24 months out; light construction supports rent growth.
Investment metrics
- 1% rule
- 1.97% ✓
- Cap rate
- 7.55%
- Cash-on-cash
- 4.48%
- DSCR
- 1.20
- GRM
- 4.2
CMA / ARV
No comps found within radius.
Projected returns pro-forma
-3.0% appreciation · 4.02% rent growth · sell at horizon
- IRR
- -6.6%
- Equity multiple
- 0.75×
- Total profit
- $-5,254
- Equity at exit
- $11,183
- IRR
- 5.7%
- Equity multiple
- 1.47×
- Total profit
- $9,793
- Equity at exit
- $6,485
Cash invested: $21,000 (down + closing). Projections, not guarantees.
Landlord ↔ Tenant lean methodology
- Overall (STATE)
- 87 Strongly Landlord-Friendly
- State Florida
- 87 Strongly Landlord-Friendly · R+3
- County
- — inherits STATE
- City
- — inherits STATE
ZIP-level market 32920
- Home prices YoY
- -29.5%
- Rents YoY
- 4.0%
- Active inventory
- 219
- Price-to-rent
- 4.2×
Monthly cashflow live
- Estimated rent
- $1,478 high interval (Pro) →
- Mortgage (P&I)
- −$393
- Tax from tax record
- −$99 /mo · $1,188/yr
- Insurance
- −$31
- HOA
- −$566
- Vacancy / Maint / Mgmt
- −$310
- Net cashflow
- $78
Break-even live
UW: 25.0% down · 7.5% · 30yr · 1.5% tax · 5.0% vac · 8.0% maint · 8.0% mgmt
Financing live
Cash to close
- Down payment
- $18,750
- Closing costs
- $2,250
- Reserves months
- —
- Total cash needed
- —
Loan-product check · same deal, 3 products live
Conventional
25% down · 7.5% · 30yr
- Down + closing
- —
- Monthly P&I
- —
- Monthly cashflow
- —
- DSCR
- —
- Eligible?
- —
Personal DTI + credit; lowest rate.
DSCR
20% down · 8.5% · 30yr
- Down + closing
- —
- Monthly P&I
- —
- Monthly cashflow
- —
- DSCR
- —
- Eligible?
- —
No personal income docs; deal must DSCR.
Hard money
10% down · 12.0% · 12mo
- Down + closing
- —
- Monthly P&I
- —
- Monthly cashflow
- —
- DSCR
- —
- Eligible?
- —
Short-term bridge; refi at stabilization.
Rent comps 30 comps
| Address | Beds | Baths | Sqft | Rent | $/sqft | DOM | Units | Dist |
|---|---|---|---|---|---|---|---|---|
| 223 Columbia Dr #319 Cape Canaveral, FL | 1.0 | 1.0 | 680 | $1,400 | $2.06 | 23d | 1 | 0.03mi |
| 8401 N Atlantic Ave Cape Canaveral, FL | 1.0–2.0 | 1.0 | 707 | $1,200 | $1.70 | 14d | 5 | 0.28mi |
| 8401 N Atlantic Ave Cape Canaveral, FL | 1.0–2.0 | 1.0 | 707 | $1,250 | $1.77 | 21d | 5 | 0.28mi |
| 128 Adams Ave Unit 1 Cape Canaveral, FL | 2.0 | 1.0 | 663 | $1,500 | $2.26 | 14d | 1 | 0.41mi |
| 8522 N Atlantic Ave #71 Cape Canaveral, FL | 1.0 | 1.0 | 673 | $1,550 | $2.30 | 23d | 1 | 0.48mi |
| 201 Chandler St Cape Canaveral, FL | 1.0–2.0 | 1.0–2.0 | 700 | $1,150 | $1.64 | 18d | 1 | 0.51mi |
| 211 Caroline St Cape Canaveral, FL | 2.0 | 1.0 | 705 | $1,345 | $1.91 | 23d | 1 | 0.55mi |
| 300 Monroe Ave #21 Cape Canaveral, FL | 1.0 | 1.0 | 608 | $1,500 | $2.47 | 14d | 1 | 0.56mi |
| 211 Circle Dr Cape Canaveral, FL | 1.0 | 1.0 | 409 | $1,450 | $3.55 | 18d | 1 | 0.58mi |
| 227 Canaveral Beach Blvd Unit 5 Cape Canaveral, FL | 1.0 | 1.0 | 700 | $1,600 | $2.29 | 21d | 1 | 0.59mi |
| 227 Canaveral Beach Blvd Cape Canaveral, FL | 1.0 | 1.0 | 700 | $1,600 | $2.29 | 18d | 1 | 0.59mi |
| 411 Madison Ave Unit N202 Cape Canaveral, FL | 1.0 | 1.0 | 672 | $1,650 | $2.46 | 23d | 1 | 0.64mi |
| 419 Madison Ave Unit 102 Cape Canaveral, FL | 1.0 | 1.0 | 672 | $1,450 | $2.16 | 23d | 1 | 0.66mi |
| 355 Polk Ave #8 Cape Canaveral, FL | 1.0 | 1.0 | 550 | $1,300 | $2.36 | 14d | 1 | 0.70mi |
| 310 Taylor Ave Cape Canaveral, FL | 1.0–2.0 | 1.0 | 820 | $1,475 | $1.80 | 23d | 3 | 0.71mi |
| 467 Jackson Ave Unit Back Unit Cape Canaveral, FL | 1.0 | 1.0 | 528 | $1,500 | $2.84 | 23d | 1 | 0.73mi |
| 7801 Ridgewood Ave Cape Canaveral, FL | 1.0–3.0 | 1.0–2.0 | 893 | $1,400 | $1.57 | 21d | 3 | 0.74mi |
| 7605 Ridgewood Ave Unit 11-1 Cape Canaveral, FL | 1.0 | 1.0 | 484 | $1,650 | $3.41 | 14d | 1 | 0.75mi |
| 610 Jefferson Ave Cape Canaveral, FL | 1.0 | 1.0 | 619 | $2,000 | $3.23 | 18d | 2 | 0.81mi |
| 610 Jefferson Ave Cape Canaveral, FL | 1.0 | 1.0 | 619 | $2,000 | $3.23 | 23d | 3 | 0.81mi |
| 7165 Ridgewood Ave #7 Cape Canaveral, FL | 1.0 | 1.0 | 487 | $1,900 | $3.90 | 23d | 1 | 0.85mi |
| 201 Ocean Park Ln Unit V41 Cape Canaveral, FL | 1.0 | 1.0 | 703 | $1,800 | $2.56 | 23d | 1 | 0.88mi |
| 150 Intrepid Way Unit 8D Cape Canaveral, FL | 1.0 | 1.5 | 737 | $1,550 | $2.10 | 23d | 1 | 0.93mi |
| 315 Grant Ave Cocoa Beach, FL | 2.0 | 2.0 | 720 | $1,795 | $2.49 | 23d | 1 | 1.00mi |
| 315 Grant Ave Cocoa Beach, FL | 2.0 | 2.0 | 720 | $1,795 | $2.49 | 13d | 1 | 1.00mi |
| 515 Hayes Ave Unit 1543008P Cocoa Beach, FL | 1.0 | 1.0 | 613 | $3,011 | $4.91 | 14d | 1 | 1.09mi |
| 205 Cleveland Ave #1 Cocoa Beach, FL | 2.0 | 1.0 | 675 | $1,595 | $2.36 | 23d | 1 | 1.16mi |
| 209 Cleveland Ave Unit 4B Cocoa Beach, FL | 1.0 | 1.0 | 624 | $1,400 | $2.24 | 18d | 1 | 1.17mi |
| 209 Cleveland Ave Unit 4 Cocoa Beach, FL | 2.0 | 1.0 | 624 | $1,400 | $2.24 | 14d | 1 | 1.17mi |
| 135 Roosevelt Ave Unit A Cocoa Beach, FL | 2.0 | 1.0 | 730 | $1,550 | $2.12 | 23d | 1 | 1.28mi |
HOA detail condo
- Monthly dues
- $566 · $6,792/yr
- Likely covers
- pool
- Assessments
- None detected in remarks — confirm with the listing agent.
Listing history 12 events
-
2026-06-03status $75,000 Pending 144 DOM
-
2026-06-02days on market $75,000 Active 144 DOM
-
2026-06-01days on market $75,000 Active 143 DOM
-
2026-05-31days on market $75,000 Active 142 DOM
-
2026-05-31days on market $75,000 Active 141 DOM
-
2026-05-20price $75,000
-
2026-05-13price $79,900
-
2026-03-18price $85,000
-
2026-01-09$100,000 Active
-
1999-08-05soldstatus $26,500
-
1995-06-08soldstatus $26,500
-
1981-09-01soldstatus $36,600
ⓘ Source: listings_history table (triggers on properties + properties_extension) + one-shot
backfill from property_details.listing_events for pre-trigger history.
Tax reassessment forecast FL · Resets to sale price
- Current annual tax
- $1,188 · $99/mo
- Projected year-2 tax
- $1,188 · $99/mo
- Expected delta
- $0/yr ($0/mo · 0.0%)
ⓘ Screening estimate from a state-policy table — verify with the county assessor before closing.
Nearby sold comps map
Loading sold comps map…
Walkable amenities ~0.75 mi
Loading nearby amenities…
Taxation est. · year 1
- Rental income
- $17,741
- − Mortgage interest
- −$4,201
- − Property taxes
- −$1,188
- − Insurance
- −$375
- − Repairs & maintenance
- −$1,419
- − Management
- −$1,419
- − HOA
- −$6,792
- − Depreciation
- −$2,182
- Taxable income
- $165
- Est. tax owed @ 24.0%
- −$39
- After-tax cash flow
- $901/yr
For passive investors: Depreciation is non-cash, so a rental often shows a tax loss while cash-flowing — sheltering income. Rental losses are passive: they offset passive income freely, and up to $25,000/yr can offset ordinary (W-2) income if you actively participate and your MAGI is under $100k (phasing out to $0 by $150k); unused losses carry forward. On sale, claimed depreciation is recaptured at up to 25%, and gains may owe capital-gains tax (a 1031 exchange can defer both). Figures are a year-1 estimate at your 24.0% rate — not tax advice; consult a CPA.
Schools (NCES district)
- District
- Brevard
- NCES district ID
- 1200150
- Math proficiency
- 53% ▼ -9.00%
- Reading proficiency
- 57% ▼ -4.00%
- Median HH income
- $49,426
- Composite
- 46.86/100
- National rank
- #2370
- State rank
- #19 of 73 in FL
Livability — Cape Canaveral
- Score
- 84/100
- State rank
- #34
- US rank
- #677
Category grades
Schools grade is shown separately in the Schools card above.
Census & demographics
- Census place
- Cape Canaveral, FL
- County
- Brevard County · 602,871 people
- City population
- 10,005
- Metro
- Palm Bay-Melbourne-Titusville, FL
- Population (ZIP)
- 10,005
- Household income
- $66,955
- Rent vs Own
- Severe rent burden
- 477.0
Population outlook (Brevard County) Hauer SSP2
- Today (2025)
- 623,254 people
- By 2030
- 648,420 · +4.0%
- By 2040
- 690,009 · +10.7%
- By 2050
- 715,669 · +14.8%
- By 2075
- 775,744 · +24.5%
- By 2100
- 776,687 · +24.6%
Race, ethnicity, and origin ACS 2023
- Neighborhood character
- Predominantly White (86%)
- Race & ethnicity
- White 86% Hispanic / Latino 9% Two or more races 4%
- Hispanic origin (detail)
- Mexican 1% Puerto Rican 6%
- Common ancestry
- Romanian 5% Lithuanian 5% Serbian 2%
- Foreign-born
- 6% · Canada
- Languages at home
- 93% English-only · Spanish 4% Russian/Polish/Slavic 1% German/W. Germanic 1%
Political lean MEDSL · Brevard
- 2024 margin
- Strong R (+20.8) · D 39.1% · R 59.9% · Other 1.0%
- 2008→2024 swing
- -10.4pp toward R · 2008: -10.4pp · 2024: -20.8pp
- All cycles
- 2024: R+20.8 2020: R+16.4 2016: R+19.8 2012: R+12.7 2008: R+10.4
Not yet ingested
- Civics
- —
Market trends
- HPI YoY
- ▼ -125.71%
- Current HPI
- 300.9707
- Rent YoY
- ▲ 4.02%
- Metro
- Palm Bay-Melbourne-Titusville, FL
- State GDP YoY
- ▲ 3.28%
- F500 in state
- 36
Industry mix (Fortune 500 HQ in FL)
| Industry | F500 HQs | Revenue |
|---|---|---|
| Industrial Technology | 2 | $29B |
|
||
| Insurance | 2 | $17B |
|
||
| Retail | 1 | $60B |
|
||
| Technology Distribution | 1 | $58B |
|
||
| Homebuilding | 1 | $35B |
|
||
| Technology Manufacturing | 1 | $35B |
|
||
Price history
+104.9% since first listed7 events — show timeline
- 2026-05-20 Price Changed $75,000 SCMLS
- 2026-05-13 Price Changed $79,900 SCMLS
- 2026-03-18 Price Changed $85,000 SCMLS
- 2026-01-09 Listed $100,000 SCMLS
- 1999-08-05 Sold (Public Records) $26,500 Public Records
- 1995-06-08 Sold (Public Records) $26,500 Public Records
- 1981-09-01 Sold (Public Records) $36,600 Public Records
Property tax history
+6.9%/yrLatest (2025): $1,188 · -5.3% YoY. Source: county tax records.
Cash-flow waterfall
monthlySold comps — $/sqft
last 12 mo · ≤1 miLoading sold comps…