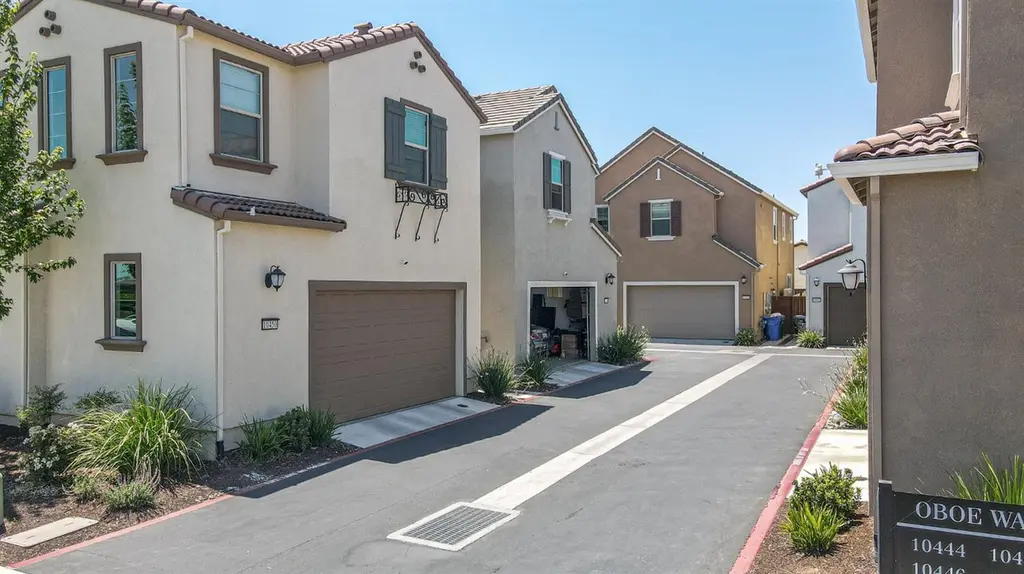
10448 Oboe Way · Elk Grove, CA
Flood risk 2/10 · Minimal
- FEMA flood zone
- X (unshaded)
- Chance of flooding over 30 yrs
- 0.05%
- Est. flood insurance / yr
- $507 – $1,088
Fire risk 5/10 · Moderate
- Est. fire insurance / yr
- $659 – $1,223
Heat risk 7/10 · Major
- Hot days now (above 102°F)
- 7 days/yr
- Hot days in 30 yrs
- 15 days/yr
Wind risk 1/10 · Minimal
- Chance of severe wind over 30 yrs
- —
Air-quality risk 10/10 · Severe
- Unhealthy air days now
- 25 days/yr
- Unhealthy air days in 30 yrs
- 27 days/yr
Risk factors via First Street. Map © Google.
Why this score? — see what drove the D- grade
The composite is a weighted blend of 9 inputs, each scored 0–100. Each bar is that input's sub-score; the figure is the points it added to the 100-point composite (weight × sub-score).
- Appreciation +10.0/10.0
- ARV discount +8.9/15.0
- Cash flow +4.5/30.0
- Schools +4.1/10.0
- Rent growth +3.6/5.0
- Livability +3.6/5.0
- Condition / age +2.5/5.0
- 1% rule +0.7/10.0
- DSCR +0.0/10.0
$545,000
🖨 Deal sheet 📄 Offer letter ✓ Due diligence
Listing remarks
Welcome Home to Modern Living in Sterling Meadows! Built in 2023, this beautifully upgraded smart home in one of Elk Grove's most sought-after communities is everything a first-time buyer has been waiting for and it's move-in ready. Imagine cooking in your gourmet kitchen with a gas range, granite countertops, stainless steel appliances, and soft-close cabinetry, then stepping through sliding glass doors into your own private backyard retreat. The open-concept layout makes entertaining effortless and everyday living a joy. Upstairs, your spacious primary suite is your personal sanctuary complete with a large walk-in closet, dual sinks, and a soaking tub perfect for unwinding after a long
Key facts
- Private backyard
- Walk-in closet
- Smart home
Tags
Neighborhood map
What this means for you Summary
Snapshot
- This is a 3-bed/2.5-bath single-family listed at $545k.
Deal economics
- At list price, monthly cash flow is $-1k ($-17k/yr) — negative.
- To cash-flow at today's rent, offer at most $296k (45.7% below list).
- To meet the 1% rule (rent ≥ 1% of price), the offer needs to be $309k (43.3% below list).
- Recommended offer: $296k (45.7% below list) — sets the bar for cash-flow.
Location & tenants
- Location reads 71/100 on livability (#212 in CA) — a middle-class / working-renter tenant base. Strengths: employment A+, housing A+, crime B+; Watch: commute F, cost of living F.
- Elk Grove Unified (suburban): math 40% / reading 51% proficiency, ranked #165 of 517 in CA (top 32%) — families likely to look elsewhere, expect single-tenant / working-renter base with shorter leases.
- Market conditions: Rents rising fast (+4.5%/yr); 295 active listings in the ZIP; 12 comparable units currently listed for rent nearby; rentals at typical pace (median 17d on market — plan ~3-4 weeks tenant-placement turnaround); high-income renter base; 6,825 units permitted in Sacramento County in 2024 (1,752 in 5+ unit buildings).
Forward outlook
- In year one you build about $58k of equity ($4k loan paydown + $54k appreciation (10.0% local appreciation)).
- Sacramento County population projected at +17% by 2050 — long-run rental-demand tailwind backs the buy-and-hold thesis.
- By year 2, paydown + projected appreciation supports a ~$94k cash-out refi (75% LTV) — recoverable capital for the next deal without selling this one.
Negotiation context
- It's been on market 131 days — a 12% lower offer ($480k) is reasonable based on typical stale-listing flexibility.
Risks & watch-outs
- Climate carrying-cost: moderate wildfire risk; extreme-heat days projected 7→15/yr by 2055 (HVAC capex compounding) — expect insurance premiums to compound above CPI over the hold.
Questions for the listing agent
- What do current leases actually rent for vs. the listed asking? Can we see a recent rent roll and the last 12 months of T-12 income?
- It's been on market 131 days. Have you received any prior offers? Is the seller open to a 46% concession, seller financing, or rate buy-down credit?
- What does the HOA fee cover, when was the last increase, and are there any pending special assessments or reserve-fund shortfalls?
- Why hasn't it sold? Are there any deal-killer items the seller is aware of (foundation, flood, title, zoning, code violations)?
- Is there a deadline driving the sale (1031 exchange, divorce, estate, relocation)? That informs how much negotiation room exists.
- Schools are B-rated — typically a magnet for longer-tenancy family renters. What's the average tenant stay here, and is there a school-zone premium baked into asking?
- The area grade is low — what's the realistic commute time and amenity access for the typical tenant pool here? Any planned neighborhood developments (good or bad) we should know about?
- What's the average days-on-market for RENTAL listings here right now (not sales)? A rising rental-DOM trend means longer vacancies and softer asking-rent achievability than the comps imply.
- What's the recent tenant-quality profile in this submarket — average credit score on applications, eviction rate, late-payment / NSF rate, and stable-employment percentage? A property-management company in the area should have these aggregated.
- How much new for-sale + rental construction is in the pipeline within 1–3 miles? Heavy new supply typically softens prices + rents 12–24 months out; constrained supply supports both.
Investment metrics
- 1% rule
- 0.57% ✗
- Cap rate
- 3.19%
- Cash-on-cash
- -11.08%
- DSCR
- 0.51
- GRM
- 14.7
CMA / ARV
- ARV (median comp)
- $562,890
- List price
- $545,000
- Delta
- -3.18%
- Verdict
- FAIR
- Comps
- 20 within 1.0 mi
Show comp detail 12 sales within ~0.75 mi
| Address | Dist | Beds/Ba | Sqft | Sold | Price | $/sf | Match |
|---|---|---|---|---|---|---|---|
| 10520 Oboe Way | 0.10mi | 3/2.5 | 1,632 (0%) | 0mo | $500,000 | $306 | 95 |
| 10502 Oboe Way | 0.08mi | 3/2.5 | 1,632 (0%) | 5mo | $505,000 | $309 | 92 |
| 8851 Solo Way | 0.18mi | 3/2.5 | 1,632 (0%) | 3mo | $524,800 | $322 | 89 |
| 10545 Tenor Way | 0.19mi | 3/2.5 | 1,632 (0%) | 4mo | $500,000 | $306 | 88 |
| 10569 Tenor Way | 0.22mi | 3/2.5 | 1,632 (0%) | 3mo | $505,000 | $309 | 87 |
| 10517 Etude Way | 0.17mi | 3/2.5 | 1,454 (-11%) | 1mo | $577,000 | $397 | 72 |
| 10349 Charles Morris Way | 0.55mi | 3/2.0 | 1,603 (-2%) | 2mo | $625,000 | $390 | 68 |
| 10352 Charles Morris Way | 0.54mi | 3/2.0 | 1,603 (-2%) | 3mo | $605,000 | $377 | 67 |
| 8830 Encore Way | 0.25mi | 3/2.5 | 1,454 (-11%) | 4mo | $570,000 | $392 | 67 |
| 10367 Evangaline Way | 0.64mi | 2/2.0 (-1) | 1,644 (+1%) | 0mo | $592,500 | $360 | 62 |
| 10360 Evangaline Way | 0.61mi | 2/2.0 (-1) | 1,644 (+1%) | 5mo | $549,000 | $334 | 59 |
| 8977 E Valley Dr | 0.73mi | 4/2.5 (+1) | 1,505 (-8%) | 5mo | $540,000 | $359 | 44 |
Match score weights: distance 35% · size 25% · config 20% · recency 20%. Top-matched comps best support the ARV.
Projected returns pro-forma
10.0% appreciation · 4.54% rent growth · sell at horizon
- IRR
- 16.9%
- Equity multiple
- 2.39×
- Total profit
- $212,014
- Equity at exit
- $490,979
- IRR
- 16.3%
- Equity multiple
- 5.62×
- Total profit
- $705,623
- Equity at exit
- $1,058,815
Cash invested: $152,600 (down + closing). Projections, not guarantees.
Landlord ↔ Tenant lean methodology
- Overall (STATE)
- 18 Strongly Tenant-Friendly
- State California
- 18 Strongly Tenant-Friendly · D+13
- County
- — inherits STATE
- City
- — inherits STATE
ZIP-level market 95757
- Home prices YoY
- 13.5%
- Rents YoY
- 4.5%
- Active inventory
- 295
- Price-to-rent
- 14.7×
Monthly cashflow live
- Estimated rent
- $3,088 high interval (Pro) →
- Mortgage (P&I)
- −$2,858
- Tax from tax record
- −$692 /mo · $8,299/yr
- Insurance
- −$227
- HOA
- −$72
- Vacancy / Maint / Mgmt
- −$648
- Net cashflow
- $-1,409
Break-even live
UW: 25.0% down · 7.5% · 30yr · 1.5% tax · 5.0% vac · 8.0% maint · 8.0% mgmt
Financing live
Cash to close
- Down payment
- $136,250
- Closing costs
- $16,350
- Reserves months
- —
- Total cash needed
- —
Loan-product check · same deal, 3 products live
Conventional
25% down · 7.5% · 30yr
- Down + closing
- —
- Monthly P&I
- —
- Monthly cashflow
- —
- DSCR
- —
- Eligible?
- —
Personal DTI + credit; lowest rate.
DSCR
20% down · 8.5% · 30yr
- Down + closing
- —
- Monthly P&I
- —
- Monthly cashflow
- —
- DSCR
- —
- Eligible?
- —
No personal income docs; deal must DSCR.
Hard money
10% down · 12.0% · 12mo
- Down + closing
- —
- Monthly P&I
- —
- Monthly cashflow
- —
- DSCR
- —
- Eligible?
- —
Short-term bridge; refi at stabilization.
Rent comps 12 comps
| Address | Beds | Baths | Sqft | Rent | $/sqft | DOM | Units | Dist |
|---|---|---|---|---|---|---|---|---|
| 10568 Trill Way Elk Grove, CA | 3.0 | 2.5 | 1815 | $2,900 | $1.60 | 2d | 1 | 0.16mi |
| 10568 Trill Way Elk Grove, CA | 3.0 | 2.5 | 1815 | $2,900 | $1.60 | 1d | 1 | 0.16mi |
| 10191 Gatemont Cir Elk Grove, CA | 3.0 | 2.5 | 1800 | $2,800 | $1.56 | 23d | 1 | 0.72mi |
| 10087 Emerald Grove Dr Elk Grove, CA | 3.0 | 2.0 | 1354 | $2,575 | $1.90 | 43d | 1 | 0.96mi |
| 8376 Solfrid Way Elk Grove, CA | 4.0 | 3.0 | 2070 | $3,200 | $1.55 | 17d | 1 | 1.08mi |
| 8357 Eleodoro Way Elk Grove, CA | 3.0 | 2.5 | 1730 | $3,245 | $1.88 | 2d | 1 | 1.11mi |
| 8357 Luan Way Elk Grove, CA | 3.0 | 2.0 | 1967 | $2,895 | $1.47 | 19d | 1 | 1.19mi |
| 10114 Elise Way Elk Grove, CA | 4.0 | 3.0 | 2214 | $2,995 | $1.35 | 7d | 1 | 1.41mi |
| 10110 Elise Way Elk Grove, CA | 3.0 | 2.5 | 1628 | $3,300 | $2.03 | 7d | 1 | 1.42mi |
| 8403 Sinesky Way Elk Grove, CA | 3.0 | 2.0 | 1579 | $2,995 | $1.90 | 10d | 1 | 1.47mi |
| 10365 Bayson Way Elk Grove, CA | 4.0 | 3.0 | 2018 | $3,300 | $1.64 | 21d | 1 | 1.48mi |
| 10365 Bayson Way Elk Grove, CA | 4.0 | 3.0 | 2018 | $3,300 | $1.64 | 20d | 1 | 1.48mi |
HOA detail
- Monthly dues
- $72 · $864/yr
- Likely covers
- gas
Listing history 10 events
-
2026-06-13days on market $545,000 Active 131 DOM
-
2026-06-13days on market $545,000 Active 130 DOM
-
2026-06-09days on market $545,000 Active 127 DOM
-
2026-06-08days on market $545,000 Active 126 DOM
-
2026-06-07days on market $545,000 Active 125 DOM
-
2026-06-05days on market $545,000 Active 122 DOM
-
2026-06-03days on market $545,000 Active 121 DOM
-
2026-06-02days on market $545,000 Active 120 DOM
-
2026-06-01days on market $545,000 Active 119 DOM
-
2026-05-31days on market $545,000 Active 118 DOM
ⓘ Source: listings_history table (triggers on properties + properties_extension) + one-shot
backfill from property_details.listing_events for pre-trigger history.
Tax reassessment forecast CA · Resets to sale price
- Current annual tax
- $8,299 · $692/mo
- Projected year-2 tax
- $8,299 · $692/mo
- Expected delta
- $0/yr ($0/mo · 0.0%)
ⓘ Screening estimate from a state-policy table — verify with the county assessor before closing.
Climate risk First Street
- Flood 2/10 Low FEMA zone X (unshaded) · 5% chance over 30 yrs
- Wildfire 5/10 Major
- Heat 7/10 Severe 7 d/yr ≥102°F today · 15 d/yr by 30 yrs out
- Wind 1/10 Low
- Air quality 10/10 Extreme 25 unhealthy d/yr today · 27 by 30 yrs out
Nearby sold comps map
Loading sold comps map…
Walkable amenities ~0.75 mi
Loading nearby amenities…
Taxation est. · year 1
- Rental income
- $37,054
- − Mortgage interest
- −$30,528
- − Property taxes
- −$8,299
- − Insurance
- −$2,725
- − Repairs & maintenance
- −$2,964
- − Management
- −$2,964
- − HOA
- −$864
- − Depreciation
- −$15,855
- Taxable loss
- −$27,146
- Est. tax savings @ 24.0%
- +$6,515
- After-tax cash flow
- $-10,397/yr
For passive investors: Depreciation is non-cash, so a rental often shows a tax loss while cash-flowing — sheltering income. Rental losses are passive: they offset passive income freely, and up to $25,000/yr can offset ordinary (W-2) income if you actively participate and your MAGI is under $100k (phasing out to $0 by $150k); unused losses carry forward. On sale, claimed depreciation is recaptured at up to 25%, and gains may owe capital-gains tax (a 1031 exchange can defer both). Figures are a year-1 estimate at your 24.0% rate — not tax advice; consult a CPA.
Schools (NCES district)
- District
- Elk Grove Unified
- NCES district ID
- 0612330
- Math proficiency
- 40% ▼ -5.00%
- Reading proficiency
- 51% ▼ -5.00%
- Median HH income
- $67,860
- Composite
- 40.72/100
- National rank
- #3658
- State rank
- #165 of 517 in CA
Livability — Elk Grove
- Score
- 71/100
- State rank
- #212
- US rank
- #6681
Category grades
Schools grade is shown separately in the Schools card above.
Census & demographics
- Census place
- Elk Grove, CA
- County
- Sacramento County · 1,539,646 people
- City population
- 190,119
- Metro
- Sacramento-Roseville-Folsom, CA
- Population (ZIP)
- 56,764
- Household income
- $138,198
- Rent vs Own
- Severe rent burden
- 1121.0
Population outlook (Sacramento County) Hauer SSP2
- Today (2025)
- 1,660,763 people
- By 2030
- 1,732,990 · +4.3%
- By 2040
- 1,855,755 · +11.7%
- By 2050
- 1,941,335 · +16.9%
- By 2075
- 2,046,162 · +23.2%
- By 2100
- 1,961,444 · +18.1%
Race, ethnicity, and origin ACS 2023
- Neighborhood character
- Highly diverse neighborhood (Simpson 0.75)
- Race & ethnicity
- Asian 40% White 21% Hispanic / Latino 18% Two or more races 14% Black 11% Pacific Islander 1%
- Hispanic origin (detail)
- Mexican 14%
- Common ancestry
- Russian 1% Italian 1% Portuguese 1%
- Foreign-born
- 28% · China, Canada, Vietnam
- Languages at home
- 62% English-only · Spanish 8% Other Indo-European 7% Chinese 7%
Political lean MEDSL · Sacramento
- 2024 margin
- D (+19.7) · D 58.1% · R 38.4% · Other 3.5%
- 2008→2024 swing
- +0.7pp no change · 2008: 19.0pp · 2024: 19.7pp
- All cycles
- 2024: D+19.7 2020: D+25.3 2016: D+23.7 2012: D+16.3 2008: D+19.0
Not yet ingested
- Civics
- —
Market trends
- HPI YoY
- ▲ 39.15%
- Current HPI
- 328.5885
- Rent YoY
- ▲ 4.54%
- Metro
- Sacramento-Roseville-Folsom, CA
- State GDP YoY
- ▲ 3.21%
- F500 in state
- 116
Industry mix (Fortune 500 HQ in CA)
| Industry | F500 HQs | Revenue |
|---|---|---|
| Technology | 27 | $1,492B |
|
||
| Financial Services | 3 | $174B |
|
||
| Retail | 3 | $44B |
|
||
| Insurance | 3 | $26B |
|
||
| Media / Entertainment | 2 | $115B |
|
||
| Pharmaceuticals / Biotech | 2 | $62B |
|
||
Property tax history
+29.6%/yrLatest (2025): $8,299 · +1.9% YoY. Source: county tax records.
Cash-flow waterfall
monthlySold comps — $/sqft
last 12 mo · ≤1 miLoading sold comps…