3410 Plantation Dr · Florence, SC
Flood risk 1/10 · Minimal
- FEMA flood zone
- X (unshaded)
- Chance of flooding over 30 yrs
- 0.0%
- Est. flood insurance / yr
- $507 – $1,088
Fire risk 7/10 · Major
- Est. fire insurance / yr
- $783 – $1,453
Heat risk 7/10 · Major
- Hot days now (above 108°F)
- 7 days/yr
- Hot days in 30 yrs
- 16 days/yr
Wind risk 8/10 · Major
- Chance of severe wind over 30 yrs
- 80.0%
Air-quality risk 1/10 · Minimal
- Unhealthy air days now
- 0 days/yr
- Unhealthy air days in 30 yrs
- 0 days/yr
Risk factors via First Street. Map © Google.
Why this score? — see what drove the B+ grade
The composite is a weighted blend of 9 inputs, each scored 0–100. Each bar is that input's sub-score; the figure is the points it added to the 100-point composite (weight × sub-score).
- Cash flow +30.0/30.0
- ARV discount +15.0/15.0
- DSCR +10.0/10.0
- 1% rule +9.9/10.0
- Rent growth +4.2/5.0
- Schools +3.2/10.0
- Livability +3.1/5.0
- Condition / age +2.5/5.0
- Appreciation +0.0/10.0
$125,000
🖨 Deal sheet 📄 Offer letter ✓ Due diligence
Listing remarks MLS
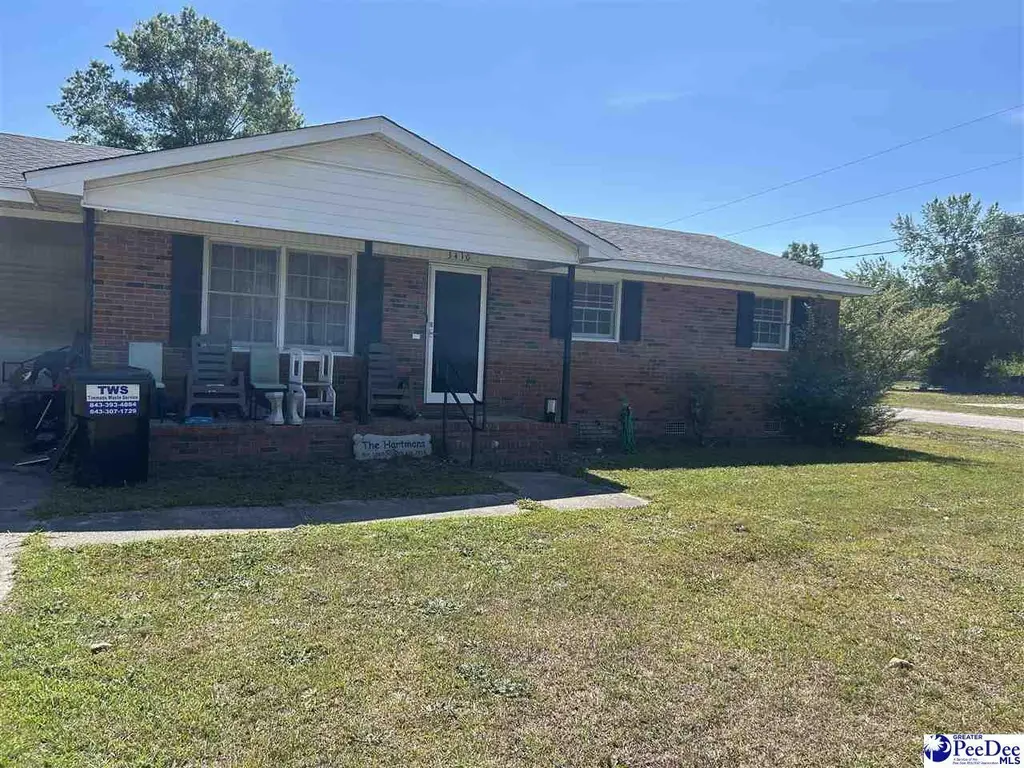
Updated brick ranch style home located on a corner lot. 4 bedrooms, 1.5 baths, single carport, approx. 1150 square feet. New paint, new flooring, new bathroom fixtures. Granite countertops in kitchen. Spacious fenced back yard. Must see! $139,900.
Key facts
- Fenced yard
- 0.34 acre lot
- Garage
Tags
Property features AI
Exterior
- Parking: Attached or detached garage with 1 car space
- Utilities: Public water; Public sewer
- Home design: Single-family residence; Residential property; Brick veneer construction
- Construction: Brick veneer exterior; Shingle roof
- Exterior features: Porch; Fenced yard; Corner lot
Interior
- Kitchen: Range
- Flooring: Carpet; Vinyl
- Bathrooms: 1 full bathroom; 1 half bathroom
- Heating & cooling: Central heating; Central air; Ceiling fan(s)
- Interior features: Range (kitchen appliance)
Neighborhood map
What this means for you Summary
Snapshot
- This is a 4-bed/1.5-bath single-family listed at $125k.
Deal economics
- At list price, monthly cash flow is $701 ($8k/yr) — positive.
- The deal already cash-flows at list — no discount required.
- Meets the 1% rule at list price ($2k rent vs $125k).
- Recommended offer: $121k (3.0% below list) — sets the bar for market timing.
- Cap rate 13.0% vs local median 3.5% in Florence — top-decile yield for the area; either an underpriced asset or a hidden risk that comps aren't pricing in. Stress-test before assuming the spread holds.
Location & tenants
- Location reads 62/100 on livability (#196 in SC) — a middle-class / working-renter tenant base. Strengths: cost of living A+, housing A+, health & safety B+; Watch: employment C-, crime F, amenities F.
- Florence 01 (urban): math 29% / reading 47% proficiency, ranked #34 of 80 in SC (top 42%) — families likely to look elsewhere, expect single-tenant / working-renter base with shorter leases.
- Zoned schools: Dewey-Carter Elementary (math 25% / reading 34%, grade F, #399 of 597 statewide, top 69%, 583 students, 100% FRL); Southside Middle (math 18% / reading 38%, grade F, #146 of 229 statewide, top 64%, 1,100 students, 100% FRL); South Florence High (math 58% / reading 86%, grade B+, #48 of 196 statewide, top 26%, 1,643 students, 77% FRL) — zoned schools average 92% FRL vs 57% district-wide (35 pts higher); higher-poverty schools than district average — tighter screening recommended.
- Market conditions: Rents rising fast (+7.0%/yr); 183 active listings in the ZIP; 657 units permitted in Florence County in 2024 (40 in 5+ unit buildings).
- This rent runs 33% of the median local income ($67k/yr) — at the standard rent-burdened threshold; future hikes will face affordability resistance.
Forward outlook
- Local home prices are declining (-3.0%/yr); year-one equity from $864 of loan paydown is wiped out by about $4k of value loss. Plan a longer hold.
- At projected returns (-3.0% appreciation + 7.0% rent growth), your $35k cash investment doubles in ~5 years — after that, you're playing with house money.
Negotiation context
- It's been on market 31 days — a 3% lower offer ($121k) is reasonable based on typical stale-listing flexibility.
- 2 sale attempts since 4y ago; this cycle's ask has dropped $10k (7%) from the opening price — seller is motivated, your offer sets the floor, not the list.
Risks & watch-outs
- Climate carrying-cost: severe wind risk, 80% chance of damaging wind over 30y; major wildfire risk; extreme-heat days projected 7→16/yr by 2055 (HVAC capex compounding) — expect insurance premiums to compound above CPI over the hold.
Questions for the listing agent
- It's been on market 31 days. Have you received any prior offers? Is the seller open to a 3% concession, seller financing, or rate buy-down credit?
- Built in 1971 — when were the roof, HVAC, electrical panel, plumbing, and water heater last replaced?
- Is there a deadline driving the sale (1031 exchange, divorce, estate, relocation)? That informs how much negotiation room exists.
- Crime grade is F in this area — have there been break-ins, vandalism, or insurance claims at this property in the last 3 years? What carrier currently insures it and at what premium?
- What's the average days-on-market for RENTAL listings here right now (not sales)? A rising rental-DOM trend means longer vacancies and softer asking-rent achievability than the comps imply.
- What's the recent tenant-quality profile in this submarket — average credit score on applications, eviction rate, late-payment / NSF rate, and stable-employment percentage? A property-management company in the area should have these aggregated.
- How much new for-sale + rental construction is in the pipeline within 1–3 miles? Heavy new supply typically softens prices + rents 12–24 months out; constrained supply supports both.
Investment metrics
- 1% rule
- 1.49% ✓
- Cap rate
- 13.02%
- Cash-on-cash
- 24.03%
- DSCR
- 2.07
- GRM
- 5.6
CMA / ARV
- ARV (on-the-fly)
- $169,506
- Comps found
- 12
Show comp detail 12 sales within ~0.75 mi
| Address | Dist | Beds/Ba | Sqft | Sold | Price | $/sf | Match |
|---|---|---|---|---|---|---|---|
| 3524 Plantation Dr | 0.14mi | 4/2.0 | 1,150 (-1%) | 5mo | $174,000 | $151 | 86 |
| 3707 Gable Ter | 0.26mi | 3/1.5 (-1) | 1,120 (-4%) | 2mo | $75,000 | $67 | 75 |
| 1025 E Scarlett Ln | 0.13mi | 3/1.0 (-1) | 1,102 (-5%) | 4mo | $100,000 | $91 | 75 |
| 3509 Plantation Dr | 0.07mi | 3/1.5 (-1) | 1,050 (-10%) | 12mo | $139,900 | $133 | 66 |
| 822 E Butler Ln | 0.48mi | 3/1.5 (-1) | 1,100 (-5%) | 1mo | $134,900 | $123 | 63 |
| 1016 Aunt Prissey Ct | 0.34mi | 3/2.0 (-1) | 1,183 (+2%) | 13mo | $173,200 | $146 | 63 |
| 908 E Candy Ln | 0.38mi | 3/2.0 (-1) | 1,261 (+9%) | 1mo | $207,500 | $165 | 60 |
| 816 Madeira Ln | 0.46mi | 3/1.5 (-1) | 1,222 (+5%) | 9mo | $169,500 | $139 | 58 |
| 1010 E Scarlett Ln | 0.21mi | 3/2.0 (-1) | 1,050 (-10%) | 20mo | $165,000 | $157 | 51 |
| 823 E Bonnie Ln | 0.53mi | 3/1.5 (-1) | 1,108 (-5%) | 16mo | $100,000 | $90 | 49 |
| 818 E Scarlett Ln | 0.45mi | 3/2.0 (-1) | 1,050 (-10%) | 16mo | $165,000 | $157 | 42 |
| 3209 Haven Straits | 0.62mi | 3/2.0 (-1) | 1,319 (+14%) | 10mo | $250,900 | $190 | 33 |
Match score weights: distance 35% · size 25% · config 20% · recency 20%. Top-matched comps best support the ARV.
Projected returns pro-forma
-3.0% appreciation · 6.97% rent growth · sell at horizon
- IRR
- 21.4%
- Equity multiple
- 1.92×
- Total profit
- $32,113
- Equity at exit
- $18,638
- IRR
- 31.9%
- Equity multiple
- 4.43×
- Total profit
- $119,886
- Equity at exit
- $10,808
Cash invested: $35,000 (down + closing). Projections, not guarantees.
Landlord ↔ Tenant lean methodology
- Overall (STATE)
- 90 Strongly Landlord-Friendly
- State South Carolina
- 90 Strongly Landlord-Friendly · R+6
- County
- — inherits STATE
- City
- — inherits STATE
ZIP-level market 29505
- Rents YoY
- 7.0%
- Active inventory
- 183
- Price-to-rent
- 5.6×
Monthly cashflow live
- Estimated rent
- $1,868 medium interval (Pro) →
- Mortgage (P&I)
- −$656
- Tax from tax record
- −$67 /mo · $805/yr
- Insurance
- −$52
- HOA
- −$0
- Vacancy / Maint / Mgmt
- −$392
- Net cashflow
- $701
Break-even live
UW: 25.0% down · 7.5% · 30yr · 1.5% tax · 5.0% vac · 8.0% maint · 8.0% mgmt
Financing live
Cash to close
- Down payment
- $31,250
- Closing costs
- $3,750
- Reserves months
- —
- Total cash needed
- —
Loan-product check · same deal, 3 products live
Conventional
25% down · 7.5% · 30yr
- Down + closing
- —
- Monthly P&I
- —
- Monthly cashflow
- —
- DSCR
- —
- Eligible?
- —
Personal DTI + credit; lowest rate.
DSCR
20% down · 8.5% · 30yr
- Down + closing
- —
- Monthly P&I
- —
- Monthly cashflow
- —
- DSCR
- —
- Eligible?
- —
No personal income docs; deal must DSCR.
Hard money
10% down · 12.0% · 12mo
- Down + closing
- —
- Monthly P&I
- —
- Monthly cashflow
- —
- DSCR
- —
- Eligible?
- —
Short-term bridge; refi at stabilization.
Listing history 10 events
-
2026-06-05days on market $125,000 Active 31 DOM
-
2026-06-02days on market $125,000 Active 29 DOM
-
2026-06-01days on market $125,000 Active 28 DOM
-
2026-05-31days on market $125,000 Active 27 DOM
-
2026-05-30days on market $125,000 Active 26 DOM
-
2026-05-19price $125,000
-
2026-05-04$135,000 Active
-
2022-06-30soldstatus 247-char remark
Show marketing remark (247 chars)
Updated brick ranch style home located on a corner lot. 4 bedrooms, 1.5 baths, single carport, approx. 1150 square feet. New paint, new flooring, new bathroom fixtures. Granite countertops in kitchen. Spacious fenced back yard. Must see! $139,900.
-
2022-06-30soldstatus $139,900
Show marketing remark (247 chars)
Updated brick ranch style home located on a corner lot. 4 bedrooms, 1.5 baths, single carport, approx. 1150 square feet. New paint, new flooring, new bathroom fixtures. Granite countertops in kitchen. Spacious fenced back yard. Must see! $139,900.
-
2022-06-15$139,900 247-char remark
Show marketing remark (247 chars)
Updated brick ranch style home located on a corner lot. 4 bedrooms, 1.5 baths, single carport, approx. 1150 square feet. New paint, new flooring, new bathroom fixtures. Granite countertops in kitchen. Spacious fenced back yard. Must see! $139,900.
ⓘ Source: listings_history table (triggers on properties + properties_extension) + one-shot
backfill from property_details.listing_events for pre-trigger history.
Tax reassessment forecast SC · Resets to sale price
- Current annual tax
- $805 · $67/mo
- Projected year-2 tax
- $805 · $67/mo
- Expected delta
- $0/yr ($0/mo · 0.0%)
ⓘ Screening estimate from a state-policy table — verify with the county assessor before closing.
Climate risk First Street
- Flood 1/10 Low FEMA zone X (unshaded) · 0% chance over 30 yrs
- Wildfire 7/10 Severe
- Heat 7/10 Severe 7 d/yr ≥108°F today · 16 d/yr by 30 yrs out
- Wind 8/10 Severe 80% chance of damaging wind over 30 yrs
- Air quality 1/10 Low 0 unhealthy d/yr today · 0 by 30 yrs out
Nearby sold comps map
Loading sold comps map…
Walkable amenities ~0.75 mi
Loading nearby amenities…
Taxation est. · year 1
- Rental income
- $22,413
- − Mortgage interest
- −$7,002
- − Property taxes
- −$805
- − Insurance
- −$625
- − Repairs & maintenance
- −$1,793
- − Management
- −$1,793
- − Depreciation
- −$3,636
- Taxable income
- $6,759
- Est. tax owed @ 24.0%
- −$1,622
- After-tax cash flow
- $6,788/yr
For passive investors: Depreciation is non-cash, so a rental often shows a tax loss while cash-flowing — sheltering income. Rental losses are passive: they offset passive income freely, and up to $25,000/yr can offset ordinary (W-2) income if you actively participate and your MAGI is under $100k (phasing out to $0 by $150k); unused losses carry forward. On sale, claimed depreciation is recaptured at up to 25%, and gains may owe capital-gains tax (a 1031 exchange can defer both). Figures are a year-1 estimate at your 24.0% rate — not tax advice; consult a CPA.
Schools (NCES district)
- District
- Florence 01
- NCES district ID
- 4502130
- Math proficiency
- 29% ▼ -10.00%
- Reading proficiency
- 47% ▬ 0.00%
- Median HH income
- $45,782
- Composite
- 32.36/100
- National rank
- #5737
- State rank
- #34 of 80 in SC
Livability — Florence
- Score
- 62/100
- State rank
- #196
- US rank
- #17076
Category grades
Schools grade is shown separately in the Schools card above.
Census & demographics
- County
- Florence County · 93,345 people
- City population
- 93,345
- Metro
- Florence, SC
- Population (ZIP)
- 23,895
- Household income
- $67,343
- Rent vs Own
- Severe rent burden
- 559.0
Population outlook (Florence County) Hauer SSP2
- Today (2025)
- 141,714 people
- By 2030
- 142,121 · +0.3%
- By 2040
- 141,344 · -0.3%
- By 2050
- 139,478 · -1.6%
- By 2075
- 132,275 · -6.7%
- By 2100
- 118,374 · -16.5%
Race, ethnicity, and origin ACS 2023
- Neighborhood character
- Diverse neighborhood (Simpson 0.57)
- Race & ethnicity
- White 53% Black 38% Hispanic / Latino 5% Two or more races 3% Asian 1%
- Common ancestry
- Slovak 2% Lithuanian 1% Serbian 1%
- Foreign-born
- 3% · Canada, China
- Languages at home
- 96% English-only · Spanish 2% Other Indo-European 1%
Political lean MEDSL · Florence
- 2024 margin
- Lean R (+8.0) · D 45.3% · R 53.3% · Other 1.3%
- 2008→2024 swing
- -4.8pp toward R · 2008: -3.2pp · 2024: -8.0pp
- All cycles
- 2024: R+8.0 2020: R+2.3 2016: R+5.0 2012: R+0.5 2008: R+3.2
Not yet ingested
- Civics
- —
Market trends
- HPI YoY
- ▼ -138.13%
- Current HPI
- 177.9352
- Rent YoY
- ▲ 6.97%
- Metro
- Florence, SC
- State GDP YoY
- ▲ 4.51%
- F500 in state
- 2
Industry mix (Fortune 500 HQ in SC)
| Industry | F500 HQs | Revenue |
|---|---|---|
| Packaging | 1 | $7B |
|
||
Price history
-10.7% since first listed5 events — show timeline
- 2026-05-19 Price Changed $125,000 RAGPD
- 2026-05-04 Listed $135,000 RAGPD
- 2022-06-30 Sold (Public Records) $139,900 Public Records
- 2022-06-30 Sold (MLS) — RAGPD
- 2022-06-15 Listed $139,900 RAGPD
Property tax history
-1.5%/yrLatest (2025): $805 · +8.2% YoY. Source: county tax records.
Cash-flow waterfall
monthlySold comps — $/sqft
last 12 mo · ≤1 miLoading sold comps…