3324 W 19th #186 Ave #186 · Kennewick, WA
Flood risk 1/10 · Minimal
- FEMA flood zone
- —
- Chance of flooding over 30 yrs
- 0.0%
- Est. flood insurance / yr
- —
Fire risk 4/10 · Minor
- Est. fire insurance / yr
- $604 – $1,122
Heat risk 4/10 · Minor
- Hot days now (above 99°F)
- 6 days/yr
- Hot days in 30 yrs
- 13 days/yr
Wind risk 1/10 · Minimal
- Chance of severe wind over 30 yrs
- —
Air-quality risk 8/10 · Major
- Unhealthy air days now
- 14 days/yr
- Unhealthy air days in 30 yrs
- 15 days/yr
Risk factors via First Street. Map © Google.
Why this score? — see what drove the B+ grade
The composite is a weighted blend of 9 inputs, each scored 0–100. Each bar is that input's sub-score; the figure is the points it added to the 100-point composite (weight × sub-score).
- Cash flow +30.0/30.0
- ARV discount +11.1/15.0
- 1% rule +10.0/10.0
- DSCR +10.0/10.0
- Schools +4.6/10.0
- Condition / age +4.0/5.0
- Livability +3.9/5.0
- Rent growth +2.5/5.0
- Appreciation +0.0/10.0
$69,000
🖨 Deal sheet 📄 Offer letter ✓ Due diligence
Listing remarks MLS
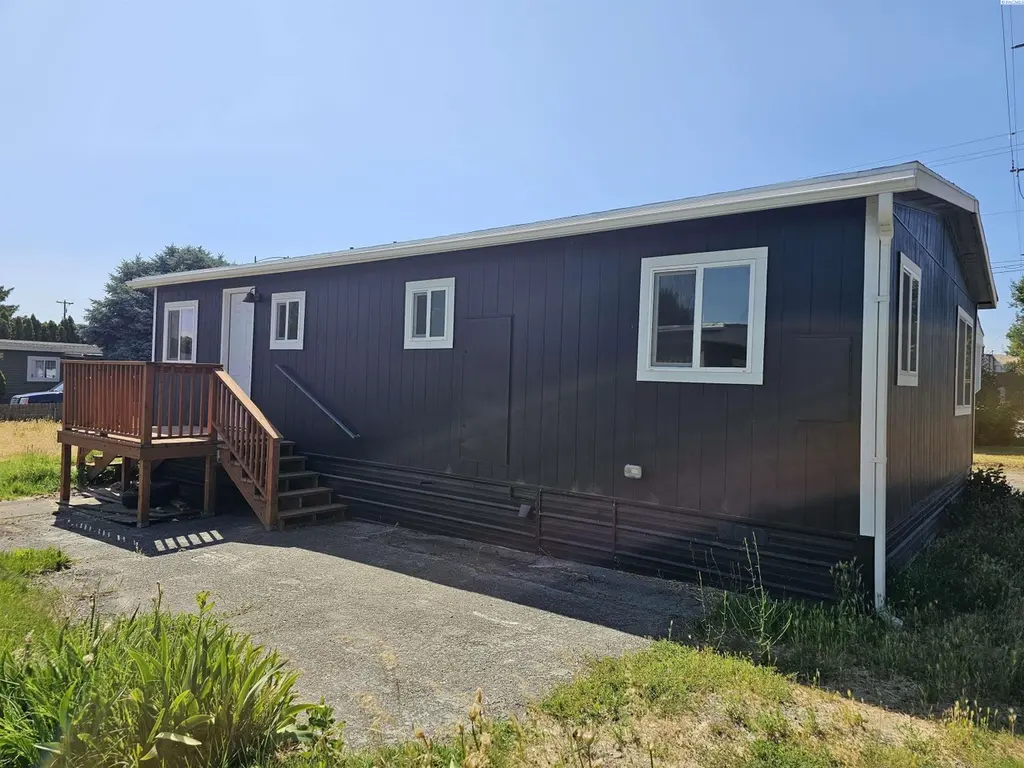
MLS# 285245 Charming MFH that has been completely updated inside and waiting for new owner. This home has lots of natural daylight and has been recently painted inside and out. Some of the updates are that all new flooring throughout the entire home along with updated fixtures. There are also vinyl windows along with a new roof. Home sits on a large lot with lots of potential. There is a new wood deck to enjoy the summer evenings on. Great location near shopping, restaurants and so much more. Owner is willing to carry contract with large down payment. Call broker for details.
Key facts
- Vinyl windows
- Updated inside
- New flooring
Tags
Neighborhood map
What this means for you Summary
Snapshot
- This is a 2-bed/1.0-bath single-family listed at $69k. Condition is rated good.
Deal economics
- At list price, monthly cash flow is $814 ($10k/yr) — positive.
- The deal already cash-flows at list — no discount required.
- Meets the 1% rule at list price ($2k rent vs $69k).
- Recommended offer: $61k (12.0% below list) — sets the bar for market timing.
- Cap rate 20.5% vs local median 3.3% in Kennewick — top-decile yield for the area; either an underpriced asset or a hidden risk that comps aren't pricing in. Stress-test before assuming the spread holds.
Location & tenants
- Location reads 78/100 on livability (#131 in WA, #2,599 nationally) — a middle-class / working-renter tenant base. Strengths: commute A+, housing A+, health & safety A; Watch: schools D+, amenities D+, crime F.
- Kennewick School District (urban): math 43% / reading 58% proficiency, ranked #141 of 291 in WA (top 48%) — acceptable for families but not a draw, mixed tenant base, ~2y average lease.
- Market conditions: 309 active listings in the ZIP; 30 comparable units currently listed for rent nearby; rentals at typical pace (median 21d on market — plan ~3-4 weeks tenant-placement turnaround); 40% of comp listings sitting > 30 days — soft ceiling on asking rent; high-income renter base; 1,532 units permitted in Benton County in 2024 (389 in 5+ unit buildings).
- This rent is only 17% of the median local income ($111k/yr) — well below the 30% rent-burden line; pricing power to push rent on renewal without tenant pushback.
Forward outlook
- Local home prices are declining (-3.0%/yr); year-one equity from $477 of loan paydown is wiped out by about $2k of value loss. Plan a longer hold.
- Benton County population projected at +32% by 2050 — long-run rental-demand tailwind backs the buy-and-hold thesis.
- At projected returns (-3.0% appreciation + 3.0% rent growth), your $19k cash investment doubles in ~3 years — after that, you're playing with house money.
Negotiation context
- It's been on market 360 days — a 12% lower offer ($61k) is reasonable based on typical stale-listing flexibility.
- 2 sale attempts since 2y ago; this cycle's ask has dropped $10k (13%) from the opening price — seller is motivated, your offer sets the floor, not the list.
Questions for the listing agent
- It's been on market 360 days. Have you received any prior offers? Is the seller open to a 12% concession, seller financing, or rate buy-down credit?
- Built in 1979 — when were the roof, HVAC, electrical panel, plumbing, and water heater last replaced?
- Why hasn't it sold? Are there any deal-killer items the seller is aware of (foundation, flood, title, zoning, code violations)?
- Is there a deadline driving the sale (1031 exchange, divorce, estate, relocation)? That informs how much negotiation room exists.
- Schools are D-rated, which usually means shorter tenancies and higher turnover. Who's the typical renter profile here, and what's been the actual vacancy rate?
- Crime grade is F in this area — have there been break-ins, vandalism, or insurance claims at this property in the last 3 years? What carrier currently insures it and at what premium?
- What's the average days-on-market for RENTAL listings here right now (not sales)? A rising rental-DOM trend means longer vacancies and softer asking-rent achievability than the comps imply.
- What's the recent tenant-quality profile in this submarket — average credit score on applications, eviction rate, late-payment / NSF rate, and stable-employment percentage? A property-management company in the area should have these aggregated.
- How much new for-sale + rental construction is in the pipeline within 1–3 miles? Heavy new supply typically softens prices + rents 12–24 months out; constrained supply supports both.
Investment metrics
- 1% rule
- 2.24% ✓
- Cap rate
- 20.45%
- Cash-on-cash
- 50.57%
- DSCR
- 3.25
- GRM
- 3.7
CMA / ARV
- ARV (median comp)
- $75,000
- List price
- $69,000
- Delta
- -8.00%
- Verdict
- FAIR
- Comps
- 7 within 1.0 mi
Show comp detail 1 sale within ~0.75 mi
| Address | Dist | Beds/Ba | Sqft | Sold | Price | $/sf | Match |
|---|---|---|---|---|---|---|---|
| 3510 W 10th Ave Unit D | 0.51mi | 2/1.0 | 830 (-4%) | 21mo | $1,095 | $1 | 52 |
Match score weights: distance 35% · size 25% · config 20% · recency 20%. Top-matched comps best support the ARV.
Projected returns pro-forma
-3.0% appreciation · 3.0% rent growth · sell at horizon
- IRR
- 48.3%
- Equity multiple
- 3.10×
- Total profit
- $40,655
- Equity at exit
- $10,288
- IRR
- 53.9%
- Equity multiple
- 6.28×
- Total profit
- $102,093
- Equity at exit
- $5,966
Cash invested: $19,320 (down + closing). Projections, not guarantees.
Landlord ↔ Tenant lean methodology
- Overall (STATE)
- 28 Tenant-Leaning
- State Washington
- 28 Tenant-Leaning · D+8
- County
- — inherits STATE
- City
- — inherits STATE
ZIP-level market 99338
- Active inventory
- 309
- Price-to-rent
- 3.7×
Monthly cashflow live
- Estimated rent
- $1,544 high interval (Pro) →
- Mortgage (P&I)
- −$362
- Tax from tax record
- −$15 /mo · $179/yr
- Insurance
- −$29
- HOA
- −$0
- Vacancy / Maint / Mgmt
- −$324
- Net cashflow
- $814
Break-even live
UW: 25.0% down · 7.5% · 30yr · 1.5% tax · 5.0% vac · 8.0% maint · 8.0% mgmt
Financing live
Cash to close
- Down payment
- $17,250
- Closing costs
- $2,070
- Reserves months
- —
- Total cash needed
- —
Loan-product check · same deal, 3 products live
Conventional
25% down · 7.5% · 30yr
- Down + closing
- —
- Monthly P&I
- —
- Monthly cashflow
- —
- DSCR
- —
- Eligible?
- —
Personal DTI + credit; lowest rate.
DSCR
20% down · 8.5% · 30yr
- Down + closing
- —
- Monthly P&I
- —
- Monthly cashflow
- —
- DSCR
- —
- Eligible?
- —
No personal income docs; deal must DSCR.
Hard money
10% down · 12.0% · 12mo
- Down + closing
- —
- Monthly P&I
- —
- Monthly cashflow
- —
- DSCR
- —
- Eligible?
- —
Short-term bridge; refi at stabilization.
Rent comps 30 comps
| Address | Beds | Baths | Sqft | Rent | $/sqft | DOM | Units | Dist |
|---|---|---|---|---|---|---|---|---|
| 3611 W 17th Pl Unit A Kennewick, WA | 2.0 | 1.0 | 970 | $1,495 | $1.54 | 20d | 1 | 0.08mi |
| 4112 W 24th Ave Kennewick, WA | 1.0–2.0 | 1.0–2.0 | 681 | $1,875 | $2.75 | 20d | 4 | 0.44mi |
| 2652 W 15th Ave Kennewick, WA | 2.0–3.0 | 2.0 | 1152 | $1,599 | $1.39 | 13d | 5 | 0.60mi |
| 3426 W 7th Ave Unit A130 Kennewick, WA | 2.0 | 2.0 | 1000 | $1,650 | $1.65 | 43d | 1 | 0.74mi |
| 3426 W 7th Ave Kennewick, WA | 2.0 | 2.0 | 1000 | $1,600 | $1.60 | 20d | 1 | 0.74mi |
| 3113 W 7th Ave Unit D110 Kennewick, WA | 2.0 | 2.5 | 1000 | $1,750 | $1.75 | 13d | 1 | 0.75mi |
| 3708 W 6th Ave Unit B Kennewick, WA | 2.0 | 1.0 | 918 | $1,325 | $1.44 | 43d | 1 | 0.81mi |
| 455 S Morain St Kennewick, WA | 2.0 | 1.0 | 775 | $1,950 | $2.52 | 43d | 1 | 0.89mi |
| 400 S Morain St #7 Kennewick, WA | 3.0 | 2.5 | 1100 | $1,500 | $1.36 | 20d | 1 | 0.95mi |
| E 6th Ave Kennewick, WA | 2.0 | 1.0 | 1100 | $1,500 | $1.36 | 43d | 1 | 1.00mi |
| 337 S Johnson St Unit A Kennewick, WA | 1.0 | 1.0 | 550 | $975 | $1.77 | 43d | 1 | 1.00mi |
| 337 S Johnson St Unit F Kennewick, WA | 1.0 | 1.0 | 550 | $875 | $1.59 | 20d | 1 | 1.00mi |
| 325 S Johnson St Kennewick, WA | 2.0 | 1.5 | 1100 | $1,495 | $1.36 | 43d | 1 | 1.02mi |
| 3120 W 4th Ave Kennewick, WA | 2.0 | 1.0 | 963 | $1,550 | $1.61 | 13d | 1 | 1.02mi |
| 3120 W 4th Ave Apt 120 Kennewick, WA | 2.0 | 1.0 | 963 | $1,625 | $1.69 | 13d | 1 | 1.02mi |
| 3120 W 4th Ave Unit 360 Kennewick, WA | 2.0 | 1.0 | 963 | $1,550 | $1.61 | 43d | 1 | 1.02mi |
| 500 S Conway Pl Unit 500 Kennewick, WA | 2.0 | 1.0 | 950 | $1,500 | $1.58 | 43d | 1 | 1.04mi |
| 513 S Anderson St Kennewick, WA | 2.0 | 1.0 | 720 | $1,495 | $2.08 | 20d | 1 | 1.11mi |
| 1816 W 21st Ave Unit C Kennewick, WA | 3.0 | 2.0 | 1120 | $1,495 | $1.33 | 13d | 1 | 1.12mi |
| 3703 W Kennewick Ave Kennewick, WA | 1.0–2.0 | 1.0 | 782 | $1,594 | $2.04 | 13d | 8 | 1.18mi |
| 12 S Morain St Kennewick, WA | 1.0–3.0 | 1.0 | 604 | $1,249 | $2.07 | 13d | 3 | 1.20mi |
| 130 S Conway Pl Kennewick, WA | 2.0 | 1.0 | 852 | $1,299 | $1.52 | 13d | 1 | 1.21mi |
| 200 S Union St Kennewick, WA | 2.0 | 1.0–1.5 | 860 | $1,348 | $1.57 | 13d | 2 | 1.29mi |
| 5207 W Hildebrand Blvd Kennewick, WA | 2.0 | 1.0 | 656 | $2,380 | $3.63 | 43d | 17 | 1.31mi |
| 119 S Conway Pl Kennewick, WA | 2.0 | 1.0 | 711 | $1,200 | $1.69 | 20d | 1 | 1.32mi |
| 4108 W Albany Ave Unit A-D Kennewick, WA | 2.0 | 1.5 | 945 | $1,395 | $1.48 | 43d | 1 | 1.34mi |
| 1608 W 14th Ave Unit 1614 Kennewick, WA | 2.0 | 1.0 | 750 | $995 | $1.33 | 20d | 1 | 1.38mi |
| 1702 W 7th Pl Unit B Kennewick, WA | 2.0 | 1.0 | 950 | $1,050 | $1.11 | 43d | 1 | 1.48mi |
| 1618 W 7th Pl Unit A Kennewick, WA | 2.0 | 1.0 | 920 | $1,050 | $1.14 | 43d | 1 | 1.49mi |
| 9 N Waverly Pl Kennewick, WA | 1.0 | 1.0 | 600 | $1,222 | $2.04 | 13d | 2 | 1.50mi |
Listing history 20 events
-
2026-06-18days on market $69,000 Active 360 DOM
-
2026-06-17days on market $69,000 Active 359 DOM
-
2026-06-16days on market $69,000 Active 358 DOM
-
2026-06-15days on market $69,000 Active 357 DOM
-
2026-06-14days on market $69,000 Active 355 DOM
-
2026-06-13days on market $69,000 Active 354 DOM
-
2026-06-10days on market $69,000 Active 352 DOM
-
2026-06-09days on market $69,000 Active 351 DOM
-
2026-06-08days on market $69,000 Active 350 DOM
-
2026-06-07days on market $69,000 Active 349 DOM
-
2026-06-05days on market $69,000 Active 346 DOM
-
2026-06-03days on market $69,000 Active 345 DOM
-
2026-06-02days on market $69,000 Active 344 DOM
-
2026-06-01days on market $69,000 Active 343 DOM
-
2026-05-31days on market $69,000 Active 342 DOM
-
2026-05-30days on market $69,000 Active 341 DOM
-
2025-12-02price $69,000 582-char remark
Show marketing remark (582 chars)
MLS# 285245 Charming MFH that has been completely updated inside and waiting for new owner. This home has lots of natural daylight and has been recently painted inside and out. Some of the updates are that all new flooring throughout the entire home along with updated fixtures. There are also vinyl windows along with a new roof. Home sits on a large lot with lots of potential. There is a new wood deck to enjoy the summer evenings on. Great location near shopping, restaurants and so much more. Owner is willing to carry contract with large down payment. Call broker for details.
-
2025-06-24$79,000 Active 582-char remark
Show marketing remark (582 chars)
MLS# 285245 Charming MFH that has been completely updated inside and waiting for new owner. This home has lots of natural daylight and has been recently painted inside and out. Some of the updates are that all new flooring throughout the entire home along with updated fixtures. There are also vinyl windows along with a new roof. Home sits on a large lot with lots of potential. There is a new wood deck to enjoy the summer evenings on. Great location near shopping, restaurants and so much more. Owner is willing to carry contract with large down payment. Call broker for details.
-
2025-02-07price $90,000
-
2024-09-19$74,000 Active
ⓘ Source: listings_history table (triggers on properties + properties_extension) + one-shot
backfill from property_details.listing_events for pre-trigger history.
Tax reassessment forecast WA · Resets to sale price
- Current annual tax
- $179 · $15/mo
- Projected year-2 tax
- $676 · $56/mo
- Expected delta
- +$497/yr (+$41/mo · 277.0%)
ⓘ Screening estimate from a state-policy table — verify with the county assessor before closing.
Climate risk First Street
- Flood 1/10 Low 0% chance over 30 yrs
- Wildfire 4/10 Moderate
- Heat 4/10 Moderate 6 d/yr ≥99°F today · 13 d/yr by 30 yrs out
- Wind 1/10 Low
- Air quality 8/10 Severe 14 unhealthy d/yr today · 15 by 30 yrs out
Nearby sold comps map
Loading sold comps map…
Walkable amenities ~0.75 mi
Loading nearby amenities…
Taxation est. · year 1
- Rental income
- $18,528
- − Mortgage interest
- −$3,865
- − Property taxes
- −$179
- − Insurance
- −$345
- − Repairs & maintenance
- −$1,482
- − Management
- −$1,482
- − Depreciation
- −$2,007
- Taxable income
- $9,167
- Est. tax owed @ 24.0%
- −$2,200
- After-tax cash flow
- $7,570/yr
For passive investors: Depreciation is non-cash, so a rental often shows a tax loss while cash-flowing — sheltering income. Rental losses are passive: they offset passive income freely, and up to $25,000/yr can offset ordinary (W-2) income if you actively participate and your MAGI is under $100k (phasing out to $0 by $150k); unused losses carry forward. On sale, claimed depreciation is recaptured at up to 25%, and gains may owe capital-gains tax (a 1031 exchange can defer both). Figures are a year-1 estimate at your 24.0% rate — not tax advice; consult a CPA.
Condition & rehab AI · 12 photos
This single-family home has been completely updated inside and out, with new flooring, fixtures, and a new roof. It's move-in ready with a good condition score and potential for further value through landscaping and interior paint.
Value-add opportunities
- Both landscaping — improves curb appeal and adds value
- Both interior paint — fresh paint enhances curb appeal and interior aesthetics
- Both landscaping and curb appeal — enhances overall property value and appeal
Renovation cost estimate screening
Value-add ROI direction
- Both landscaping — improves curb appeal and adds value ↑
- Both interior paint — fresh paint enhances curb appeal and interior aesthetics ↑
- Both landscaping and curb appeal — enhances overall property value and appeal ↑
ⓘ Cost ranges are severity-bucket heuristics (US national rule-of-thumb). Get contractor quotes + a written scope before underwriting a rehab budget.
Schools (NCES district)
- District
- Kennewick School District
- NCES district ID
- 5303930
- Math proficiency
- 43% ▼ -1.00%
- Reading proficiency
- 58% ▬ 0.00%
- Median HH income
- $54,191
- Composite
- 45.56/100
- National rank
- #5667
- State rank
- #141 of 291 in WA
Livability — Kennewick
- Score
- 78/100
- State rank
- #131
- US rank
- #2599
Category grades
Schools grade is shown separately in the Schools card above.
Census & demographics
- Census place
- Kennewick, WA
- County
- Benton County · 186,895 people
- City population
- 104,655
- Metro
- Kennewick-Richland, WA
- Population (ZIP)
- 20,633
- Household income
- $111,042
- Rent vs Own
- Severe rent burden
- 281.0
Population outlook (Benton County) Hauer SSP2
- Today (2025)
- 219,421 people
- By 2030
- 233,813 · +6.6%
- By 2040
- 262,134 · +19.5%
- By 2050
- 290,100 · +32.2%
- By 2075
- 363,525 · +65.7%
- By 2100
- 418,667 · +90.8%
Race, ethnicity, and origin ACS 2023
- Neighborhood character
- Predominantly White (74%)
- Race & ethnicity
- White 74% Hispanic / Latino 16% Two or more races 10% Black 2% Asian 2%
- Hispanic origin (detail)
- Mexican 15%
- Common ancestry
- Portuguese 3% Slovak 3% Iranian 2%
- Foreign-born
- 9% · Canada
- Languages at home
- 83% English-only · Spanish 10% Arabic 2% Other Indo-European 1%
Political lean MEDSL · Benton
- 2024 margin
- Strong R (+21.9) · D 37.7% · R 59.6% · Other 2.7%
- 2008→2024 swing
- +4.2pp toward D · 2008: -26.1pp · 2024: -21.9pp
- All cycles
- 2024: R+21.9 2020: R+21.0 2016: R+26.6 2012: R+27.0 2008: R+26.1
Not yet ingested
- Civics
- —
Market trends
- HPI YoY
- ▼ -167.63%
- Current HPI
- 229.7474
- Rent YoY
- —
- Metro
- Kennewick-Richland, WA
- State GDP YoY
- ▲ 4.65%
- F500 in state
- 22
Industry mix (Fortune 500 HQ in WA)
| Industry | F500 HQs | Revenue |
|---|---|---|
| Retail | 2 | $269B |
|
||
| Technology / Retail | 1 | $638B |
|
||
| Technology | 1 | $245B |
|
||
| Telecommunications | 1 | $38B |
|
||
| Food / Beverage | 1 | $36B |
|
||
| Automotive / Trucks | 1 | $34B |
|
||
Price history
-6.8% since first listed4 events — show timeline
- 2025-12-02 Price Changed $69,000 PACMLS
- 2025-06-24 Listed $79,000 PACMLS
- 2025-02-07 Price Changed $90,000 PACMLS
- 2024-09-19 Listed $74,000 PACMLS
Property tax history
-2.7%/yrLatest (2026): $179 · -5.7% YoY. Source: county tax records.
Cash-flow waterfall
monthlySold comps — $/sqft
last 12 mo · ≤1 miLoading sold comps…