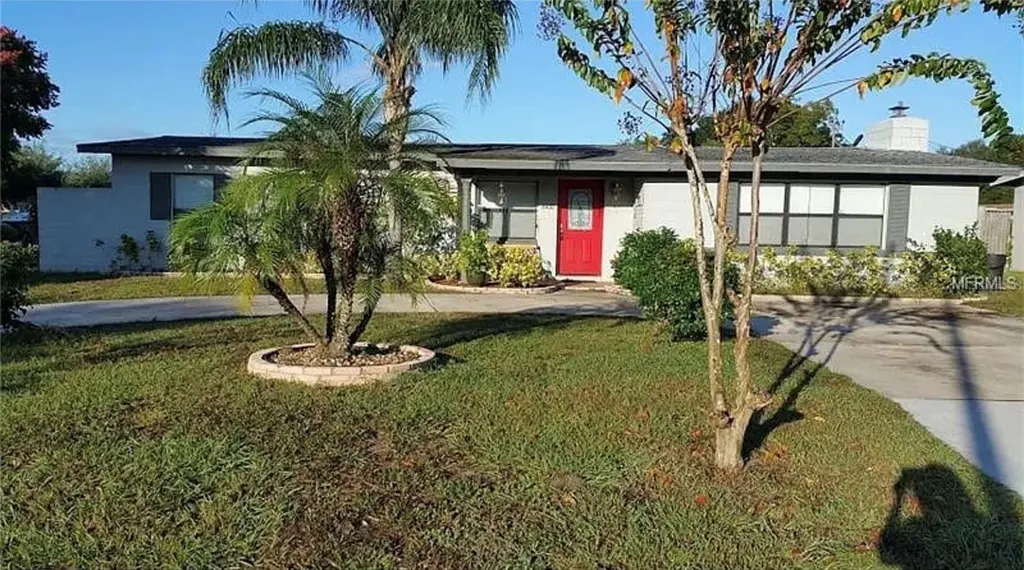
6400 Ramir Rd · Lockhart, FL
Flood risk 1/10 · Minimal
- FEMA flood zone
- X (unshaded)
- Chance of flooding over 30 yrs
- 0.0%
- Est. flood insurance / yr
- $507 – $1,088
Fire risk 1/10 · Minimal
- Est. fire insurance / yr
- $947 – $1,759
Heat risk 9/10 · Severe
- Hot days now (above 108°F)
- 7 days/yr
- Hot days in 30 yrs
- 23 days/yr
Wind risk 9/10 · Severe
- Chance of severe wind over 30 yrs
- 99.0%
Air-quality risk 2/10 · Minimal
- Unhealthy air days now
- 0 days/yr
- Unhealthy air days in 30 yrs
- 1 days/yr
Risk factors via First Street. Map © Google.
Why this score? — see what drove the D grade
The composite is a weighted blend of 9 inputs, each scored 0–100. Each bar is that input's sub-score; the figure is the points it added to the 100-point composite (weight × sub-score).
- Cash flow +14.0/30.0
- ARV discount +7.5/15.0
- 1% rule +4.8/10.0
- DSCR +4.2/10.0
- Schools +4.1/10.0
- Livability +3.8/5.0
- Rent growth +2.6/5.0
- Condition / age +2.5/5.0
- Appreciation +0.0/10.0
$225,000
🖨 Deal sheet (PDF) 📄 Offer letter ✓ Due diligence
Listing remarks MLS
Beautiful 3BR, 2.5BA pool home that was completely remodeled in 2009. Home features granite counter tops, black Maytag appliances, 18 inch tile, split floor plan, recessed lighting, fireplace, Gerber toilets, Moen fixtures, ceiling fans, updated electrical and plumbing, 30 year architectural shingles (roof installed 2005), updated windows, Carrier A/C, Hayward pool pump, outside shower, circular drive, fenced backyard, & storage building. Convenient location near I-4 and Maitland Blvd/FL-414. Home does need some fresh paint.
Key facts
- Single-story layout
- Private pool
- Tile flooring
Tags
Property features AI
Finance
- Other: Zoned R-1
- HOA & community: No association (no HOA)
Exterior
- Utilities: Public water; Public sewer; Electricity connected
- Home design: Single family residence; One-story; Faces east; Completed condition; Homestead exempt
- Construction: Stucco construction; Shingle roof; Slab foundation; Built on 0.2 acre lot
- Exterior features: Sidewalk; In-ground pool and spa
Interior
- Kitchen: Range; Refrigerator
- Bedrooms: 3 bedrooms
- Flooring: Vinyl flooring
- Bathrooms: 1 full bathroom; 1 half bathroom
- Heating & cooling: Central heating; Central air conditioning
- Interior features: Kitchen/family room combo; Split bedroom floorplan
- Laundry & utility: Laundry inside the home
Neighborhood map
What this means for you Summary
Snapshot
- This is a 3-bed/2.0-bath single-family listed at $225k.
Deal economics
- At list price, monthly cash flow is $29 ($345/yr) — positive.
- The deal already cash-flows at list — no discount required.
- To meet the 1% rule (rent ≥ 1% of price), the offer needs to be $220k (2.0% below list).
- Recommended offer: $220k (2.0% below list) — sets the bar for 1% rule.
- Cap rate 6.4% vs local median 4.4% in Lockhart — top-decile yield for the area; either an underpriced asset or a hidden risk that comps aren't pricing in. Stress-test before assuming the spread holds.
Location & tenants
- Location reads 76/100 on livability (#228 in FL, #3,605 nationally) — a middle-class / working-renter tenant base. Strengths: commute A+, cost of living A+, housing A+; Watch: amenities F, health & safety F.
- Orange (suburban): math 46% / reading 51% proficiency, ranked #43 of 73 in FL (top 59%) — families likely to look elsewhere, expect single-tenant / working-renter base with shorter leases.
- Zoned schools: Riverside Elementary (math 34% / reading 33%, grade F, #1,758 of 2,144 statewide, top 83%, 540 students, 72% FRL); Lockhart Middle (math 31% / reading 32%, grade F, #453 of 571 statewide, top 81%, 790 students, 76% FRL); Wekiva High (math 17% / reading 37%, grade F, #478 of 667 statewide, top 73%, 2,207 students, 62% FRL).
- Zoned-school proficiency averages 31% at this address vs 48% district-wide (-18 pts) — the specific schools serving this property underperform the Orange average; the district grade overstates school quality for this exact location.
- Market conditions: Rents flat; 160 active listings in the ZIP; 10 comparable units currently listed for rent nearby; rentals at typical pace (median 22d on market — plan ~3-4 weeks tenant-placement turnaround); 8,053 units permitted in Orange County in 2024 (3,133 in 5+ unit buildings).
Forward outlook
- Local home prices are declining (-3.0%/yr); year-one equity from $2k of loan paydown is wiped out by about $7k of value loss. Plan a longer hold.
- Orange County population projected at +52% by 2050 — long-run rental-demand tailwind backs the buy-and-hold thesis.
Negotiation context
- Only 1 days on market — expect competitive offers; lowballing is unlikely to land.
- 6 sale attempts since 20y ago with the ask held roughly flat each time — persistent listings suggest the price (not the market) is what's stuck; bring a comps-based counter.
- Current owner paid $155k; 45% above their basis — modest negotiation headroom, anchor on the comps not their cost.
Risks & watch-outs
- Watch-outs: built in 1958 — expect roof / HVAC / electrical / plumbing capex.
- Climate carrying-cost: severe wind risk, 99% chance of damaging wind over 30y; extreme-heat days projected 7→23/yr by 2055 (HVAC capex compounding) — expect insurance premiums to compound above CPI over the hold.
Questions for the listing agent
- Built in 1958 — when were the roof, HVAC, electrical panel, plumbing, and water heater last replaced?
- Is there a deadline driving the sale (1031 exchange, divorce, estate, relocation)? That informs how much negotiation room exists.
- The area grade is low — what's the realistic commute time and amenity access for the typical tenant pool here? Any planned neighborhood developments (good or bad) we should know about?
- What's the average days-on-market for RENTAL listings here right now (not sales)? A rising rental-DOM trend means longer vacancies and softer asking-rent achievability than the comps imply.
- What's the recent tenant-quality profile in this submarket — average credit score on applications, eviction rate, late-payment / NSF rate, and stable-employment percentage? A property-management company in the area should have these aggregated.
- How much new for-sale + rental construction is in the pipeline within 1–3 miles? Heavy new supply typically softens prices + rents 12–24 months out; constrained supply supports both.
Investment metrics
- 1% rule
- 0.98% ✗
- Cap rate
- 6.45%
- Cash-on-cash
- 0.55%
- DSCR
- 1.02
- GRM
- 8.5
CMA / ARV
No comps found within radius.
Projected returns pro-forma
-3.0% appreciation · 0.5% rent growth · sell at horizon
- IRR
- -18.5%
- Equity multiple
- 0.37×
- Total profit
- $-39,907
- Equity at exit
- $33,548
- IRR
- -17.5%
- Equity multiple
- 0.16×
- Total profit
- $-52,976
- Equity at exit
- $19,454
Cash invested: $63,000 (down + closing). Projections, not guarantees.
Landlord ↔ Tenant lean methodology
- Overall (STATE)
- 87 Strongly Landlord-Friendly
- State Florida
- 87 Strongly Landlord-Friendly · R+3
- County
- — inherits STATE
- City
- — inherits STATE
ZIP-level market 32810
- Home prices YoY
- -18.5%
- Rents YoY
- 0.5%
- Active inventory
- 160
- Price-to-rent
- 8.5×
Monthly cashflow live
- Estimated rent
- $2,204 high interval (Pro) →
- Mortgage (P&I)
- −$1,180
- Tax from tax record
- −$439 /mo · $5,266/yr
- Insurance
- −$94
- HOA
- −$0
- Vacancy / Maint / Mgmt
- −$463
- Net cashflow
- $29
Break-even live
Sensitivity live
| Price | -10% $156 | -5% $92 | +0% $29 | +5% $-35 | +10% $-99 |
|---|---|---|---|---|---|
| Rent | -10% $-145 | -5% $-58 | +0% $29 | +5% $116 | +10% $203 |
| Rate | -1.0pp $142 | -0.5pp $86 | base $29 | +0.5pp $-30 | +1.0pp $-89 |
UW: 25.0% down · 7.5% · 30yr · 1.5% tax · 5.0% vac · 8.0% maint · 8.0% mgmt
Financing live
Cash to close
- Down payment
- $56,250
- Closing costs
- $6,750
- Reserves months
- —
- Total cash needed
- —
Loan-product check · same deal, 3 products live
Conventional
25% down · 7.5% · 30yr
- Down + closing
- —
- Monthly P&I
- —
- Monthly cashflow
- —
- DSCR
- —
- Eligible?
- —
Personal DTI + credit; lowest rate.
DSCR
20% down · 8.5% · 30yr
- Down + closing
- —
- Monthly P&I
- —
- Monthly cashflow
- —
- DSCR
- —
- Eligible?
- —
No personal income docs; deal must DSCR.
Hard money
10% down · 12.0% · 12mo
- Down + closing
- —
- Monthly P&I
- —
- Monthly cashflow
- —
- DSCR
- —
- Eligible?
- —
Short-term bridge; refi at stabilization.
Rent comps 10 comps
| Address | Beds | Baths | Sqft | Rent | $/sqft | DOM | Units | Dist |
|---|---|---|---|---|---|---|---|---|
| 4437 Cluster Dr Orlando, FL | 3.0 | 3.0 | 1518 | $2,495 | $1.64 | 25d | 1 | 0.39mi |
| 4414 Cluster Dr #4414 Orlando, FL | 2.0 | 2.5 | 1444 | $1,800 | $1.25 | 25d | 1 | 0.39mi |
| 5224 Long Rd Orlando, FL | 2.0–4.0 | 1.5–2.5 | 1426 | $1,754 | $1.23 | 0d | 16 | 0.63mi |
| 5410 Old Oak Tree Dr Orlando, FL | 3.0 | 2.0 | 1627 | $2,100 | $1.29 | 22d | 1 | 0.73mi |
| 5061 Barnegat Point Rd Orlando, FL | 4.0 | 2.0 | 1712 | $2,400 | $1.40 | 23d | 1 | 1.16mi |
| 5420 Blue Grass St Orlando, FL | 3.0 | 2.0 | 1544 | $2,140 | $1.39 | 9d | 1 | 1.17mi |
| 5419 Stirrup Way Orlando, FL | 3.0 | 2.0 | 1420 | $2,000 | $1.41 | 25d | 1 | 1.27mi |
| 5412 Ashmeade Rd Orlando, FL | 3.0 | 2.0 | 1587 | $2,320 | $1.46 | 18d | 1 | 1.48mi |
| 2200 Flagler Promenade Way Maitland, FL | 1.0–3.0 | 1.0–2.0 | 1093 | $2,729 | $2.50 | 0d | 21 | 1.49mi |
| 4442 Park Eden Cir Orlando, FL | 4.0 | 2.5 | 2266 | $3,000 | $1.32 | 18d | 1 | 1.50mi |
Listing history 3 events
-
2026-06-15status $225,000 Pending 1 DOM
-
2026-06-13remarks 693-char remark
-
2026-06-13$225,000 Active 1 DOM
ⓘ Source: listings_history table (triggers on properties + properties_extension) + one-shot
backfill from property_details.listing_events for pre-trigger history.
Tax reassessment forecast FL · Resets to sale price
- Current annual tax
- $5,266 · $439/mo
- Projected year-2 tax
- $5,266 · $439/mo
- Expected delta
- $0/yr ($0/mo · 0.0%)
ⓘ Screening estimate from a state-policy table — verify with the county assessor before closing.
Climate risk First Street
- Flood 1/10 Low FEMA zone X (unshaded) · 0% chance over 30 yrs
- Wildfire 1/10 Low
- Heat 9/10 Extreme 7 d/yr ≥108°F today · 23 d/yr by 30 yrs out
- Wind 9/10 Extreme 99% chance of damaging wind over 30 yrs
- Air quality 2/10 Low 0 unhealthy d/yr today · 1 by 30 yrs out
Nearby sold comps map
Loading sold comps map…
Walkable amenities ~0.75 mi
Loading nearby amenities…
Taxation est. · year 1
- Rental income
- $26,450
- − Mortgage interest
- −$12,603
- − Property taxes
- −$5,266
- − Insurance
- −$1,125
- − Repairs & maintenance
- −$2,116
- − Management
- −$2,116
- − Depreciation
- −$6,545
- Taxable loss
- −$3,322
- Est. tax savings @ 24.0%
- +$797
- After-tax cash flow
- $1,142/yr
For passive investors: Depreciation is non-cash, so a rental often shows a tax loss while cash-flowing — sheltering income. Rental losses are passive: they offset passive income freely, and up to $25,000/yr can offset ordinary (W-2) income if you actively participate and your MAGI is under $100k (phasing out to $0 by $150k); unused losses carry forward. On sale, claimed depreciation is recaptured at up to 25%, and gains may owe capital-gains tax (a 1031 exchange can defer both). Figures are a year-1 estimate at your 24.0% rate — not tax advice; consult a CPA.
Schools (NCES district)
- District
- Orange
- NCES district ID
- 1201440
- Math proficiency
- 46% ▼ -9.00%
- Reading proficiency
- 51% ▼ -2.00%
- Median HH income
- $49,350
- Composite
- 41.47/100
- National rank
- #3461
- State rank
- #43 of 73 in FL
Livability — Lockhart
- Score
- 76/100
- State rank
- #228
- US rank
- #3605
Category grades
Schools grade is shown separately in the Schools card above.
Census & demographics
- Census place
- Lockhart, FL
- County
- Orange County · 1,471,359 people
- City population
- 37,127
- Metro
- Orlando-Kissimmee-Sanford, FL
- Population (ZIP)
- 36,927
- Household income
- $60,799
- Rent vs Own
- Severe rent burden
- 1859.0
Population outlook (Orange County) Hauer SSP2
- Today (2025)
- 1,618,226 people
- By 2030
- 1,787,404 · +10.5%
- By 2040
- 2,125,621 · +31.4%
- By 2050
- 2,454,016 · +51.6%
- By 2075
- 3,173,711 · +96.1%
- By 2100
- 3,607,781 · +122.9%
Race, ethnicity, and origin ACS 2023
- Neighborhood character
- Highly diverse neighborhood (Simpson 0.72)
- Race & ethnicity
- Black 35% Hispanic / Latino 29% White 25% Two or more races 16% Asian 3% Native American 1%
- Hispanic origin (detail)
- Mexican 2% Puerto Rican 17% Cuban 3%
- Common ancestry
- Hispanic 9% Lithuanian 1% Slovak 1%
- Foreign-born
- 19% · Canada, Vietnam, Jamaica
- Languages at home
- 67% English-only · Spanish 21% French/Haitian/Cajun 7% Other Indo-European 1%
Political lean MEDSL · Orange
- 2024 margin
- D (+13.6) · D 56.1% · R 42.5% · Other 1.3%
- 2008→2024 swing
- -5.0pp toward R · 2008: 18.6pp · 2024: 13.6pp
- All cycles
- 2024: D+13.6 2020: D+23.1 2016: D+24.6 2012: D+18.2 2008: D+18.6
Not yet ingested
- Civics
- —
Market trends
- HPI YoY
- ▼ -78.77%
- Current HPI
- 347.7447
- Rent YoY
- ▲ 0.50%
- Metro
- Orlando-Kissimmee-Sanford, FL
- State GDP YoY
- ▲ 3.28%
- F500 in state
- 36
Industry mix (Fortune 500 HQ in FL)
| Industry | F500 HQs | Revenue |
|---|---|---|
| Industrial Technology | 2 | $29B |
|
||
| Insurance | 2 | $17B |
|
||
| Retail | 1 | $60B |
|
||
| Technology Distribution | 1 | $58B |
|
||
| Homebuilding | 1 | $35B |
|
||
| Technology Manufacturing | 1 | $35B |
|
||
Price history
+435.7% since first listed17 events — show timeline
- 2026-06-12 Listed $225,000 Stellar MLS as Distributed by MLS Grid
- 2015-12-16 Sold (Public Records) $155,000 Public Records
- 2015-12-11 Sold (MLS) $155,000 Stellar MLS as Distributed by MLS Grid
- 2015-11-23 Pending — Stellar MLS as Distributed by MLS Grid
- 2015-10-30 Listed $158,000 Stellar MLS as Distributed by MLS Grid
- 2011-05-16 Sold (Public Records) $87,000 Public Records
- 2011-05-10 Sold (MLS) $87,000 Stellar MLS as Distributed by MLS Grid
- 2010-08-30 Listed $90,000 Stellar MLS as Distributed by MLS Grid
- 2007-04-09 Listed $259,000 Stellar MLS as Distributed by MLS Grid
- 2006-10-06 Sold (Public Records) $225,000 Public Records
- 2006-10-02 Sold (MLS) $225,000 Stellar MLS as Distributed by MLS Grid
- 2006-09-12 Listed $225,000 Stellar MLS as Distributed by MLS Grid
- 2006-07-31 Sold (MLS) $154,000 Stellar MLS as Distributed by MLS Grid
- 2006-07-28 Sold (Public Records) $154,000 Public Records
- 2006-07-10 Listed $154,000 Stellar MLS as Distributed by MLS Grid
- 1996-06-21 Sold (Public Records) $77,000 Public Records
- 1996-05-17 Sold (Public Records) $42,000 Public Records
Property tax history
+13.3%/yrLatest (2025): $5,266 · +8.6% YoY. Source: county tax records.
Cash-flow waterfall
monthlySold comps — $/sqft
last 12 mo · ≤1 miLoading sold comps…