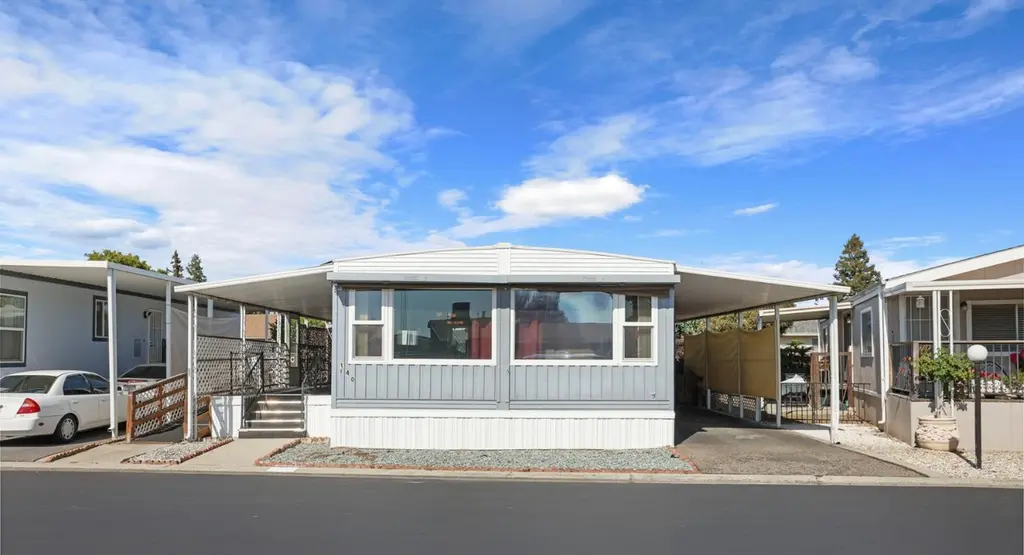
2505 Jackson Ave #140 · Escalon, CA
Flood risk 3/10 · Minor
- FEMA flood zone
- X (unshaded)
- Chance of flooding over 30 yrs
- 0.2%
- Est. flood insurance / yr
- $507 – $1,088
Fire risk 7/10 · Major
- Est. fire insurance / yr
- $659 – $1,223
Heat risk 6/10 · Moderate
- Hot days now (above 103°F)
- 7 days/yr
- Hot days in 30 yrs
- 15 days/yr
Wind risk 1/10 · Minimal
- Chance of severe wind over 30 yrs
- —
Air-quality risk 10/10 · Severe
- Unhealthy air days now
- 28 days/yr
- Unhealthy air days in 30 yrs
- 32 days/yr
Risk factors via First Street. Map © Google.
Why this score? — see what drove the C+ grade
The composite is a weighted blend of 9 inputs, each scored 0–100. Each bar is that input's sub-score; the figure is the points it added to the 100-point composite (weight × sub-score).
- Cash flow +30.0/30.0
- 1% rule +10.0/10.0
- DSCR +10.0/10.0
- Schools +3.2/10.0
- Livability +2.8/5.0
- Rent growth +2.5/5.0
- Condition / age +2.5/5.0
- ARV discount +0.0/15.0
- Appreciation +0.0/10.0
$105,000
🖨 Deal sheet 📄 Offer letter ✓ Due diligence
Listing remarks
Welcome Home to this beautifully maintained 2-bedroom, 2-bath residence located in the highly desirable Almond Grove Mobile Home Park, a well-established 55+ community. Ideally situated directly across from the clubhouse, this home offers both comfort and convenience within a peaceful community setting. Over the years, the property has benefited from numerous improvements and updates, including upgraded windows, flooring, appliances, deck improvements, skirting, and both interior and exterior paint enhancements. In January 2022, the roof was professionally pressure washed, seams and cracks were scraped and resealed, and flashing areas were refreshed to support long-term maintenance and dura
Key facts
- Parking
- Built 1968
- Listed 41 days
Property features AI
Finance
- Financial info: Land lease: yes, $977 per period
- HOA & community: No homeowners association; Senior community
Exterior
- Parking: Attached parking
- Utilities: Public water; Sewer: other; Cable available; Individual electric meter; Individual gas meter; 220V in laundry
- Home design: Manufactured in park (double wide); Built in 1968
- Construction: Vinyl skirting; Other roof; Manufacturer: VIKING EDGEWOOD; Make: VIKING
- Exterior features: Backyard; Close to clubhouse; Storage shed(s)
Interior
- Kitchen: Dishwasher; Microwave; Double oven; Electric cooktop; Hood over range
- Bedrooms: 2 bedrooms (including master bedroom)
- Flooring: Carpet; Vinyl
- Bathrooms: 2 full bathrooms with tub/shower over and separate shower stall(s)
- Heating & cooling: Central heating; Central air; Ceiling fans
- Interior features: Great room living area; Porch; Pantry closet; Laminate counters; Storage area
- Laundry & utility: Laundry in kitchen
Neighborhood map
What this means for you Summary
Snapshot
- This is a 2-bed/2.0-bath manufactured listed at $105k.
Deal economics
- At list price, monthly cash flow is $534 ($6k/yr) — positive.
- The deal already cash-flows at list — no discount required.
- Meets the 1% rule at list price ($2k rent vs $105k).
- Recommended offer: $102k (3.0% below list) — sets the bar for market timing.
- Cap rate 12.4% vs local median 3.0% in Escalon — top-decile yield for the area; either an underpriced asset or a hidden risk that comps aren't pricing in. Stress-test before assuming the spread holds.
Location & tenants
- Location reads 55/100 on livability (#847 in CA) — a working-class tenant base; expect higher turnover. Strengths: housing A-; Watch: schools C-, crime C-, amenities F.
- Escalon Unified (town): math 27% / reading 45% proficiency, ranked #258 of 517 in CA (top 50%) — families likely to look elsewhere, expect single-tenant / working-renter base with shorter leases.
- Market conditions: 50 active listings in the ZIP; 2 comparable units currently listed for rent nearby; 3,779 units permitted in San Joaquin County in 2024 (0 in 5+ unit buildings).
Forward outlook
- Local home prices are declining (-3.0%/yr); year-one equity from $726 of loan paydown is wiped out by about $3k of value loss. Plan a longer hold.
- San Joaquin County population projected at +17% by 2050 — long-run rental-demand tailwind backs the buy-and-hold thesis.
- At projected returns (-3.0% appreciation + 3.0% rent growth), your $29k cash investment doubles in ~6 years — after that, you're playing with house money.
Negotiation context
- It's been on market 41 days — a 3% lower offer ($102k) is reasonable based on typical stale-listing flexibility.
Risks & watch-outs
- Climate carrying-cost: major wildfire risk; extreme-heat days projected 7→15/yr by 2055 (HVAC capex compounding) — expect insurance premiums to compound above CPI over the hold.
Questions for the listing agent
- It's been on market 41 days. Have you received any prior offers? Is the seller open to a 3% concession, seller financing, or rate buy-down credit?
- Built in 1968 — when were the roof, HVAC, electrical panel, plumbing, and water heater last replaced?
- Is there a deadline driving the sale (1031 exchange, divorce, estate, relocation)? That informs how much negotiation room exists.
- What's the average days-on-market for RENTAL listings here right now (not sales)? A rising rental-DOM trend means longer vacancies and softer asking-rent achievability than the comps imply.
- What's the recent tenant-quality profile in this submarket — average credit score on applications, eviction rate, late-payment / NSF rate, and stable-employment percentage? A property-management company in the area should have these aggregated.
- How much new for-sale + rental construction is in the pipeline within 1–3 miles? Heavy new supply typically softens prices + rents 12–24 months out; constrained supply supports both.
Investment metrics
- 1% rule
- 1.52% ✓
- Cap rate
- 12.40%
- Cash-on-cash
- 21.81%
- DSCR
- 1.97
- GRM
- 5.5
CMA / ARV
- ARV (on-the-fly)
- $79,520
- Comps found
- 5
Show comp detail 5 sales within ~0.75 mi
| Address | Dist | Beds/Ba | Sqft | Sold | Price | $/sf | Match |
|---|---|---|---|---|---|---|---|
| 2505 Jackson Ave #123 | 0.00mi | 2/2.0 | 1,120 (0%) | 15mo | $40,000 | $36 | 87 |
| 2505 Jackson Ave #136 | 0.00mi | 2/2.0 | 1,232 (+10%) | 3mo | $99,900 | $81 | 81 |
| 2505 Jackson #193 | 0.00mi | 2/2.0 | 1,248 (+11%) | 1mo | $35,000 | $28 | 80 |
| 2505 Jackson Ave #186 | 0.04mi | 1/2.0 (-1) | 1,056 (-6%) | 12mo | $75,000 | $71 | 74 |
| 2505 Jackson Ave #175 | 0.00mi | 2/2.0 | 1,272 (+14%) | 15mo | $96,000 | $75 | 65 |
Match score weights: distance 35% · size 25% · config 20% · recency 20%. Top-matched comps best support the ARV.
Projected returns pro-forma
-3.0% appreciation · 3.0% rent growth · sell at horizon
- IRR
- 14.5%
- Equity multiple
- 1.58×
- Total profit
- $17,039
- Equity at exit
- $15,656
- IRR
- 23.2%
- Equity multiple
- 3.00×
- Total profit
- $58,754
- Equity at exit
- $9,078
Cash invested: $29,400 (down + closing). Projections, not guarantees.
Landlord ↔ Tenant lean methodology
- Overall (STATE)
- 18 Strongly Tenant-Friendly
- State California
- 18 Strongly Tenant-Friendly · D+13
- County
- — inherits STATE
- City
- — inherits STATE
ZIP-level market 95320
- Active inventory
- 50
- Price-to-rent
- 5.5×
Monthly cashflow live
- Estimated rent
- $1,595 medium interval (Pro) →
- Mortgage (P&I)
- −$551
- Tax est. 1.5%
- −$131 /mo · $1,575/yr
- Insurance
- −$44
- HOA
- −$0
- Vacancy / Maint / Mgmt
- −$335
- Net cashflow
- $534
Break-even live
UW: 25.0% down · 7.5% · 30yr · 1.5% tax · 5.0% vac · 8.0% maint · 8.0% mgmt
Financing live
Cash to close
- Down payment
- $26,250
- Closing costs
- $3,150
- Reserves months
- —
- Total cash needed
- —
Loan-product check · same deal, 3 products live
Conventional
25% down · 7.5% · 30yr
- Down + closing
- —
- Monthly P&I
- —
- Monthly cashflow
- —
- DSCR
- —
- Eligible?
- —
Personal DTI + credit; lowest rate.
DSCR
20% down · 8.5% · 30yr
- Down + closing
- —
- Monthly P&I
- —
- Monthly cashflow
- —
- DSCR
- —
- Eligible?
- —
No personal income docs; deal must DSCR.
Hard money
10% down · 12.0% · 12mo
- Down + closing
- —
- Monthly P&I
- —
- Monthly cashflow
- —
- DSCR
- —
- Eligible?
- —
Short-term bridge; refi at stabilization.
Rent comps 2 comps
| Address | Beds | Baths | Sqft | Rent | $/sqft | DOM | Units | Dist |
|---|---|---|---|---|---|---|---|---|
| 2174 Coley Ave Apt 32 Escalon, CA | 2.0 | 1.0 | 950 | $1,650 | $1.74 | 14d | 1 | 0.26mi |
| 2174 Coley Ave Apt 34 Escalon, CA | 1.0 | 1.0 | 750 | $1,525 | $2.03 | 14d | 1 | 0.26mi |
Listing history 10 events
-
2026-06-18days on market $105,000 Active 41 DOM
-
2026-06-17days on market $105,000 Active 40 DOM
-
2026-06-16days on market $105,000 Active 39 DOM
-
2026-06-15days on market $105,000 Active 38 DOM
-
2026-06-14days on market $105,000 Active 36 DOM
-
2026-06-13days on market $105,000 Active 35 DOM
-
2026-06-10days on market $105,000 Active 33 DOM
-
2026-06-09days on market $105,000 Active 32 DOM
-
2026-06-09remarks 699-char remark
-
2026-06-09$105,000 Active 31 DOM
ⓘ Source: listings_history table (triggers on properties + properties_extension) + one-shot
backfill from property_details.listing_events for pre-trigger history.
Climate risk First Street
- Flood 3/10 Moderate FEMA zone X (unshaded) · 20% chance over 30 yrs
- Wildfire 7/10 Severe
- Heat 6/10 Major 7 d/yr ≥103°F today · 15 d/yr by 30 yrs out
- Wind 1/10 Low
- Air quality 10/10 Extreme 28 unhealthy d/yr today · 32 by 30 yrs out
Nearby sold comps map
Loading sold comps map…
Walkable amenities ~0.75 mi
Loading nearby amenities…
Taxation est. · year 1
- Rental income
- $19,138
- − Mortgage interest
- −$5,882
- − Property taxes
- −$1,575
- − Insurance
- −$525
- − Repairs & maintenance
- −$1,531
- − Management
- −$1,531
- − Depreciation
- −$3,055
- Taxable income
- $5,040
- Est. tax owed @ 24.0%
- −$1,210
- After-tax cash flow
- $5,202/yr
For passive investors: Depreciation is non-cash, so a rental often shows a tax loss while cash-flowing — sheltering income. Rental losses are passive: they offset passive income freely, and up to $25,000/yr can offset ordinary (W-2) income if you actively participate and your MAGI is under $100k (phasing out to $0 by $150k); unused losses carry forward. On sale, claimed depreciation is recaptured at up to 25%, and gains may owe capital-gains tax (a 1031 exchange can defer both). Figures are a year-1 estimate at your 24.0% rate — not tax advice; consult a CPA.
Schools (NCES district)
- District
- Escalon Unified
- NCES district ID
- 0612840
- Math proficiency
- 27% ▼ -9.00%
- Reading proficiency
- 45% ▼ -4.00%
- Median HH income
- $58,800
- Composite
- 31.95/100
- National rank
- #5844
- State rank
- #258 of 517 in CA
Livability — Escalon
- Score
- 55/100
- State rank
- #847
- US rank
- #23351
Category grades
Schools grade is shown separately in the Schools card above.
Census & demographics
- Census place
- Escalon, CA
- Population (ZIP)
- 13,511
Population outlook (San Joaquin County) Hauer SSP2
- Today (2025)
- 796,965 people
- By 2030
- 828,849 · +4.0%
- By 2040
- 885,611 · +11.1%
- By 2050
- 929,798 · +16.7%
- By 2075
- 994,578 · +24.8%
- By 2100
- 971,291 · +21.9%
Race, ethnicity, and origin ACS 2023
- Neighborhood character
- Predominantly White (66%)
- Race & ethnicity
- White 66% Hispanic / Latino 28% Two or more races 15%
- Hispanic origin (detail)
- Mexican 25%
- Common ancestry
- Russian 13% Iranian 5% Slovak 1%
- Foreign-born
- 11% · Canada
- Languages at home
- 79% English-only · Spanish 17% Other Indo-European 3%
Political lean MEDSL · San Joaquin
- 2024 margin
- Toss-up / Even · D 48.0% · R 48.9% · Other 3.0%
- 2008→2024 swing
- -11.6pp toward R · 2008: 10.7pp · 2024: -0.9pp
- All cycles
- 2024: R+0.9 2020: D+13.9 2016: D+12.9 2012: D+8.9 2008: D+10.7
Not yet ingested
- Civics
- —
Market trends
- HPI YoY
- ▼ -259.16%
- Current HPI
- 289.011
- Rent YoY
- —
- Metro
- —
- State GDP YoY
- ▲ 3.21%
- F500 in state
- 116
Industry mix (Fortune 500 HQ in CA)
| Industry | F500 HQs | Revenue |
|---|---|---|
| Technology | 27 | $1,492B |
|
||
| Financial Services | 3 | $174B |
|
||
| Retail | 3 | $44B |
|
||
| Insurance | 3 | $26B |
|
||
| Media / Entertainment | 2 | $115B |
|
||
| Pharmaceuticals / Biotech | 2 | $62B |
|
||
Cash-flow waterfall
monthlySold comps — $/sqft
last 12 mo · ≤1 miLoading sold comps…