 🏷️ Likely Rental
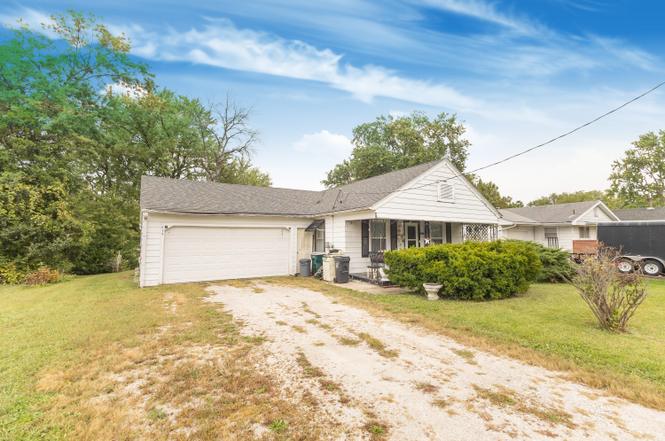
619 Madison Ave · Moberly, MO
Flood risk 1/10 · Minimal
- FEMA flood zone
- X (unshaded)
- Chance of flooding over 30 yrs
- 0.0%
- Est. flood insurance / yr
- $507 – $1,088
Fire risk 3/10 · Minor
- Est. fire insurance / yr
- $1,054 – $1,958
Heat risk 4/10 · Minor
- Hot days now (above 107°F)
- 7 days/yr
- Hot days in 30 yrs
- 17 days/yr
Wind risk 2/10 · Minimal
- Chance of severe wind over 30 yrs
- —
Air-quality risk 1/10 · Minimal
- Unhealthy air days now
- 0 days/yr
- Unhealthy air days in 30 yrs
- 0 days/yr
Risk factors via First Street. Map © Google.
Why this score? — see what drove the B+ grade
The composite is a weighted blend of 9 inputs, each scored 0–100. Each bar is that input's sub-score; the figure is the points it added to the 100-point composite (weight × sub-score).
- Cash flow +30.0/30.0
- ARV discount +15.0/15.0
- 1% rule +10.0/10.0
- DSCR +10.0/10.0
- Livability +3.9/5.0
- Schools +2.7/10.0
- Rent growth +2.5/5.0
- Condition / age +2.5/5.0
- Appreciation +0.0/10.0
$84,950
🖨 Deal sheet 📄 Offer letter ✓ Due diligence
Listing remarks MLS
Property has been rented by the same tenant for the last 20+ years and tenant wishes to remain. Currently rented for $500/month. Full, unfinished basement has additional bathroom. Attached two-car garage.
Key facts
- 9,796 sq ft lot
- 2 garage spots
- Built 1940
Property features AI
Finance
- Other: Property located on Madison Ave; directions: From Morley/Hwy 24 intersection go south on Morley to east on Madison Ave — property on the north side of the street
Exterior
- Parking: 2-car garage
- Utilities: Public water; Public sewer
- Home design: Single-family residential property; Residential property
- Construction: About 998 square feet of finished living area
- Exterior features: Garden; Shingle roof
Interior
- Kitchen: Electric range
- Heating & cooling: Central air conditioning; Forced air heating
- Interior features: Insulated windows; Full basement
Neighborhood map
What this means for you Summary
Snapshot
- This is a 3-bed/2.0-bath single-family listed at $85k.
Deal economics
- At list price, monthly cash flow is $536 ($6k/yr) — positive.
- The deal already cash-flows at list — no discount required.
- Meets the 1% rule at list price ($1k rent vs $85k).
- Recommended offer: $77k (9.0% below list) — sets the bar for market timing.
- Cap rate 13.9% vs local median 4.5% in Moberly — top-decile yield for the area; either an underpriced asset or a hidden risk that comps aren't pricing in. Stress-test before assuming the spread holds.
Location & tenants
- Location reads 77/100 on livability (#32 in MO, #3,045 nationally) — a middle-class / working-renter tenant base. Strengths: cost of living A+, housing A+, health & safety A+; Watch: employment D, schools D-, amenities F.
- Moberly (town): math 30% / reading 36% proficiency, ranked #246 of 324 in MO (top 76%) — families likely to look elsewhere, expect single-tenant / working-renter base with shorter leases.
- Market conditions: 134 active listings in the ZIP; 25 units permitted in Randolph County in 2024 (0 in 5+ unit buildings).
Forward outlook
- Local home prices are declining (-3.0%/yr); year-one equity from $588 of loan paydown is wiped out by about $3k of value loss. Plan a longer hold.
- Randolph County population projected at -10% by 2050 — secular population decline; favor cash flow + early exit over multi-decade hold.
- At projected returns (-3.0% appreciation + 3.0% rent growth), your $24k cash investment doubles in ~5 years — after that, you're playing with house money.
Negotiation context
- It's been on market 91 days — a 9% lower offer ($77k) is reasonable based on typical stale-listing flexibility.
- 8 sale attempts since 7y ago; this cycle's ask has dropped $25k (23%) from the opening price — seller is motivated, your offer sets the floor, not the list.
- Current owner paid $36k; list at $85k implies a 136% gain — meaningful room to come down on a strong offer.
Risks & watch-outs
- Watch-outs: built in 1940 — expect roof / HVAC / electrical / plumbing capex.
Questions for the listing agent
- It's been on market 91 days. Have you received any prior offers? Is the seller open to a 9% concession, seller financing, or rate buy-down credit?
- Built in 1940 — when were the roof, HVAC, electrical panel, plumbing, and water heater last replaced?
- Why hasn't it sold? Are there any deal-killer items the seller is aware of (foundation, flood, title, zoning, code violations)?
- Is there a deadline driving the sale (1031 exchange, divorce, estate, relocation)? That informs how much negotiation room exists.
- Schools are D-rated, which usually means shorter tenancies and higher turnover. Who's the typical renter profile here, and what's been the actual vacancy rate?
- What's the average days-on-market for RENTAL listings here right now (not sales)? A rising rental-DOM trend means longer vacancies and softer asking-rent achievability than the comps imply.
- What's the recent tenant-quality profile in this submarket — average credit score on applications, eviction rate, late-payment / NSF rate, and stable-employment percentage? A property-management company in the area should have these aggregated.
- How much new for-sale + rental construction is in the pipeline within 1–3 miles? Heavy new supply typically softens prices + rents 12–24 months out; constrained supply supports both.
Investment metrics
- 1% rule
- 1.58% ✓
- Cap rate
- 13.87%
- Cash-on-cash
- 27.05%
- DSCR
- 2.20
- GRM
- 5.3
CMA / ARV
- ARV (on-the-fly)
- $122,754
- Comps found
- 12
Show comp detail 12 sales within ~0.75 mi
| Address | Dist | Beds/Ba | Sqft | Sold | Price | $/sf | Match |
|---|---|---|---|---|---|---|---|
| 609 Franklin Ave | 0.09mi | 3/2.0 | 996 (-0%) | 3mo | $187,500 | $188 | 93 |
| 401 Fulton Ave | 0.23mi | 3/1.0 | 974 (-2%) | 2mo | $169,900 | $174 | 80 |
| 625 Franklin Ave | 0.07mi | 2/1.0 (-1) | 968 (-3%) | 8mo | $124,900 | $129 | 76 |
| 622 Union Ave | 0.29mi | 3/2.0 | 1,014 (+2%) | 14mo | $125,000 | $123 | 72 |
| 800 Union Ave | 0.32mi | 3/1.0 | 1,034 (+4%) | 12mo | $115,000 | $111 | 65 |
| 818 Vincil St | 0.38mi | 2/1.0 (-1) | 960 (-4%) | 6mo | $99,900 | $104 | 62 |
| 602 Vincil St | 0.34mi | 2/1.0 (-1) | 937 (-6%) | 7mo | $69,900 | $75 | 59 |
| 520 Taylor St | 0.41mi | 2/1.5 (-1) | 1,053 (+6%) | 12mo | $124,900 | $119 | 55 |
| 524 Barrow St | 0.51mi | 2/1.0 (-1) | 912 (-9%) | 5mo | $119,900 | $131 | 49 |
| 712 Farror St | 0.48mi | 2/1.0 (-1) | 1,118 (+12%) | 3mo | $135,000 | $121 | 46 |
| 486 E Rollins St | 0.68mi | 2/1.0 (-1) | 930 (-7%) | 10mo | $82,900 | $89 | 39 |
| 527 E Burkhart St | 0.73mi | 3/2.0 | 1,140 (+14%) | 14mo | $147,900 | $130 | 31 |
Match score weights: distance 35% · size 25% · config 20% · recency 20%. Top-matched comps best support the ARV.
Projected returns pro-forma
-3.0% appreciation · 3.0% rent growth · sell at horizon
- IRR
- 21.0%
- Equity multiple
- 1.86×
- Total profit
- $20,360
- Equity at exit
- $12,666
- IRR
- 29.1%
- Equity multiple
- 3.59×
- Total profit
- $61,617
- Equity at exit
- $7,345
Cash invested: $23,786 (down + closing). Projections, not guarantees.
Landlord ↔ Tenant lean methodology
- Overall (STATE)
- 81 Strongly Landlord-Friendly
- State Missouri
- 81 Strongly Landlord-Friendly · R+10
- County
- — inherits STATE
- City
- — inherits STATE
ZIP-level market 65270
- Home prices YoY
- -30.6%
- Active inventory
- 134
- Price-to-rent
- 5.3×
Monthly cashflow live
- Estimated rent
- $1,340 medium interval (Pro) →
- Mortgage (P&I)
- −$445
- Tax from tax record
- −$42 /mo · $501/yr
- Insurance
- −$35
- HOA
- −$0
- Vacancy / Maint / Mgmt
- −$281
- Net cashflow
- $536
Break-even live
UW: 25.0% down · 7.5% · 30yr · 1.5% tax · 5.0% vac · 8.0% maint · 8.0% mgmt
Financing live
Cash to close
- Down payment
- $21,238
- Closing costs
- $2,548
- Reserves months
- —
- Total cash needed
- —
Loan-product check · same deal, 3 products live
Conventional
25% down · 7.5% · 30yr
- Down + closing
- —
- Monthly P&I
- —
- Monthly cashflow
- —
- DSCR
- —
- Eligible?
- —
Personal DTI + credit; lowest rate.
DSCR
20% down · 8.5% · 30yr
- Down + closing
- —
- Monthly P&I
- —
- Monthly cashflow
- —
- DSCR
- —
- Eligible?
- —
No personal income docs; deal must DSCR.
Hard money
10% down · 12.0% · 12mo
- Down + closing
- —
- Monthly P&I
- —
- Monthly cashflow
- —
- DSCR
- —
- Eligible?
- —
Short-term bridge; refi at stabilization.
Listing history 21 events
-
2026-04-26status Pending
-
2026-04-01status Active
-
2026-04-01status Active
-
2026-03-20price $84,950
-
2026-03-20price $84,950
-
2026-03-05status Active
-
2026-03-05status Active
-
2026-01-05status Pending
-
2025-11-24historical
-
2025-11-03price $99,900
-
2025-11-03price $99,900
-
2025-10-08$109,900 Active
-
2025-10-08$109,900 Active
-
2024-06-13historical 204-char remark
Show marketing remark (204 chars)
Property has been rented by the same tenant for the last 20+ years and tenant wishes to remain. Currently rented for $500/month. Full, unfinished basement has additional bathroom. Attached two-car garage.
-
2019-06-18soldstatus
-
2019-06-18soldstatus $36,000
-
2019-05-29$38,000 204-char remark
Show marketing remark (204 chars)
Property has been rented by the same tenant for the last 20+ years and tenant wishes to remain. Currently rented for $500/month. Full, unfinished basement has additional bathroom. Attached two-car garage.
-
2019-05-28$38,000
-
2004-12-20soldstatus $28,000
-
1995-09-05soldstatus
-
1983-03-04soldstatus
ⓘ Source: listings_history table (triggers on properties + properties_extension) + one-shot
backfill from property_details.listing_events for pre-trigger history.
Tax reassessment forecast MO · Resets to sale price
- Current annual tax
- $501 · $42/mo
- Projected year-2 tax
- $824 · $69/mo
- Expected delta
- +$323/yr (+$27/mo · 64.4%)
ⓘ Screening estimate from a state-policy table — verify with the county assessor before closing.
Climate risk First Street
- Flood 1/10 Low FEMA zone X (unshaded) · 0% chance over 30 yrs
- Wildfire 3/10 Moderate
- Heat 4/10 Moderate 7 d/yr ≥107°F today · 17 d/yr by 30 yrs out
- Wind 2/10 Low
- Air quality 1/10 Low 0 unhealthy d/yr today · 0 by 30 yrs out
Nearby sold comps map
Loading sold comps map…
Walkable amenities ~0.75 mi
Loading nearby amenities…
Taxation est. · year 1
- Rental income
- $16,083
- − Mortgage interest
- −$4,759
- − Property taxes
- −$501
- − Insurance
- −$425
- − Repairs & maintenance
- −$1,287
- − Management
- −$1,287
- − Depreciation
- −$2,471
- Taxable income
- $5,353
- Est. tax owed @ 24.0%
- −$1,285
- After-tax cash flow
- $5,148/yr
For passive investors: Depreciation is non-cash, so a rental often shows a tax loss while cash-flowing — sheltering income. Rental losses are passive: they offset passive income freely, and up to $25,000/yr can offset ordinary (W-2) income if you actively participate and your MAGI is under $100k (phasing out to $0 by $150k); unused losses carry forward. On sale, claimed depreciation is recaptured at up to 25%, and gains may owe capital-gains tax (a 1031 exchange can defer both). Figures are a year-1 estimate at your 24.0% rate — not tax advice; consult a CPA.
Schools (NCES district)
- District
- Moberly
- NCES district ID
- 2921100
- Math proficiency
- 30% ▼ -1.00%
- Reading proficiency
- 36% ▼ -3.00%
- Median HH income
- $36,160
- Composite
- 27.35/100
- National rank
- #6984
- State rank
- #246 of 324 in MO
Livability — Moberly
- Score
- 77/100
- State rank
- #32
- US rank
- #3045
Category grades
Schools grade is shown separately in the Schools card above.
Census & demographics
- Census place
- Moberly, MO
- Population (ZIP)
- 16,762
Population outlook (Randolph County) Hauer SSP2
- Today (2025)
- 24,596 people
- By 2030
- 24,213 · -1.6%
- By 2040
- 23,184 · -5.7%
- By 2050
- 22,081 · -10.2%
- By 2075
- 18,994 · -22.8%
- By 2100
- 15,070 · -38.7%
Race, ethnicity, and origin ACS 2023
- Neighborhood character
- Predominantly White (84%)
- Race & ethnicity
- White 84% Black 7% Two or more races 6% Hispanic / Latino 3%
- Common ancestry
- Italian 2% Lithuanian 2% Iranian 1%
- Foreign-born
- 1% · Canada
- Languages at home
- 98% English-only · Spanish 1%
Political lean MEDSL · Randolph
- 2024 margin
- Solid R (+52.2) · D 23.3% · R 75.5% · Other 1.2%
- 2008→2024 swing
- -28.9pp toward R · 2008: -23.3pp · 2024: -52.2pp
- All cycles
- 2024: R+52.2 2020: R+51.5 2016: R+50.9 2012: R+36.6 2008: R+23.3
Not yet ingested
- Civics
- —
Market trends
- HPI YoY
- ▼ -88.15%
- Current HPI
- 199.9743
- Rent YoY
- —
- Metro
- —
- State GDP YoY
- ▲ 1.84%
- F500 in state
- 20
Industry mix (Fortune 500 HQ in MO)
| Industry | F500 HQs | Revenue |
|---|---|---|
| Healthcare | 1 | $163B |
|
||
| Insurance | 1 | $21B |
|
||
| Industrial Technology | 1 | $17B |
|
||
| Retail | 1 | $16B |
|
||
| Industrial Distribution | 1 | $10B |
|
||
| Utilities | 1 | $9B |
|
||
Price history
+203.4% since first listed21 events — show timeline
- 2026-04-26 Pending — RCBR
- 2026-04-01 Relisted — CBORMLS
- 2026-04-01 Relisted — RCBR
- 2026-03-20 Price Changed $84,950 RCBR
- 2026-03-20 Price Changed $84,950 CBORMLS
- 2026-03-05 Relisted — CBORMLS
- 2026-03-05 Relisted — RCBR
- 2026-01-05 Pending — CBORMLS
- 2025-11-24 Delisted — CBORMLS
- 2025-11-03 Price Changed $99,900 RCBR
- 2025-11-03 Price Changed $99,900 CBORMLS
- 2025-10-08 Listed $109,900 CBORMLS
- 2025-10-08 Listed $109,900 RCBR
- 2024-06-13 Delisted — RCBR
- 2019-06-18 Sold (Public Records) $36,000 Public Records
- 2019-06-18 Sold (MLS) — CBORMLS
- 2019-05-29 Listed $38,000 RCBR
- 2019-05-28 Listed $38,000 CBORMLS
- 2004-12-20 Sold (Public Records) $28,000 Public Records
- 1995-09-05 Sold (Public Records) — Public Records
- 1983-03-04 Sold (Public Records) — Public Records
Property tax history
+3.7%/yrLatest (2025): $501 · +10.0% YoY. Source: county tax records.
Cash-flow waterfall
monthlySold comps — $/sqft
last 12 mo · ≤1 miLoading sold comps…