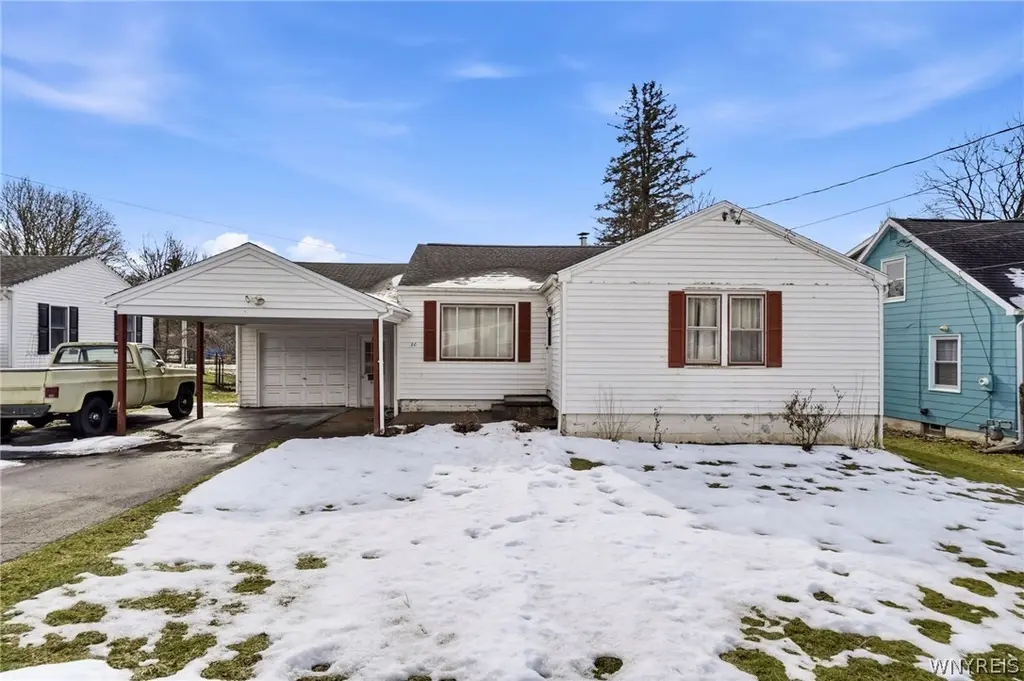
20 Allen St · Gowanda, NY
Flood risk 1/10 · Minimal
- FEMA flood zone
- X (unshaded)
- Chance of flooding over 30 yrs
- 0.0%
- Est. flood insurance / yr
- $473 – $860
Fire risk 3/10 · Minor
- Est. fire insurance / yr
- $691 – $1,283
Heat risk 2/10 · Minimal
- Hot days now (above 93°F)
- 7 days/yr
- Hot days in 30 yrs
- 17 days/yr
Wind risk 1/10 · Minimal
- Chance of severe wind over 30 yrs
- —
Air-quality risk 2/10 · Minimal
- Unhealthy air days now
- 1 days/yr
- Unhealthy air days in 30 yrs
- 2 days/yr
Risk factors via First Street. Map © Google.
Why this score? — see what drove the C- grade
The composite is a weighted blend of 9 inputs, each scored 0–100. Each bar is that input's sub-score; the figure is the points it added to the 100-point composite (weight × sub-score).
- ARV discount +15.0/15.0
- Appreciation +10.0/10.0
- Cash flow +7.6/30.0
- 1% rule +4.1/10.0
- Schools +3.5/10.0
- Livability +3.5/5.0
- Rent growth +2.5/5.0
- Condition / age +2.5/5.0
- DSCR +1.7/10.0
$115,000
🖨 Deal sheet (PDF) 📄 Offer letter ✓ Due diligence
Listing remarks MLS
Located in a quiet & friendly neighborhood is this cottage-like 3 bdrm Ranch home on a nice lot. Afforadable for any buyer, home features eat-in kitchen w/ dining room, living rm, furnace w/ A/C, tons of storage, full bsmt w/ toliet, rec rm & more - tons of potential! Make an appointment today!
Key facts
- Attached garage
- Carport
- Hardwood floors
Tags
Neighborhood map
What this means for you Summary
Snapshot
- This is a 3-bed/1.0-bath single-family listed at $115k.
Deal economics
- At list price, monthly cash flow is $-140 ($-2k/yr) — negative.
- To cash-flow at today's rent, offer at most $90k (21.4% below list).
- To meet the 1% rule (rent ≥ 1% of price), the offer needs to be $105k (9.0% below list).
- Recommended offer: $90k (21.4% below list) — sets the bar for cash-flow.
Location & tenants
- Location reads 70/100 on livability (#457 in NY) — a middle-class / working-renter tenant base. Strengths: cost of living A+, housing A+, health & safety A+; Watch: amenities F, commute F, employment F.
- Gowanda Central School District (rural): math 38% / reading 44% proficiency, ranked #513 of 590 in NY (top 87%) — families likely to look elsewhere, expect single-tenant / working-renter base with shorter leases.
- Zoned schools: Gowanda Elementary School (math 22% / reading 42%, grade F, #1,646 of 2,108 statewide, top 80%, 458 students, 65% FRL); Gowanda Middle School (math 29% / reading 42%, grade F, #473 of 729 statewide, top 66%, 323 students, 59% FRL); Gowanda High School (math 87%, 288 students, 51% FRL).
- Market conditions: 24 active listings in the ZIP; 1,244 units permitted in Erie County in 2024 (563 in 5+ unit buildings).
Forward outlook
- In year one you build about $12k of equity ($795 loan paydown + $12k appreciation (10.0% local appreciation)).
- By year 3, paydown + projected appreciation supports a ~$31k cash-out refi (75% LTV) — recoverable capital for the next deal without selling this one.
Negotiation context
- Only 5 days on market — expect competitive offers; lowballing is unlikely to land.
- 3 sale attempts since 15y ago with the ask held roughly flat each time — persistent listings suggest the price (not the market) is what's stuck; bring a comps-based counter.
- Current owner paid $78k; 47% above their basis — modest negotiation headroom, anchor on the comps not their cost.
Risks & watch-outs
- Watch-outs: property tax is 3.3% of price; built in 1955 — expect roof / HVAC / electrical / plumbing capex.
Questions for the listing agent
- What do current leases actually rent for vs. the listed asking? Can we see a recent rent roll and the last 12 months of T-12 income?
- Built in 1955 — when were the roof, HVAC, electrical panel, plumbing, and water heater last replaced?
- Property tax is high relative to price — has the assessment been appealed recently, and will the sale trigger a re-assessment?
- Is there a deadline driving the sale (1031 exchange, divorce, estate, relocation)? That informs how much negotiation room exists.
- What's the average days-on-market for RENTAL listings here right now (not sales)? A rising rental-DOM trend means longer vacancies and softer asking-rent achievability than the comps imply.
- What's the recent tenant-quality profile in this submarket — average credit score on applications, eviction rate, late-payment / NSF rate, and stable-employment percentage? A property-management company in the area should have these aggregated.
- How much new for-sale + rental construction is in the pipeline within 1–3 miles? Heavy new supply typically softens prices + rents 12–24 months out; constrained supply supports both.
Investment metrics
- 1% rule
- 0.91% ✗
- Cap rate
- 4.84%
- Cash-on-cash
- -5.20%
- DSCR
- 0.77
- GRM
- 9.2
CMA / ARV
- ARV (on-the-fly)
- $160,398
- Comps found
- 7
Show comp detail 7 sales within ~0.75 mi
| Address | Dist | Beds/Ba | Sqft | Sold | Price | $/sf | Match |
|---|---|---|---|---|---|---|---|
| 170 Seneca St | 0.16mi | 3/1.0 | 1,150 (-5%) | 8mo | $191,000 | $166 | 78 |
| 25 Allen St | 0.04mi | 3/1.0 | 1,040 (-14%) | 2mo | $138,000 | $133 | 74 |
| 241 Seneca St | 0.09mi | 3/2.5 | 1,336 (+11%) | 10mo | $220,000 | $165 | 63 |
| 17 Bader Ave | 0.19mi | 2/1.0 (-1) | 1,044 (-13%) | 4mo | $118,000 | $113 | 61 |
| 30 Saint John St | 0.65mi | 3/1.0 | 1,284 (+6%) | 15mo | $137,000 | $107 | 46 |
| 23 Aldrich St | 0.74mi | 3/2.0 | 1,341 (+11%) | 20mo | $212,000 | $158 | 27 |
| 110 E Main St | 0.59mi | 2/1.0 (-1) | 1,373 (+14%) | 23mo | $120,000 | $87 | 25 |
Match score weights: distance 35% · size 25% · config 20% · recency 20%. Top-matched comps best support the ARV.
Projected returns pro-forma
10.0% appreciation · 3.0% rent growth · sell at horizon
- IRR
- 20.6%
- Equity multiple
- 2.67×
- Total profit
- $53,868
- Equity at exit
- $103,601
- IRR
- 18.8%
- Equity multiple
- 6.15×
- Total profit
- $165,860
- Equity at exit
- $223,420
Cash invested: $32,200 (down + closing). Projections, not guarantees.
Landlord ↔ Tenant lean methodology
- Overall (STATE)
- 15 Strongly Tenant-Friendly
- State New York
- 15 Strongly Tenant-Friendly · D+10
- County
- — inherits STATE
- City
- — inherits STATE
ZIP-level market 14070
- Home prices YoY
- 8.8%
- Active inventory
- 24
- Price-to-rent
- 9.2×
Monthly cashflow live
- Estimated rent
- $1,046 medium interval (Pro) →
- Mortgage (P&I)
- −$603
- Tax from tax record
- −$315 /mo · $3,782/yr
- Insurance
- −$48
- HOA
- −$0
- Vacancy / Maint / Mgmt
- −$220
- Net cashflow
- $-140
Break-even live
Sensitivity live
| Price | -10% $-74 | -5% $-107 | +0% $-140 | +5% $-172 | +10% $-205 |
|---|---|---|---|---|---|
| Rent | -10% $-222 | -5% $-181 | +0% $-140 | +5% $-98 | +10% $-57 |
| Rate | -1.0pp $-82 | -0.5pp $-110 | base $-140 | +0.5pp $-169 | +1.0pp $-200 |
UW: 25.0% down · 7.5% · 30yr · 1.5% tax · 5.0% vac · 8.0% maint · 8.0% mgmt
Financing live
Cash to close
- Down payment
- $28,750
- Closing costs
- $3,450
- Reserves months
- —
- Total cash needed
- —
Loan-product check · same deal, 3 products live
Conventional
25% down · 7.5% · 30yr
- Down + closing
- —
- Monthly P&I
- —
- Monthly cashflow
- —
- DSCR
- —
- Eligible?
- —
Personal DTI + credit; lowest rate.
DSCR
20% down · 8.5% · 30yr
- Down + closing
- —
- Monthly P&I
- —
- Monthly cashflow
- —
- DSCR
- —
- Eligible?
- —
No personal income docs; deal must DSCR.
Hard money
10% down · 12.0% · 12mo
- Down + closing
- —
- Monthly P&I
- —
- Monthly cashflow
- —
- DSCR
- —
- Eligible?
- —
Short-term bridge; refi at stabilization.
Listing history 11 events
-
2026-06-21days on market $115,000 Active 5 DOM
-
2026-06-21days on market $115,000 Active 4 DOM
-
2026-06-18days on market $115,000 Active 2 DOM
-
2026-06-17remarks 699-char remark
-
2026-06-17pricestatusdays on market $115,000 Active 1 DOM
-
2026-03-06status Pending
-
2026-02-23$120,000 Active
-
2014-09-13$50,000
-
2011-05-24soldstatus $78,000 308-char remark
Show marketing remark (308 chars)
Located in a quiet & friendly neighborhood is this cottage-like 3 bdrm Ranch home on a nice lot. Afforadable for any buyer, home features eat-in kitchen w/ dining room, living rm, furnace w/ A/C, tons of storage, full bsmt w/ toliet, rec rm & more - tons of potential! Make an appointment today!
-
2011-05-20soldstatus $78,000
-
2011-01-18$76,000 308-char remark
Show marketing remark (308 chars)
Located in a quiet & friendly neighborhood is this cottage-like 3 bdrm Ranch home on a nice lot. Afforadable for any buyer, home features eat-in kitchen w/ dining room, living rm, furnace w/ A/C, tons of storage, full bsmt w/ toliet, rec rm & more - tons of potential! Make an appointment today!
ⓘ Source: listings_history table (triggers on properties + properties_extension) + one-shot
backfill from property_details.listing_events for pre-trigger history.
Tax reassessment forecast NY · Partial reset (capped growth)
- Current annual tax
- $3,782 · $315/mo
- Projected year-2 tax
- $3,782 · $315/mo
- Expected delta
- $0/yr ($0/mo · 0.0%)
ⓘ Screening estimate from a state-policy table — verify with the county assessor before closing.
Climate risk First Street
- Flood 1/10 Low FEMA zone X (unshaded) · 0% chance over 30 yrs
- Wildfire 3/10 Moderate
- Heat 2/10 Low 7 d/yr ≥93°F today · 17 d/yr by 30 yrs out
- Wind 1/10 Low
- Air quality 2/10 Low 1 unhealthy d/yr today · 2 by 30 yrs out
Nearby sold comps map
Loading sold comps map…
Walkable amenities ~0.75 mi
Loading nearby amenities…
Taxation est. · year 1
- Rental income
- $12,557
- − Mortgage interest
- −$6,442
- − Property taxes
- −$3,782
- − Insurance
- −$575
- − Repairs & maintenance
- −$1,005
- − Management
- −$1,005
- − Depreciation
- −$3,345
- Taxable loss
- −$3,597
- Est. tax savings @ 24.0%
- +$863
- After-tax cash flow
- $-811/yr
For passive investors: Depreciation is non-cash, so a rental often shows a tax loss while cash-flowing — sheltering income. Rental losses are passive: they offset passive income freely, and up to $25,000/yr can offset ordinary (W-2) income if you actively participate and your MAGI is under $100k (phasing out to $0 by $150k); unused losses carry forward. On sale, claimed depreciation is recaptured at up to 25%, and gains may owe capital-gains tax (a 1031 exchange can defer both). Figures are a year-1 estimate at your 24.0% rate — not tax advice; consult a CPA.
Schools (NCES district)
- District
- Gowanda Central School District
- NCES district ID
- 3612390
- Math proficiency
- 38% ▼ -13.00%
- Reading proficiency
- 44% ▲ 3.00%
- Median HH income
- $43,777
- Composite
- 34.71/100
- National rank
- #5138
- State rank
- #513 of 590 in NY
Livability — Gowanda
- Score
- 70/100
- State rank
- #457
- US rank
- #7988
Category grades
Schools grade is shown separately in the Schools card above.
Census & demographics
- Census place
- Gowanda, NY
- Population (ZIP)
- 5,437
Population outlook (Erie County) Hauer SSP2
- Today (2025)
- 933,037 people
- By 2030
- 935,181 · +0.2%
- By 2040
- 928,531 · -0.5%
- By 2050
- 905,725 · -2.9%
- By 2075
- 834,037 · -10.6%
- By 2100
- 708,033 · -24.1%
Race, ethnicity, and origin ACS 2023
- Neighborhood character
- Predominantly White (81%)
- Race & ethnicity
- White 81% Native American 10% Hispanic / Latino 5% Two or more races 3% Black 1%
- Hispanic origin (detail)
- Puerto Rican 4%
- Common ancestry
- Romanian 9% Italian 3% Slovak 2%
- Foreign-born
- 3% · Canada
- Languages at home
- 94% English-only · Spanish 3% German/W. Germanic 1%
Political lean MEDSL · Erie
- 2024 margin
- Lean D (+9.7) · D 54.8% · R 45.2%
- 2008→2024 swing
- -7.9pp toward R · 2008: 17.5pp · 2024: 9.7pp
- All cycles
- 2024: D+9.7 2020: D+14.7 2016: D+4.8 2012: D+15.6 2008: D+17.5
Not yet ingested
- Civics
- —
Market trends
- HPI YoY
- ▲ 21.64%
- Current HPI
- 269.1092
- Rent YoY
- —
- Metro
- —
- State GDP YoY
- ▲ 2.60%
- F500 in state
- 92
Industry mix (Fortune 500 HQ in NY)
| Industry | F500 HQs | Revenue |
|---|---|---|
| Financial Services | 10 | $950B |
|
||
| Consumer Goods | 9 | $162B |
|
||
| Insurance | 4 | $225B |
|
||
| Telecommunications | 2 | $144B |
|
||
| Pharmaceuticals | 2 | $112B |
|
||
| Media / Entertainment | 2 | $69B |
|
||
Price history
+57.9% since first listed6 events — show timeline
- 2026-03-06 Pending — WNYREIS
- 2026-02-23 Listed $120,000 WNYREIS
- 2014-09-13 Listed $50,000 UNYREIS
- 2011-05-24 Sold (MLS) $78,000 WNYREIS
- 2011-05-20 Sold (Public Records) $78,000 Public Records
- 2011-01-18 Listed $76,000 WNYREIS
Property tax history
+3.1%/yrLatest (2025): $3,782 · +5.3% YoY. Source: county tax records.
Cash-flow waterfall
monthlySold comps — $/sqft
last 12 mo · ≤1 miLoading sold comps…