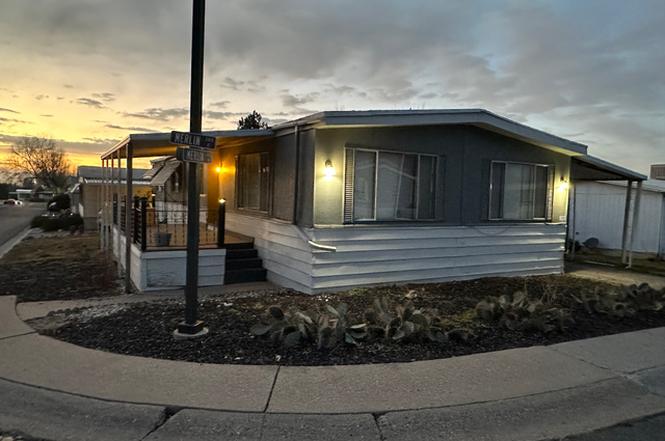
683 Merlin St #4630 · North Salt Lake, UT
Flood risk 6/10 · Moderate
- FEMA flood zone
- X (unshaded)
- Chance of flooding over 30 yrs
- 0.69%
- Est. flood insurance / yr
- $507 – $1,088
Fire risk 2/10 · Minimal
- Est. fire insurance / yr
- $453 – $841
Heat risk 4/10 · Minor
- Hot days now (above 90°F)
- 8 days/yr
- Hot days in 30 yrs
- 20 days/yr
Wind risk 1/10 · Minimal
- Chance of severe wind over 30 yrs
- —
Air-quality risk 5/10 · Moderate
- Unhealthy air days now
- 7 days/yr
- Unhealthy air days in 30 yrs
- 8 days/yr
Risk factors via First Street. Map © Google.
Why this score? — see what drove the D+ grade
The composite is a weighted blend of 9 inputs, each scored 0–100. Each bar is that input's sub-score; the figure is the points it added to the 100-point composite (weight × sub-score).
- Cash flow +15.0/30.0
- ARV discount +7.5/15.0
- 1% rule +5.0/10.0
- DSCR +5.0/10.0
- Rent growth +4.1/5.0
- Schools +4.1/10.0
- Livability +3.8/5.0
- Condition / age +2.5/5.0
- Appreciation +0.0/10.0
$37,500
🖨 Deal sheet 📄 Offer letter ✓ Due diligence
Listing remarks MLS
There are no remarks available.
Key facts
- New furnace
- Open floor plan
- New water heater
Tags
Property features AI
Finance
- HOA & community: Homeowners association (HOA membership); Association fee approximately $1,200; Community clubhouse; Subdivision: CAMELOT PARK
Exterior
- Parking: Carport (covered) for 2 vehicles; 2 total parking spaces
- Utilities: Natural gas connected; Electricity connected; Public sewer; Water connected (culinary and pressurized irrigation)
- Home design: Mobile home; Built/standing condition; Zoned MOB
- Construction: Aluminum and clapboard/masonite exterior; Rolled-silver and rubber roof
- Exterior features: Covered deck; Open porch; Double-pane windows; Storage shed(s); Full landscaping; Mature trees; Corner lot; Curb and gutter; Paved road
Interior
- Kitchen: Gas range; Microwave; Refrigerator; Disposal
- Bedrooms: 3 main-level bedrooms
- Flooring: Carpet; Tile
- Bathrooms: 2 full bathrooms
- Heating & cooling: Forced air heating (gas central); Evaporative cooling
- Interior features: Primary bathroom; Disposal; Gas range (free standing); Blinds
- Laundry & utility: Washer; Dryer; Electric dryer hookup
Neighborhood map
What this means for you Summary
Snapshot
- This is a 3-bed/2.0-bath manufactured listed at $38k.
Deal economics
- At list price, monthly cash flow is $157 ($2k/yr) — positive.
- The deal already cash-flows at list — no discount required.
- Meets the 1% rule at list price ($2k rent vs $38k).
- Recommended offer: $34k (9.0% below list) — sets the bar for market timing.
Location & tenants
- Location reads 76/100 on livability (#57 in UT, #3,560 nationally) — a middle-class / working-renter tenant base. Strengths: crime A+, commute A+, employment A+; Watch: cost of living D, amenities F, health & safety F.
- Davis District (suburban): math 43% / reading 47% proficiency, ranked #28 of 80 in UT (top 35%) — families likely to look elsewhere, expect single-tenant / working-renter base with shorter leases; only 19% free/reduced lunch — higher-income household profile.
- Zoned schools: Adelaide School (math 35% / reading 30%, grade F, #416 of 585 statewide, top 71%, 419 students, 50% FRL); South Davis Jr High (math 31% / reading 37%, grade F, #97 of 138 statewide, top 70%, 1,095 students, 25% FRL); Woods Cross High (math 36% / reading 47%, grade F, #57 of 171 statewide, top 34%, 1,567 students, 16% FRL).
- Market conditions: Rents rising fast (+6.5%/yr); 145 active listings in the ZIP; 21 comparable units currently listed for rent nearby; rentals at typical pace (median 14d on market — plan ~3-4 weeks tenant-placement turnaround); solid renter incomes; 1,461 units permitted in Davis County in 2024 (508 in 5+ unit buildings).
Forward outlook
- Local home prices are declining (-3.0%/yr); year-one equity from $259 of loan paydown is wiped out by about $1k of value loss. Plan a longer hold.
- Davis County population projected at +39% by 2050 — long-run rental-demand tailwind backs the buy-and-hold thesis.
- At projected returns (-3.0% appreciation + 6.5% rent growth), your $10k cash investment doubles in ~5 years — after that, you're playing with house money.
Negotiation context
- It's been on market 118 days — a 9% lower offer ($34k) is reasonable based on typical stale-listing flexibility.
- 2 sale attempts since 18y ago; this cycle's ask has dropped $32k (46%) from the opening price — seller is motivated, your offer sets the floor, not the list.
Risks & watch-outs
- Watch-outs: HOA is 59% of rent.
- Climate carrying-cost: major flood risk — expect insurance premiums to compound above CPI over the hold.
Questions for the listing agent
- It's been on market 118 days. Have you received any prior offers? Is the seller open to a 9% concession, seller financing, or rate buy-down credit?
- Built in 1976 — when were the roof, HVAC, electrical panel, plumbing, and water heater last replaced?
- What does the HOA fee cover, when was the last increase, and are there any pending special assessments or reserve-fund shortfalls?
- Why hasn't it sold? Are there any deal-killer items the seller is aware of (foundation, flood, title, zoning, code violations)?
- Is there a deadline driving the sale (1031 exchange, divorce, estate, relocation)? That informs how much negotiation room exists.
- The area grade is low — what's the realistic commute time and amenity access for the typical tenant pool here? Any planned neighborhood developments (good or bad) we should know about?
- What's the average days-on-market for RENTAL listings here right now (not sales)? A rising rental-DOM trend means longer vacancies and softer asking-rent achievability than the comps imply.
- What's the recent tenant-quality profile in this submarket — average credit score on applications, eviction rate, late-payment / NSF rate, and stable-employment percentage? A property-management company in the area should have these aggregated.
- How much new for-sale + rental construction is in the pipeline within 1–3 miles? Heavy new supply typically softens prices + rents 12–24 months out; constrained supply supports both.
Investment metrics
- 1% rule
- 5.46% ✓
- Cap rate
- 11.33%
- Cash-on-cash
- 17.99%
- DSCR
- 1.80
- GRM
- 1.5
CMA / ARV
No comps found within radius.
Projected returns pro-forma
-3.0% appreciation · 6.46% rent growth · sell at horizon
- IRR
- 24.0%
- Equity multiple
- 2.15×
- Total profit
- $12,091
- Equity at exit
- $5,591
- IRR
- 38.1%
- Equity multiple
- 6.62×
- Total profit
- $59,042
- Equity at exit
- $3,242
Cash invested: $10,500 (down + closing). Projections, not guarantees.
Landlord ↔ Tenant lean methodology
- Overall (STATE)
- 86 Strongly Landlord-Friendly
- State Utah
- 86 Strongly Landlord-Friendly · R+15
- County
- — inherits STATE
- City
- — inherits STATE
ZIP-level market 84054
- Rents YoY
- 6.5%
- Active inventory
- 145
- Price-to-rent
- 1.5×
Monthly cashflow live
- Estimated rent
- $2,046 high interval (Pro) →
- Mortgage (P&I)
- −$197
- Tax est. 1.5%
- −$47 /mo · $562/yr
- Insurance
- −$16
- HOA
- −$1,200
- Vacancy / Maint / Mgmt
- −$430
- Net cashflow
- $157
Break-even live
UW: 25.0% down · 7.5% · 30yr · 1.5% tax · 5.0% vac · 8.0% maint · 8.0% mgmt
Financing live
Cash to close
- Down payment
- $9,375
- Closing costs
- $1,125
- Reserves months
- —
- Total cash needed
- —
Loan-product check · same deal, 3 products live
Conventional
25% down · 7.5% · 30yr
- Down + closing
- —
- Monthly P&I
- —
- Monthly cashflow
- —
- DSCR
- —
- Eligible?
- —
Personal DTI + credit; lowest rate.
DSCR
20% down · 8.5% · 30yr
- Down + closing
- —
- Monthly P&I
- —
- Monthly cashflow
- —
- DSCR
- —
- Eligible?
- —
No personal income docs; deal must DSCR.
Hard money
10% down · 12.0% · 12mo
- Down + closing
- —
- Monthly P&I
- —
- Monthly cashflow
- —
- DSCR
- —
- Eligible?
- —
Short-term bridge; refi at stabilization.
Rent comps 21 comps
| Address | Beds | Baths | Sqft | Rent | $/sqft | DOM | Units | Dist |
|---|---|---|---|---|---|---|---|---|
| 3371 S Orchard Dr Bountiful, UT | 2.0 | 2.5 | 1267 | $2,200 | $1.74 | 14d | 1 | 0.46mi |
| 2767 S 625 W Bountiful, UT | 3.0 | 2.5 | 1400 | $1,900 | $1.36 | 23d | 1 | 0.51mi |
| 260 E Kirsten Ln North Salt Lake, UT | 3.0 | 2.5 | 1559 | $2,095 | $1.34 | 14d | 1 | 0.53mi |
| 2720 S Orchard Dr North Salt Lake, UT | 1.0–2.0 | 1.0 | 860 | $1,287 | $1.50 | 14d | 2 | 0.73mi |
| 2323 S 800 W Woods Cross, UT | 2.0–3.0 | 2.5 | 1476 | $2,299 | $1.56 | 10d | 1 | 0.73mi |
| 153 Bamberger Rd North Salt Lake, UT | 3.0 | 2.5 | 1171 | $1,699 | $1.45 | 23d | 1 | 0.83mi |
| 2720 S Orchard Dr Bountiful, UT | 2.0 | 1.0 | 970 | $1,287 | $1.33 | 23d | 1 | 0.89mi |
| 2583 S 200 W Bountiful, UT | 3.0 | 1.0 | 1300 | $1,850 | $1.42 | 23d | 1 | 1.03mi |
| 2030 S Main St Bountiful, UT | 1.0–2.0 | 1.0–2.0 | 825 | $1,700 | $2.06 | 13d | 13 | 1.09mi |
| 2035 S Main St Bountiful, UT | 3.0 | 3.0 | 1650 | $2,650 | $1.61 | 23d | 1 | 1.13mi |
| 110 S Main St North Salt Lake, UT | 1.0–3.0 | 1.0–2.0 | 1071 | $2,390 | $2.23 | 1d | 14 | 1.18mi |
| 47 W 100 S North Salt Lake, UT | 2.0 | 1.5 | 1120 | $1,349 | $1.20 | 23d | 1 | 1.19mi |
| 2001 S Main St Bountiful, UT | 2.0 | 2.0 | 1077 | $1,450 | $1.35 | 14d | 1 | 1.26mi |
| 325 S Orchard Dr North Salt Lake, UT | 1.0–3.0 | 1.0–2.0 | 968 | $2,300 | $2.37 | 1d | 31 | 1.36mi |
| 1752 S 440 W Woods Cross, UT | 2.0 | 1.0 | 1000 | $1,250 | $1.25 | 23d | 1 | 1.37mi |
| 1771 Renaissance Towne Dr Bountiful, UT | 1.0–2.0 | 1.0–2.0 | 1052 | $2,251 | $2.14 | 14d | 6 | 1.38mi |
| 11 E 2200 S Bountiful, UT | 3.0 | 2.5 | 1763 | $2,550 | $1.45 | 23d | 1 | 1.40mi |
| 842 W 1500 S Apt 4 Woods Cross, UT | 2.0 | 1.0 | 950 | $1,395 | $1.47 | 14d | 1 | 1.41mi |
| 790 N Cutler Dr North Salt Lake, UT | 1.0–3.0 | 1.0–2.0 | 1048 | $2,243 | $2.14 | 2d | 6 | 1.46mi |
| 453 W 1500 S Bountiful, UT | 2.0 | 1.0 | 930 | $1,650 | $1.77 | 13d | 16 | 1.47mi |
| 950 N Cutler Dr North Salt Lake, UT | 1.0–3.0 | 1.0–2.0 | 1040 | $2,059 | $1.98 | 19d | 20 | 1.49mi |
HOA detail
- Monthly dues
- $1,200 · $14,400/yr
Listing history 13 events
-
2026-06-18days on market $37,500 Active 118 DOM
-
2026-06-17days on market $37,500 Active 117 DOM
-
2026-06-16days on market $37,500 Active 116 DOM
-
2026-06-01days on market $37,500 Active 115 DOM
-
2026-05-31days on market $37,500 Active 114 DOM
-
2026-05-31days on market $37,500 Active 113 DOM
-
2026-04-24price $37,500
-
2026-03-25price $49,999
-
2026-03-05price $54,999
-
2026-02-14price $59,990
-
2026-02-07$69,999 Active
-
2008-08-13soldstatus 31-char remark
Show marketing remark (31 chars)
There are no remarks available.
-
2008-07-03$22,900 31-char remark
Show marketing remark (31 chars)
There are no remarks available.
ⓘ Source: listings_history table (triggers on properties + properties_extension) + one-shot
backfill from property_details.listing_events for pre-trigger history.
Climate risk First Street
- Flood 6/10 Major FEMA zone X (unshaded) · 69% chance over 30 yrs
- Wildfire 2/10 Low
- Heat 4/10 Moderate 8 d/yr ≥90°F today · 20 d/yr by 30 yrs out
- Wind 1/10 Low
- Air quality 5/10 Major 7 unhealthy d/yr today · 8 by 30 yrs out
Nearby sold comps map
Loading sold comps map…
Walkable amenities ~0.75 mi
Loading nearby amenities…
Taxation est. · year 1
- Rental income
- $24,556
- − Mortgage interest
- −$2,101
- − Property taxes
- −$562
- − Insurance
- −$188
- − Repairs & maintenance
- −$1,964
- − Management
- −$1,964
- − HOA
- −$14,400
- − Depreciation
- −$1,091
- Taxable income
- $2,286
- Est. tax owed @ 24.0%
- −$549
- After-tax cash flow
- $1,341/yr
For passive investors: Depreciation is non-cash, so a rental often shows a tax loss while cash-flowing — sheltering income. Rental losses are passive: they offset passive income freely, and up to $25,000/yr can offset ordinary (W-2) income if you actively participate and your MAGI is under $100k (phasing out to $0 by $150k); unused losses carry forward. On sale, claimed depreciation is recaptured at up to 25%, and gains may owe capital-gains tax (a 1031 exchange can defer both). Figures are a year-1 estimate at your 24.0% rate — not tax advice; consult a CPA.
Schools (NCES district)
- District
- Davis District
- NCES district ID
- 4900210
- Math proficiency
- 43% ▼ -9.00%
- Reading proficiency
- 47% ▼ -5.00%
- Median HH income
- $70,511
- Composite
- 40.59/100
- National rank
- #3698
- State rank
- #28 of 80 in UT
Livability — North Salt Lake
- Score
- 76/100
- State rank
- #57
- US rank
- #3560
Category grades
Schools grade is shown separately in the Schools card above.
Census & demographics
- Census place
- North Salt Lake, UT
- County
- Davis County · 341,755 people
- City population
- 22,355
- Metro
- Ogden-Clearfield, UT
- Population (ZIP)
- 22,355
- Household income
- $101,860
- Rent vs Own
- Severe rent burden
- 426.0
Population outlook (Davis County) Hauer SSP2
- Today (2025)
- 399,271 people
- By 2030
- 430,528 · +7.8%
- By 2040
- 493,485 · +23.6%
- By 2050
- 555,187 · +39.1%
- By 2075
- 688,589 · +72.5%
- By 2100
- 769,646 · +92.8%
Race, ethnicity, and origin ACS 2023
- Neighborhood character
- Predominantly White (71%)
- Race & ethnicity
- White 71% Hispanic / Latino 18% Two or more races 13% Asian 4%
- Hispanic origin (detail)
- Mexican 12%
- Common ancestry
- Iranian 3% Slovak 3% Italian 2%
- Foreign-born
- 13% · Canada
- Languages at home
- 80% English-only · Spanish 11% Other Indo-European 4% Other Asian/Pacific 3%
Political lean MEDSL · Davis
- 2024 margin
- Strong R (+24.9) · D 36.0% · R 60.8% · Other 3.2%
- 2008→2024 swing
- +17.4pp toward D · 2008: -42.3pp · 2024: -24.9pp
- All cycles
- 2024: R+24.9 2020: R+27.5 2016: R+23.3 2012: R+61.8 2008: R+42.3
Not yet ingested
- Civics
- —
Market trends
- HPI YoY
- ▼ -341.91%
- Current HPI
- 275.9596
- Rent YoY
- ▲ 6.46%
- Metro
- Ogden-Clearfield, UT
- State GDP YoY
- ▲ 3.54%
- F500 in state
- 2
Industry mix (Fortune 500 HQ in UT)
| Industry | F500 HQs | Revenue |
|---|---|---|
| Financial Services | 1 | $3B |
|
||
Price history
+63.8% since first listed7 events — show timeline
- 2026-04-24 Price Changed $37,500 WFRMLS
- 2026-03-25 Price Changed $49,999 WFRMLS
- 2026-03-05 Price Changed $54,999 WFRMLS
- 2026-02-14 Price Changed $59,990 WFRMLS
- 2026-02-07 Listed $69,999 WFRMLS
- 2008-08-13 Sold (MLS) — WFRMLS
- 2008-07-03 Listed $22,900 WFRMLS
Cash-flow waterfall
monthlySold comps — $/sqft
last 12 mo · ≤1 miLoading sold comps…