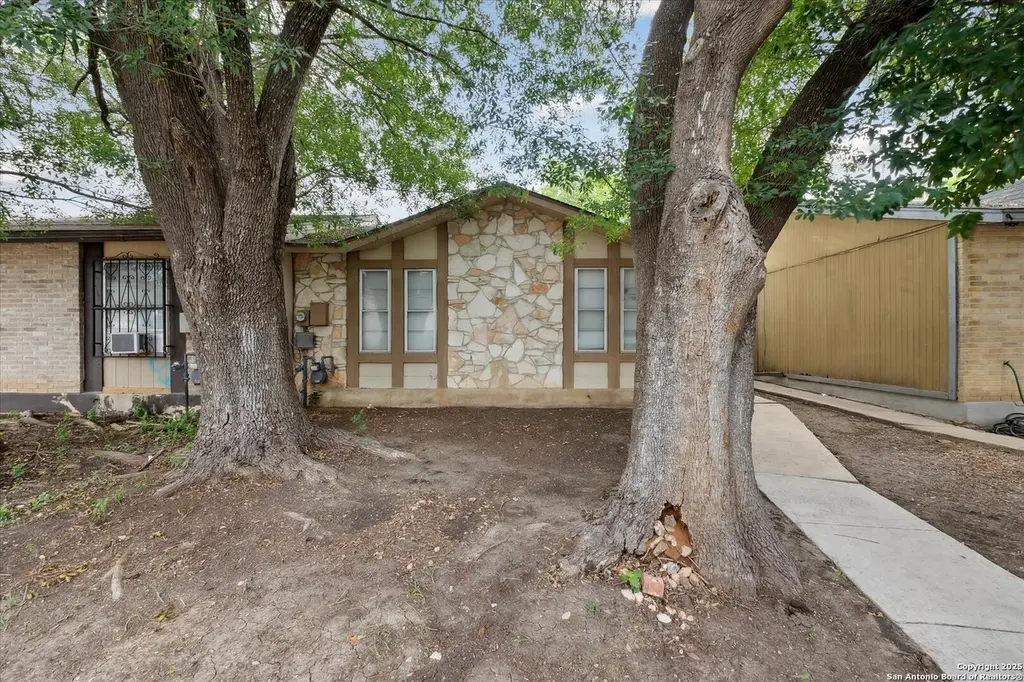
6839 Neston Dr · San Antonio, TX
Flood risk 1/10 · Minimal
- FEMA flood zone
- X (unshaded)
- Chance of flooding over 30 yrs
- 0.0%
- Est. flood insurance / yr
- $507 – $1,088
Fire risk 1/10 · Minimal
- Est. fire insurance / yr
- $1,222 – $2,270
Heat risk 8/10 · Major
- Hot days now (above 108°F)
- 7 days/yr
- Hot days in 30 yrs
- 22 days/yr
Wind risk 8/10 · Major
- Chance of severe wind over 30 yrs
- 80.0%
Air-quality risk 2/10 · Minimal
- Unhealthy air days now
- 0 days/yr
- Unhealthy air days in 30 yrs
- 1 days/yr
Risk factors via First Street. Map © Google.
Why this score? — see what drove the D grade
The composite is a weighted blend of 9 inputs, each scored 0–100. Each bar is that input's sub-score; the figure is the points it added to the 100-point composite (weight × sub-score).
- Cash flow +13.9/30.0
- Appreciation +5.0/10.0
- DSCR +4.2/10.0
- Livability +4.0/5.0
- 1% rule +3.9/10.0
- Schools +3.8/10.0
- ARV discount +2.5/15.0
- Rent growth +2.5/5.0
- Condition / age +2.5/5.0
$149,900
🖨 Deal sheet (PDF) 📄 Offer letter ✓ Due diligence
Listing remarks MLS
Charming and Well-Maintained Townhome in NEISD Welcome to this move-in ready townhome located in the highly desirable Northeast ISD. This well-appointed 2-bedroom, 1-bath home offers 1,225 square feet of comfortable living space perfect for first-time buyers or those looking to downsize. Conveniently situated near major highways, schools, and a variety of shopping and dining options, this home combines comfort and accessibility. The property features its own covered parking with alley access, as well as additional street parking for guests. Enjoy a spacious yard with mature trees that provide ample shade ideal for outdoor relaxation and family gatherings. Don't miss this opportunity to own a family-friendly home in a great location!
Key facts
- Alley access
- Spacious yard
- Covered parking
Tags
Neighborhood map
What this means for you Summary
Snapshot
- This is a 2-bed/1.0-bath townhouse listed at $150k.
Deal economics
- At list price, monthly cash flow is $15 ($186/yr) — positive.
- The deal already cash-flows at list — no discount required.
- To meet the 1% rule (rent ≥ 1% of price), the offer needs to be $133k (11.4% below list).
- Recommended offer: $132k (12.0% below list) — sets the bar for market timing.
- Cap rate 6.4% vs local median 3.8% in San Antonio — top-decile yield for the area; either an underpriced asset or a hidden risk that comps aren't pricing in. Stress-test before assuming the spread holds.
Location & tenants
- Location reads 80/100 on livability (#31 in TX, #1,616 nationally) — a professional / high-income tenant draw. Strengths: amenities A+, commute A+, cost of living A+; Watch: crime F.
- North East ISD (urban): math 38% / reading 49% proficiency, ranked #276 of 826 in TX (top 33%) — families likely to look elsewhere, expect single-tenant / working-renter base with shorter leases.
- Zoned schools: Montgomery El (math 17% / reading 22%, grade F, #3,583 of 4,322 statewide, top 86%, 263 students, 92% FRL); White Middle (math 28% / reading 40%, grade F, #892 of 1,662 statewide, top 55%, 944 students, 68% FRL); Roosevelt H S (math 20% / reading 40%, grade F, #1,096 of 1,632 statewide, top 68%, 2,599 students, 72% FRL) — zoned schools average 77% FRL vs 41% district-wide (36 pts higher); higher-poverty schools than district average — tighter screening recommended.
- Zoned-school proficiency averages 28% at this address vs 44% district-wide (-16 pts) — the specific schools serving this property underperform the North East ISD average; the district grade overstates school quality for this exact location.
- Market conditions: 1 active listings in the ZIP; 40 comparable units currently listed for rent nearby; rentals at typical pace (median 26d on market — plan ~3-4 weeks tenant-placement turnaround); 8,308 units permitted in Bexar County in 2024 (2,506 in 5+ unit buildings).
Forward outlook
- In year one you build about $6k of equity ($1k loan paydown + $4k appreciation (3.0% local appreciation)).
- Bexar County population projected at +50% by 2050 — long-run rental-demand tailwind backs the buy-and-hold thesis.
- At projected returns (3.0% appreciation + 3.0% rent growth), your $42k cash investment doubles in ~6 years — after that, you're playing with house money.
- By year 7, paydown + projected appreciation supports a ~$35k cash-out refi (75% LTV) — recoverable capital for the next deal without selling this one.
Negotiation context
- It's been on market 374 days — a 12% lower offer ($132k) is reasonable based on typical stale-listing flexibility.
- 10 sale attempts since 18y ago with the ask held roughly flat each time — persistent listings suggest the price (not the market) is what's stuck; bring a comps-based counter.
Risks & watch-outs
- Climate carrying-cost: severe wind risk, 80% chance of damaging wind over 30y; extreme-heat days projected 7→22/yr by 2055 (HVAC capex compounding) — expect insurance premiums to compound above CPI over the hold.
Questions for the listing agent
- It's been on market 374 days. Have you received any prior offers? Is the seller open to a 12% concession, seller financing, or rate buy-down credit?
- Why hasn't it sold? Are there any deal-killer items the seller is aware of (foundation, flood, title, zoning, code violations)?
- Is there a deadline driving the sale (1031 exchange, divorce, estate, relocation)? That informs how much negotiation room exists.
- Crime grade is F in this area — have there been break-ins, vandalism, or insurance claims at this property in the last 3 years? What carrier currently insures it and at what premium?
- The area grade is low — what's the realistic commute time and amenity access for the typical tenant pool here? Any planned neighborhood developments (good or bad) we should know about?
- What's the average days-on-market for RENTAL listings here right now (not sales)? A rising rental-DOM trend means longer vacancies and softer asking-rent achievability than the comps imply.
- What's the recent tenant-quality profile in this submarket — average credit score on applications, eviction rate, late-payment / NSF rate, and stable-employment percentage? A property-management company in the area should have these aggregated.
- How much new for-sale + rental construction is in the pipeline within 1–3 miles? Heavy new supply typically softens prices + rents 12–24 months out; constrained supply supports both.
Investment metrics
- 1% rule
- 0.89% ✗
- Cap rate
- 6.42%
- Cash-on-cash
- 0.44%
- DSCR
- 1.02
- GRM
- 9.4
CMA / ARV
- ARV (median comp)
- $134,962
- List price
- $149,900
- Delta
- 11.07%
- Verdict
- OVERPRICED
- Comps
- 20 within 1.0 mi
Show comp detail 6 sales within ~0.75 mi
| Address | Dist | Beds/Ba | Sqft | Sold | Price | $/sf | Match |
|---|---|---|---|---|---|---|---|
| 6907 Neston #1 | 0.02mi | 3/1.0 (+1) | 1,393 (+14%) | 7mo | $95,000 | $68 | 65 |
| 7009 Glen Mist | 0.65mi | 2/2.0 | 1,232 (+1%) | 3mo | $60,000 | $49 | 62 |
| 6915 Oldham | 0.10mi | 3/2.0 (+1) | 1,048 (-14%) | 5mo | $139,900 | $133 | 58 |
| 8002 Mallow | 0.27mi | 3/2.0 (+1) | 1,177 (-4%) | 22mo | $100,000 | $85 | 54 |
| 7904 Broadwick | 0.24mi | 3/2.0 (+1) | 1,104 (-10%) | 17mo | $135,000 | $122 | 49 |
| 7124 Oldham | 0.25mi | 3/2.0 (+1) | 1,074 (-12%) | 16mo | $170,000 | $158 | 46 |
Match score weights: distance 35% · size 25% · config 20% · recency 20%. Top-matched comps best support the ARV.
Projected returns pro-forma
3.0% appreciation · 3.0% rent growth · sell at horizon
- IRR
- 7.9%
- Equity multiple
- 1.45×
- Total profit
- $19,063
- Equity at exit
- $67,402
- IRR
- 10.6%
- Equity multiple
- 2.59×
- Total profit
- $66,529
- Equity at exit
- $103,874
Cash invested: $41,972 (down + closing). Projections, not guarantees.
Landlord ↔ Tenant lean methodology
- Overall (STATE)
- 87 Strongly Landlord-Friendly
- State Texas
- 87 Strongly Landlord-Friendly · R+5
- County
- — inherits STATE
- City
- — inherits STATE
ZIP-level market 78239-3324
- Active inventory
- 1
- Price-to-rent
- 9.4×
Monthly cashflow live
- Estimated rent
- $1,328 high interval (Pro) →
- Mortgage (P&I)
- −$786
- Tax from tax record
- −$185 /mo · $2,224/yr
- Insurance
- −$62
- HOA
- −$0
- Vacancy / Maint / Mgmt
- −$279
- Net cashflow
- $15
Break-even live
Sensitivity live
| Price | -10% $100 | -5% $58 | +0% $15 | +5% $-27 | +10% $-69 |
|---|---|---|---|---|---|
| Rent | -10% $-89 | -5% $-37 | +0% $15 | +5% $68 | +10% $120 |
| Rate | -1.0pp $91 | -0.5pp $54 | base $15 | +0.5pp $-23 | +1.0pp $-63 |
UW: 25.0% down · 7.5% · 30yr · 1.5% tax · 5.0% vac · 8.0% maint · 8.0% mgmt
Financing live
Cash to close
- Down payment
- $37,475
- Closing costs
- $4,497
- Reserves months
- —
- Total cash needed
- —
Loan-product check · same deal, 3 products live
Conventional
25% down · 7.5% · 30yr
- Down + closing
- —
- Monthly P&I
- —
- Monthly cashflow
- —
- DSCR
- —
- Eligible?
- —
Personal DTI + credit; lowest rate.
DSCR
20% down · 8.5% · 30yr
- Down + closing
- —
- Monthly P&I
- —
- Monthly cashflow
- —
- DSCR
- —
- Eligible?
- —
No personal income docs; deal must DSCR.
Hard money
10% down · 12.0% · 12mo
- Down + closing
- —
- Monthly P&I
- —
- Monthly cashflow
- —
- DSCR
- —
- Eligible?
- —
Short-term bridge; refi at stabilization.
Rent comps 40 comps
| Address | Beds | Baths | Sqft | Rent | $/sqft | DOM | Units | Dist |
|---|---|---|---|---|---|---|---|---|
| 6918 Stockport San Antonio, TX | 3.0 | 2.0 | 1390 | $1,050 | $0.76 | 45d | 1 | 0.11mi |
| 6814 Oldham San Antonio, TX | 3.0 | 2.0 | 1238 | $1,300 | $1.05 | 26d | 1 | 0.16mi |
| 7923 Langport San Antonio, TX | 3.0 | 2.0 | 1095 | $1,800 | $1.64 | 45d | 1 | 0.18mi |
| 6733 Montgomery Dr San Antonio, TX | 3.0 | 2.0 | 1150 | $860 | $0.75 | 45d | 2 | 0.21mi |
| 7138 Brecon San Antonio, TX | 3.0 | 2.5 | 1276 | $1,065 | $0.83 | 45d | 1 | 0.24mi |
| 8259 Montgomery Oak San Antonio, TX | 3.0 | 2.0 | 1152 | $1,250 | $1.09 | 45d | 5 | 0.28mi |
| 7904 Mallow San Antonio, TX | 3.0 | 2.0 | 1135 | $1,145 | $1.01 | 17d | 1 | 0.29mi |
| 7812 Broadwick San Antonio, TX | 2.0 | 1.0 | 884 | $1,075 | $1.22 | 19d | 1 | 0.31mi |
| 7809 Sarepto San Antonio, TX | 2.0 | 2.0 | 1152 | $950 | $0.82 | 26d | 1 | 0.32mi |
| 7006 Glen Grv San Antonio, TX | 3.0 | 2.0 | 1036 | $1,495 | $1.44 | 45d | 1 | 0.35mi |
| 7210 John Palmer Dr Unit 101 San Antonio, TX | 3.0 | 2.5 | 1426 | $1,650 | $1.16 | 18d | 1 | 0.37mi |
| 7210 John Palmer Dr Unit 101 San Antonio, TX | 3.0 | 2.5 | 1426 | $1,700 | $1.19 | 26d | 1 | 0.37mi |
| 6607 Benhill San Antonio, TX | 3.0 | 2.0 | 1318 | $2,000 | $1.52 | 24d | 1 | 0.40mi |
| 8310 Hastings San Antonio, TX | 2.0 | 1.0 | 1315 | $1,450 | $1.10 | 26d | 1 | 0.40mi |
| 6811 Avila San Antonio, TX | 3.0 | 2.0 | 1260 | $1,555 | $1.23 | 22d | 1 | 0.43mi |
| 8215 Littleport San Antonio, TX | 3.0 | 2.0 | 1344 | $1,600 | $1.19 | 19d | 1 | 0.43mi |
| 8350 Hastings San Antonio, TX | 3.0 | 2.0 | 1247 | $2,000 | $1.60 | 45d | 1 | 0.50mi |
| 7643 Glen Shire San Antonio, TX | 3.0 | 2.0 | 868 | $1,475 | $1.70 | 26d | 1 | 0.54mi |
| 7603 Glen Vis San Antonio, TX | 3.0 | 2.0 | 980 | $1,200 | $1.22 | 9d | 1 | 0.56mi |
| 7662 Oak Chase San Antonio, TX | 3.0 | 2.0 | 1250 | $1,200 | $0.96 | 13d | 1 | 0.57mi |
| 7664 Oak Chase San Antonio, TX | 3.0 | 2.0 | 1250 | $1,350 | $1.08 | 9d | 1 | 0.57mi |
| 7660 Oak Chase San Antonio, TX | 3.0 | 2.0 | 1250 | $1,200 | $0.96 | 13d | 1 | 0.57mi |
| 7658 Oak Chase San Antonio, TX | 3.0 | 2.0 | 1250 | $1,350 | $1.08 | 9d | 1 | 0.57mi |
| 9034 (15/16) Glen Shadow Dr San Antonio, TX | 3.0 | 2.5 | 1225 | $1,572 | $1.28 | 0d | 8 | 0.58mi |
| 9034 (15/16) Glen Shadow Dr San Antonio, TX | 3.0 | 2.5 | 1225 | $1,550 | $1.27 | 4d | 1 | 0.58mi |
| 9034 (15/16) Glen Shadow Dr San Antonio, TX | 3.0 | 2.5 | 1225 | $1,400 | $1.14 | 45d | 1 | 0.58mi |
| 7636 Oak Chase Unit 1 San Antonio, TX | 3.0 | 2.0 | 1200 | $1,255 | $1.05 | 45d | 1 | 0.60mi |
| 7651 Oak Chase San Antonio, TX | 3.0 | 3.5 | 1034 | $1,695 | $1.64 | 26d | 1 | 0.61mi |
| 8454 Braewick Dr San Antonio, TX | 2.0 | 2.0 | 784 | $900 | $1.15 | 18d | 1 | 0.64mi |
| 7318 Glen Trl San Antonio, TX | 3.0 | 2.0 | 1226 | $1,900 | $1.55 | 45d | 1 | 0.66mi |
| 8429 Braewick Dr San Antonio, TX | 2.0 | 2.0 | 1088 | $1,200 | $1.10 | 4d | 1 | 0.66mi |
| 7613 Oak Chase San Antonio, TX | 3.0 | 2.0 | 1200 | $1,100 | $0.92 | 45d | 1 | 0.66mi |
| 7614 Glen Hurst San Antonio, TX | 3.0 | 1.0 | 1100 | $1,400 | $1.27 | 4d | 1 | 0.68mi |
| 7568 Windsor Oaks Unit 7572 San Antonio, TX | 3.0 | 2.0 | 1150 | $1,250 | $1.09 | 6d | 1 | 0.70mi |
| 7571 Windsor Oaks San Antonio, TX | 2.0 | 1.0 | 750 | $695 | $0.93 | 26d | 1 | 0.71mi |
| 7902 Rustic Forest Dr San Antonio, TX | 3.0 | 2.0 | 1500 | $1,495 | $1.00 | 45d | 1 | 0.71mi |
| 7528 Oak Chase San Antonio, TX | 3.0 | 2.0 | 1138 | $995 | $0.87 | 45d | 1 | 0.71mi |
| 7331 Glen Hts San Antonio, TX | 3.0 | 2.0 | 1184 | $1,390 | $1.17 | 26d | 1 | 0.72mi |
| 7548 Windsor Oaks Unit 7548 San Antonio, TX | 3.0 | 2.0 | 1001 | $1,200 | $1.20 | 45d | 1 | 0.73mi |
| 7042 Glen Mist San Antonio, TX | 3.0 | 2.0 | 1284 | $950 | $0.74 | 45d | 1 | 0.73mi |
Listing history 42 events
-
2026-06-21days on market $149,900 Active 374 DOM
-
2026-06-18days on market $149,900 Active 371 DOM
-
2026-06-17days on market $149,900 Active 370 DOM
-
2026-06-16days on market $149,900 Active 369 DOM
-
2026-06-13days on market $149,900 Active 366 DOM
-
2026-06-13days on market $149,900 Active 365 DOM
-
2026-06-09days on market $149,900 Active 362 DOM
-
2026-06-08days on market $149,900 Active 361 DOM
-
2026-06-07days on market $149,900 Active 360 DOM
-
2026-06-04days on market $149,900 Active 357 DOM
-
2026-06-03days on market $149,900 Active 356 DOM
-
2026-06-02days on market $149,900 Active 355 DOM
-
2026-06-01days on market $149,900 Active 354 DOM
-
2026-05-31days on market $149,900 Active 353 DOM
-
2026-01-02status Back on Market 751-char remark
Show marketing remark (742 chars)
Charming and Well-Maintained Townhome in NEISD Welcome to this move-in ready townhome located in the highly desirable Northeast ISD. This well-appointed 2-bedroom, 1-bath home offers 1,225 square feet of comfortable living space perfect for first-time buyers or those looking to downsize. Conveniently situated near major highways, schools, and a variety of shopping and dining options, this home combines comfort and accessibility. The property features its own covered parking with alley access, as well as additional street parking for guests. Enjoy a spacious yard with mature trees that provide ample shade ideal for outdoor relaxation and family gatherings. Don't miss this opportunity to own a family-friendly home in a great location!
-
2026-01-02status Active 742-char remark
Show marketing remark (742 chars)
Charming and Well-Maintained Townhome in NEISD Welcome to this move-in ready townhome located in the highly desirable Northeast ISD. This well-appointed 2-bedroom, 1-bath home offers 1,225 square feet of comfortable living space perfect for first-time buyers or those looking to downsize. Conveniently situated near major highways, schools, and a variety of shopping and dining options, this home combines comfort and accessibility. The property features its own covered parking with alley access, as well as additional street parking for guests. Enjoy a spacious yard with mature trees that provide ample shade ideal for outdoor relaxation and family gatherings. Don't miss this opportunity to own a family-friendly home in a great location!
-
2025-12-31historical 751-char remark
Show marketing remark (742 chars)
Charming and Well-Maintained Townhome in NEISD Welcome to this move-in ready townhome located in the highly desirable Northeast ISD. This well-appointed 2-bedroom, 1-bath home offers 1,225 square feet of comfortable living space perfect for first-time buyers or those looking to downsize. Conveniently situated near major highways, schools, and a variety of shopping and dining options, this home combines comfort and accessibility. The property features its own covered parking with alley access, as well as additional street parking for guests. Enjoy a spacious yard with mature trees that provide ample shade ideal for outdoor relaxation and family gatherings. Don't miss this opportunity to own a family-friendly home in a great location!
-
2025-12-31historical 742-char remark
Show marketing remark (742 chars)
Charming and Well-Maintained Townhome in NEISD Welcome to this move-in ready townhome located in the highly desirable Northeast ISD. This well-appointed 2-bedroom, 1-bath home offers 1,225 square feet of comfortable living space perfect for first-time buyers or those looking to downsize. Conveniently situated near major highways, schools, and a variety of shopping and dining options, this home combines comfort and accessibility. The property features its own covered parking with alley access, as well as additional street parking for guests. Enjoy a spacious yard with mature trees that provide ample shade ideal for outdoor relaxation and family gatherings. Don't miss this opportunity to own a family-friendly home in a great location!
-
2025-06-10$149,900 New 751-char remark
Show marketing remark (742 chars)
Charming and Well-Maintained Townhome in NEISD Welcome to this move-in ready townhome located in the highly desirable Northeast ISD. This well-appointed 2-bedroom, 1-bath home offers 1,225 square feet of comfortable living space perfect for first-time buyers or those looking to downsize. Conveniently situated near major highways, schools, and a variety of shopping and dining options, this home combines comfort and accessibility. The property features its own covered parking with alley access, as well as additional street parking for guests. Enjoy a spacious yard with mature trees that provide ample shade ideal for outdoor relaxation and family gatherings. Don't miss this opportunity to own a family-friendly home in a great location!
-
2025-06-10$149,900 Active 742-char remark
Show marketing remark (742 chars)
Charming and Well-Maintained Townhome in NEISD Welcome to this move-in ready townhome located in the highly desirable Northeast ISD. This well-appointed 2-bedroom, 1-bath home offers 1,225 square feet of comfortable living space perfect for first-time buyers or those looking to downsize. Conveniently situated near major highways, schools, and a variety of shopping and dining options, this home combines comfort and accessibility. The property features its own covered parking with alley access, as well as additional street parking for guests. Enjoy a spacious yard with mature trees that provide ample shade ideal for outdoor relaxation and family gatherings. Don't miss this opportunity to own a family-friendly home in a great location!
-
2025-02-28historical
-
2025-01-22price $160,000
-
2024-05-01status Back on Market
-
2024-04-30historical
-
2023-11-01status Back on Market
-
2023-10-31historical
-
2023-07-12price $164,000
-
2023-05-19price $165,500
-
2023-05-01$167,500 New
-
2022-04-22soldstatus Sold
-
2022-04-22soldstatus
-
2022-04-12status Pending
-
2022-03-14historical Active Option
-
2022-03-10$140,000 New
-
2021-02-12soldstatus
-
2021-02-08soldstatus Sold
-
2021-02-06status Pending SB
-
2021-01-21$119,000 New
-
2020-12-30soldstatus
-
2020-12-30soldstatus
-
2008-12-24historical
-
2008-06-24$49,999
ⓘ Source: listings_history table (triggers on properties + properties_extension) + one-shot
backfill from property_details.listing_events for pre-trigger history.
Tax reassessment forecast TX · Resets to sale price
- Current annual tax
- $2,224 · $185/mo
- Projected year-2 tax
- $2,743 · $229/mo
- Expected delta
- +$519/yr (+$43/mo · 23.3%)
ⓘ Screening estimate from a state-policy table — verify with the county assessor before closing.
Climate risk First Street
- Flood 1/10 Low FEMA zone X (unshaded) · 0% chance over 30 yrs
- Wildfire 1/10 Low
- Heat 8/10 Severe 7 d/yr ≥108°F today · 22 d/yr by 30 yrs out
- Wind 8/10 Severe 80% chance of damaging wind over 30 yrs
- Air quality 2/10 Low 0 unhealthy d/yr today · 1 by 30 yrs out
Nearby sold comps map
Loading sold comps map…
Walkable amenities ~0.75 mi
Loading nearby amenities…
Taxation est. · year 1
- Rental income
- $15,940
- − Mortgage interest
- −$8,397
- − Property taxes
- −$2,224
- − Insurance
- −$750
- − Repairs & maintenance
- −$1,275
- − Management
- −$1,275
- − Depreciation
- −$4,361
- Taxable loss
- −$2,342
- Est. tax savings @ 24.0%
- +$562
- After-tax cash flow
- $748/yr
For passive investors: Depreciation is non-cash, so a rental often shows a tax loss while cash-flowing — sheltering income. Rental losses are passive: they offset passive income freely, and up to $25,000/yr can offset ordinary (W-2) income if you actively participate and your MAGI is under $100k (phasing out to $0 by $150k); unused losses carry forward. On sale, claimed depreciation is recaptured at up to 25%, and gains may owe capital-gains tax (a 1031 exchange can defer both). Figures are a year-1 estimate at your 24.0% rate — not tax advice; consult a CPA.
Schools (NCES district)
- District
- North East ISD
- NCES district ID
- 4832940
- Math proficiency
- 38% ▼ -14.00%
- Reading proficiency
- 49% ▼ -4.00%
- Median HH income
- $57,715
- Composite
- 38.1/100
- National rank
- #4276
- State rank
- #276 of 826 in TX
Livability — San Antonio
- Score
- 80/100
- State rank
- #31
- US rank
- #1616
Category grades
Schools grade is shown separately in the Schools card above.
Census & demographics
No demographic data for this ZIP.
Market trends
- HPI YoY
- —
- Current HPI
- —
- Rent YoY
- —
- Metro
- —
- State GDP YoY
- ▲ 3.95%
- F500 in state
- 110
Industry mix (Fortune 500 HQ in TX)
| Industry | F500 HQs | Revenue |
|---|---|---|
| Energy | 16 | $1,198B |
|
||
| Technology | 5 | $198B |
|
||
| Engineering / Construction | 4 | $72B |
|
||
| Energy Services | 3 | $60B |
|
||
| Utilities | 3 | $41B |
|
||
| Healthcare | 2 | $330B |
|
||
Price history
+199.8% since first listed28 events — show timeline
- 2026-01-02 Relisted — LERA
- 2026-01-02 Relisted — CTXMLS
- 2025-12-31 Listing Removed — LERA
- 2025-12-31 Listing Removed — CTXMLS
- 2025-06-10 Listed $149,900 LERA
- 2025-06-10 Listed $149,900 CTXMLS
- 2025-02-28 Listing Removed — LERA
- 2025-01-22 Price Changed $160,000 LERA
- 2024-05-01 Relisted — LERA
- 2024-04-30 Listing Removed — LERA
- 2023-11-01 Relisted — LERA
- 2023-10-31 Listing Removed — LERA
- 2023-07-12 Price Changed $164,000 LERA
- 2023-05-19 Price Changed $165,500 LERA
- 2023-05-01 Listed $167,500 LERA
- 2022-04-22 Sold (MLS) — LERA
- 2022-04-22 Sold (Public Records) — Public Records
- 2022-04-12 Pending — LERA
- 2022-03-14 Contingent — LERA
- 2022-03-10 Listed $140,000 LERA
- 2021-02-12 Sold (Public Records) — Public Records
- 2021-02-08 Sold (MLS) — LERA
- 2021-02-06 Pending — LERA
- 2021-01-21 Listed $119,000 LERA
- 2020-12-30 Sold (Public Records) — Public Records
- 2020-12-30 Sold (Public Records) — Public Records
- 2008-12-24 Listing Removed — LERA
- 2008-06-24 Listed $49,999 LERA
Property tax history
+12.0%/yrLatest (2025): $2,224 · -1.0% YoY. Source: county tax records.
Cash-flow waterfall
monthlySold comps — $/sqft
last 12 mo · ≤1 miLoading sold comps…