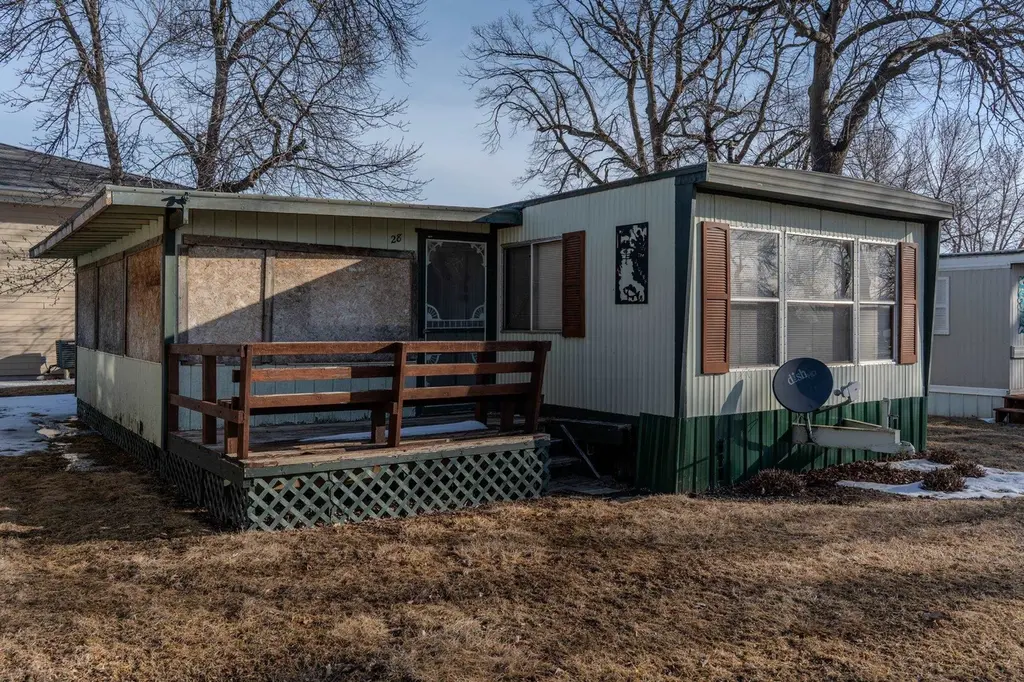
92 Rohr St #28 · Arnolds Park, IA
Flood risk 1/10 · Minimal
- FEMA flood zone
- X (unshaded)
- Chance of flooding over 30 yrs
- 0.0%
- Est. flood insurance / yr
- $473 – $860
Fire risk 3/10 · Minor
- Est. fire insurance / yr
- $902 – $1,676
Heat risk 2/10 · Minimal
- Hot days now (above 98°F)
- 7 days/yr
- Hot days in 30 yrs
- 16 days/yr
Wind risk 2/10 · Minimal
- Chance of severe wind over 30 yrs
- —
Air-quality risk 1/10 · Minimal
- Unhealthy air days now
- 0 days/yr
- Unhealthy air days in 30 yrs
- 0 days/yr
Risk factors via First Street. Map © Google.
Why this score? — see what drove the B+ grade
The composite is a weighted blend of 9 inputs, each scored 0–100. Each bar is that input's sub-score; the figure is the points it added to the 100-point composite (weight × sub-score).
- Cash flow +28.7/30.0
- DSCR +10.0/10.0
- Appreciation +10.0/10.0
- 1% rule +8.0/10.0
- ARV discount +7.5/15.0
- Schools +6.7/10.0
- Livability +3.9/5.0
- Rent growth +2.5/5.0
- Condition / age +2.5/5.0
$75,000
🖨 Deal sheet 📄 Offer letter ✓ Due diligence
Listing remarks
Nice summer location! 2 bedroom 1 bathroom with screened in Porch. Lake access with hoist space, Lakewood Park is conveniently located. This mobile park has access May 1st - October 15th. Home is on leased land and is subject to approval by Lakewood Park owner
Key facts
- Hoist space
- Screened in porch
- Lakewood park
Tags
Property features AI
Finance
- Other: Residential property
Exterior
- Parking: Concrete parking; Shared driveway
- Utilities: Public water; Public sewer
- Home design: Mobile home; One level
- Construction: Crawl space basement
- Exterior features: Deck
Interior
- Kitchen: Cooktop; Disposal; Microwave; Refrigerator
- Bathrooms: 1 full bathroom
- Heating & cooling: Electric heat; Natural gas heat; Baseboard heating; Ceiling fan(s)
- Interior features: Eat-in kitchen; Deck (patio/porch)
- Laundry & utility: Washer; Dryer
Neighborhood map
What this means for you Summary
Snapshot
- This is a 2-bed/1.0-bath manufactured listed at $75k.
Deal economics
- At list price, monthly cash flow is $249 ($3k/yr) — positive.
- The deal already cash-flows at list — no discount required.
- Meets the 1% rule at list price ($972 rent vs $75k).
Location & tenants
- Location reads 78/100 on livability (#140 in IA, #2,548 nationally) — a middle-class / working-renter tenant base. Strengths: crime A+, housing A+, schools A; Watch: amenities F, commute F.
- Okoboji Community School District (town): math 78% / reading 80% proficiency, ranked #40 of 289 in IA (top 14%) — strong family-tenant draw, lease renewals of 3-5y typical.
- Market conditions: 80 active listings in the ZIP; 295 units permitted in Dickinson County in 2024 (16 in 5+ unit buildings).
Forward outlook
- In year one you build about $8k of equity ($519 loan paydown + $8k appreciation (10.0% local appreciation)).
- Dickinson County population projected at +12% by 2050 — modest demand growth; plan on rents tracking national, not racing it.
- At projected returns (10.0% appreciation + 3.0% rent growth), your $21k cash investment doubles in ~2 years — after that, you're playing with house money.
- By year 5, paydown + projected appreciation supports a ~$37k cash-out refi (75% LTV) — recoverable capital for the next deal without selling this one.
Negotiation context
- Only 10 days on market — expect competitive offers; lowballing is unlikely to land.
- 4 sale attempts since 3y ago with the ask held roughly flat each time — persistent listings suggest the price (not the market) is what's stuck; bring a comps-based counter.
Questions for the listing agent
- Built in 1971 — when were the roof, HVAC, electrical panel, plumbing, and water heater last replaced?
- Is there a deadline driving the sale (1031 exchange, divorce, estate, relocation)? That informs how much negotiation room exists.
- Schools are A-rated — typically a magnet for longer-tenancy family renters. What's the average tenant stay here, and is there a school-zone premium baked into asking?
- What's the average days-on-market for RENTAL listings here right now (not sales)? A rising rental-DOM trend means longer vacancies and softer asking-rent achievability than the comps imply.
- What's the recent tenant-quality profile in this submarket — average credit score on applications, eviction rate, late-payment / NSF rate, and stable-employment percentage? A property-management company in the area should have these aggregated.
- How much new for-sale + rental construction is in the pipeline within 1–3 miles? Heavy new supply typically softens prices + rents 12–24 months out; constrained supply supports both.
Investment metrics
- 1% rule
- 1.30% ✓
- Cap rate
- 10.28%
- Cash-on-cash
- 14.25%
- DSCR
- 1.63
- GRM
- 6.4
CMA / ARV
No comps found within radius.
Projected returns pro-forma
10.0% appreciation · 3.0% rent growth · sell at horizon
- IRR
- 34.8%
- Equity multiple
- 3.70×
- Total profit
- $56,745
- Equity at exit
- $67,566
- IRR
- 30.0%
- Equity multiple
- 8.36×
- Total profit
- $154,643
- Equity at exit
- $145,709
Cash invested: $21,000 (down + closing). Projections, not guarantees.
Landlord ↔ Tenant lean methodology
- Overall (STATE)
- 83 Strongly Landlord-Friendly
- State Iowa
- 83 Strongly Landlord-Friendly · R+6
- County
- — inherits STATE
- City
- — inherits STATE
ZIP-level market 51331
- Home prices YoY
- 10.3%
- Active inventory
- 80
- Price-to-rent
- 6.4×
Monthly cashflow live
- Estimated rent
- $972 medium interval (Pro) →
- Mortgage (P&I)
- −$393
- Tax est. 1.5%
- −$94 /mo · $1,125/yr
- Insurance
- −$31
- HOA
- −$0
- Vacancy / Maint / Mgmt
- −$204
- Net cashflow
- $249
Break-even live
UW: 25.0% down · 7.5% · 30yr · 1.5% tax · 5.0% vac · 8.0% maint · 8.0% mgmt
Financing live
Cash to close
- Down payment
- $18,750
- Closing costs
- $2,250
- Reserves months
- —
- Total cash needed
- —
Loan-product check · same deal, 3 products live
Conventional
25% down · 7.5% · 30yr
- Down + closing
- —
- Monthly P&I
- —
- Monthly cashflow
- —
- DSCR
- —
- Eligible?
- —
Personal DTI + credit; lowest rate.
DSCR
20% down · 8.5% · 30yr
- Down + closing
- —
- Monthly P&I
- —
- Monthly cashflow
- —
- DSCR
- —
- Eligible?
- —
No personal income docs; deal must DSCR.
Hard money
10% down · 12.0% · 12mo
- Down + closing
- —
- Monthly P&I
- —
- Monthly cashflow
- —
- DSCR
- —
- Eligible?
- —
Short-term bridge; refi at stabilization.
Listing history 8 events
-
2026-06-18days on market $75,000 Active 10 DOM
-
2026-06-17days on market $75,000 Active 9 DOM
-
2026-06-16days on market $75,000 Active 8 DOM
-
2026-06-15days on market $75,000 Active 7 DOM
-
2026-06-13days on market $75,000 Active 5 DOM
-
2026-06-12days on market $75,000 Active 4 DOM
-
2026-06-09remarks 260-char remark
-
2026-06-09$75,000 Active 1 DOM
ⓘ Source: listings_history table (triggers on properties + properties_extension) + one-shot
backfill from property_details.listing_events for pre-trigger history.
Climate risk First Street
- Flood 1/10 Low FEMA zone X (unshaded) · 0% chance over 30 yrs
- Wildfire 3/10 Moderate
- Heat 2/10 Low 7 d/yr ≥98°F today · 16 d/yr by 30 yrs out
- Wind 2/10 Low
- Air quality 1/10 Low 0 unhealthy d/yr today · 0 by 30 yrs out
Nearby sold comps map
Loading sold comps map…
Walkable amenities ~0.75 mi
Loading nearby amenities…
Taxation est. · year 1
- Rental income
- $11,661
- − Mortgage interest
- −$4,201
- − Property taxes
- −$1,125
- − Insurance
- −$375
- − Repairs & maintenance
- −$933
- − Management
- −$933
- − Depreciation
- −$2,182
- Taxable income
- $1,912
- Est. tax owed @ 24.0%
- −$459
- After-tax cash flow
- $2,534/yr
For passive investors: Depreciation is non-cash, so a rental often shows a tax loss while cash-flowing — sheltering income. Rental losses are passive: they offset passive income freely, and up to $25,000/yr can offset ordinary (W-2) income if you actively participate and your MAGI is under $100k (phasing out to $0 by $150k); unused losses carry forward. On sale, claimed depreciation is recaptured at up to 25%, and gains may owe capital-gains tax (a 1031 exchange can defer both). Figures are a year-1 estimate at your 24.0% rate — not tax advice; consult a CPA.
Schools (NCES district)
- District
- Okoboji Community School District
- NCES district ID
- 1900021
- Math proficiency
- 78% ▲ 8.00%
- Reading proficiency
- 80% ▲ 6.00%
- Median HH income
- $50,522
- Composite
- 66.88/100
- National rank
- #403
- State rank
- #40 of 289 in IA
Livability — Arnolds Park
- Score
- 78/100
- State rank
- #140
- US rank
- #2548
Category grades
Schools grade is shown separately in the Schools card above.
Census & demographics
- Census place
- Arnolds Park, IA
- City population
- 920
- Population (ZIP)
- 920
Population outlook (Dickinson County) Hauer SSP2
- Today (2025)
- 18,133 people
- By 2030
- 18,610 · +2.6%
- By 2040
- 19,456 · +7.3%
- By 2050
- 20,307 · +12.0%
- By 2075
- 23,155 · +27.7%
- By 2100
- 24,449 · +34.8%
Race, ethnicity, and origin ACS 2023
- Neighborhood character
- Predominantly White (98%)
- Race & ethnicity
- White 98% Two or more races 1%
- Common ancestry
- Portuguese 8% Slovak 3% Iranian 3%
- Foreign-born
- 1%
- Languages at home
- 99% English-only · Other Indo-European 1%
Political lean MEDSL · Dickinson
- 2024 margin
- Solid R (+40.0) · D 29.5% · R 69.5% · Other 1.1%
- 2008→2024 swing
- -34.6pp toward R · 2008: -5.4pp · 2024: -40.0pp
- All cycles
- 2024: R+40.0 2020: R+33.6 2016: R+36.0 2012: R+18.0 2008: R+5.4
Not yet ingested
- Civics
- —
Market trends
- HPI YoY
- ▲ 19.42%
- Current HPI
- 207.79
- Rent YoY
- —
- Metro
- —
- State GDP YoY
- ▲ 2.48%
- F500 in state
- 4
Industry mix (Fortune 500 HQ in IA)
| Industry | F500 HQs | Revenue |
|---|---|---|
| Financial Services | 1 | $16B |
|
||
| Retail / Convenience | 1 | $15B |
|
||
Price history
-40.0% since first listed8 events — show timeline
- 2026-06-08 Listed $75,000 Iowa Great Lakes BOR
- 2025-09-03 Price Changed $55,000 Iowa Great Lakes BOR
- 2025-01-21 Price Changed $70,000 Iowa Great Lakes BOR
- 2024-09-16 Listed $85,000 Iowa Great Lakes BOR
- 2024-05-27 Price Changed $114,000 Iowa Great Lakes BOR
- 2023-08-27 Relisted — Iowa Great Lakes BOR
- 2023-08-15 Delisted — Iowa Great Lakes BOR
- 2023-08-13 Listed $125,000 Iowa Great Lakes BOR
Property tax history
+5.9%/yrLatest (2025): $24 · -20.0% YoY. Source: county tax records.
Cash-flow waterfall
monthlySold comps — $/sqft
last 12 mo · ≤1 miLoading sold comps…