26803 Port Rd Unit E-186 · Long Neck, DE
Flood risk 5/10 · Moderate
- FEMA flood zone
- X (unshaded)
- Chance of flooding over 30 yrs
- 0.44%
- Est. flood insurance / yr
- $473 – $860
Fire risk 1/10 · Minimal
- Est. fire insurance / yr
- $476 – $884
Heat risk 8/10 · Major
- Hot days now (above 101°F)
- 7 days/yr
- Hot days in 30 yrs
- 18 days/yr
Wind risk 8/10 · Major
- Chance of severe wind over 30 yrs
- 80.0%
Air-quality risk 2/10 · Minimal
- Unhealthy air days now
- 1 days/yr
- Unhealthy air days in 30 yrs
- 1 days/yr
Risk factors via First Street. Map © Google.
Why this score? — see what drove the C grade
The composite is a weighted blend of 9 inputs, each scored 0–100. Each bar is that input's sub-score; the figure is the points it added to the 100-point composite (weight × sub-score).
- Cash flow +27.7/30.0
- DSCR +9.8/10.0
- 1% rule +7.6/10.0
- Condition / age +4.0/5.0
- Livability +3.5/5.0
- Schools +2.9/10.0
- Rent growth +2.5/5.0
- ARV discount +0.0/15.0
- Appreciation +0.0/10.0
$179,000
🖨 Deal sheet 📄 Offer letter ✓ Due diligence
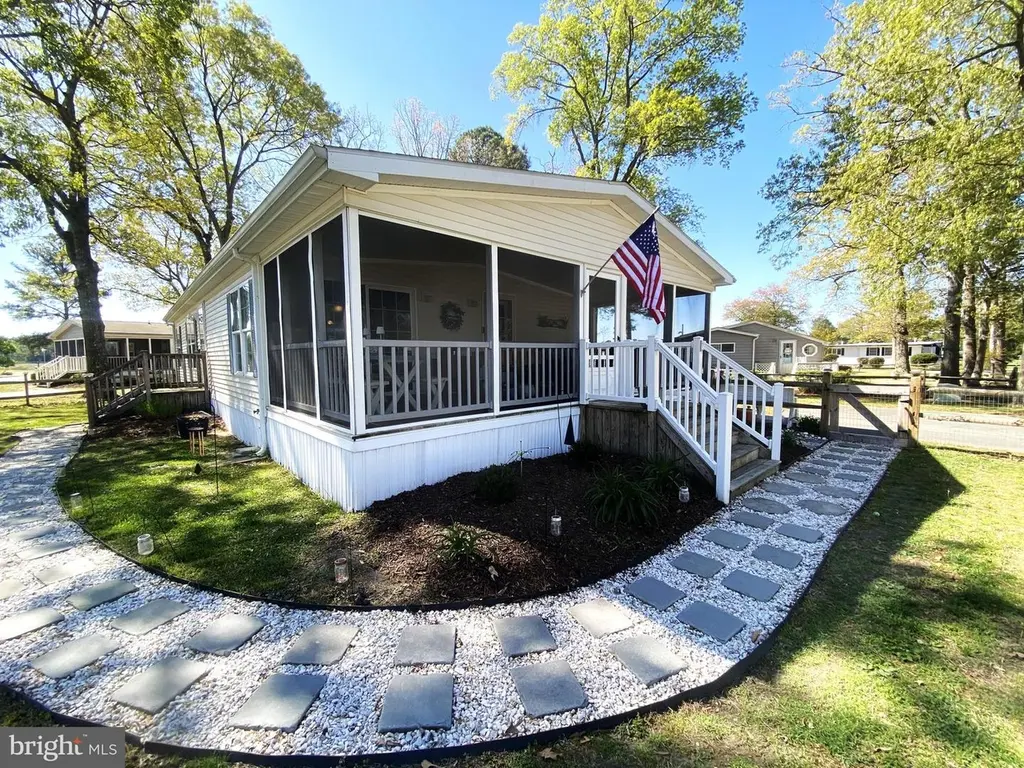
Listing remarks
Step into a world of comfort and charm with this delightful 3-bedroom, 2-bath residence, perfectly situated on a spacious corner lot. Spanning an impressive 1320 sq ft, this home is a true sanctuary, surrounded by beautifully manicured gardens and large shade trees that provide a serene backdrop for your everyday life. The fenced yard is not only a safe haven for your furry friends but also a perfect space for outdoor gatherings and playtime. Enjoy the luxury of a 12x12 shed equipped with power, ideal for storing all your fishing gear and outdoor essentials. With ample parking available for guests, hosting everyone has never been easier. Unwind on your generous large screened in porch, wher
Key facts
- 4 parking spots
- Community pool
- Built 2006
Property features AI
Finance
- Other: Property listed as Land Lease ownership interest; Located in FEMA flood zone AE-6; Ground rent exists
- Financial info: Land lease in place with monthly ground rent; Approximately 9 years of land lease remaining; Annual ground rent listed as an income/expense item
- HOA & community: Community pool
Exterior
- Parking: Driveway parking; Space for four vehicles (driveway and total parking)
- Utilities: Public water; Public sewer; Cable TV available; Fixed wireless internet; Propane service
- Home design: Manufactured double-wide home; Level entry; Architectural shingle roof
- Construction: Vinyl siding; Pillar/post/pier foundation; Building not winterized
- Exterior features: Corner lot with side yard(s); Split rail fencing; Community in-ground pool; Shed on the property; Private blacktop road access
Interior
- Bedrooms: Three bedrooms on the main level
- Flooring: Luxury vinyl plank flooring
- Bathrooms: Two full bathrooms on the main level
- Heating & cooling: Central air conditioning with ceiling fans; Propane (leased) heating; Electric hot water
- Interior features: Vaulted ceilings; Vinyl walls/ceilings; Not furnished; Level entry to main living area
- Laundry & utility: Main-floor laundry
Neighborhood map
What this means for you Summary
Snapshot
- This is a 3-bed/2.0-bath single-family listed at $179k. Condition is rated good.
Deal economics
- At list price, monthly cash flow is $543 ($7k/yr) — positive.
- The deal already cash-flows at list — no discount required.
- Meets the 1% rule at list price ($2k rent vs $179k).
- Recommended offer: $174k (3.0% below list) — sets the bar for market timing.
- Cap rate 9.9% vs local median 3.2% in Long Neck — top-decile yield for the area; either an underpriced asset or a hidden risk that comps aren't pricing in. Stress-test before assuming the spread holds.
Location & tenants
- Location reads 69/100 on livability (#30 in DE) — a middle-class / working-renter tenant base. Strengths: cost of living A+, housing A+, crime A-; Watch: employment D+, schools F, amenities F.
- Indian River School District (rural): math 25% / reading 41% proficiency, ranked #14 of 26 in DE (top 54%) — families likely to look elsewhere, expect single-tenant / working-renter base with shorter leases.
- Market conditions: 865 active listings in the ZIP; 1 comparable units currently listed for rent nearby; solid renter incomes; 4,354 units permitted in Sussex County in 2024 (344 in 5+ unit buildings).
- This rent runs 35% of the median local income ($78k/yr) — at the standard rent-burdened threshold; future hikes will face affordability resistance.
Forward outlook
- Local home prices are declining (-3.0%/yr); year-one equity from $1k of loan paydown is wiped out by about $5k of value loss. Plan a longer hold.
- Sussex County population projected at +25% by 2050 — long-run rental-demand tailwind backs the buy-and-hold thesis.
- At projected returns (-3.0% appreciation + 3.0% rent growth), your $50k cash investment doubles in ~9 years — after that, you're playing with house money.
Negotiation context
- It's been on market 55 days — a 3% lower offer ($174k) is reasonable based on typical stale-listing flexibility.
Risks & watch-outs
- Climate carrying-cost: moderate flood risk; severe wind risk, 80% chance of damaging wind over 30y; extreme-heat days projected 7→18/yr by 2055 (HVAC capex compounding) — expect insurance premiums to compound above CPI over the hold.
Questions for the listing agent
- It's been on market 55 days. Have you received any prior offers? Is the seller open to a 3% concession, seller financing, or rate buy-down credit?
- Is there a deadline driving the sale (1031 exchange, divorce, estate, relocation)? That informs how much negotiation room exists.
- Schools are F-rated, which usually means shorter tenancies and higher turnover. Who's the typical renter profile here, and what's been the actual vacancy rate?
- What's the average days-on-market for RENTAL listings here right now (not sales)? A rising rental-DOM trend means longer vacancies and softer asking-rent achievability than the comps imply.
- What's the recent tenant-quality profile in this submarket — average credit score on applications, eviction rate, late-payment / NSF rate, and stable-employment percentage? A property-management company in the area should have these aggregated.
- How much new for-sale + rental construction is in the pipeline within 1–3 miles? Heavy new supply typically softens prices + rents 12–24 months out; constrained supply supports both.
Investment metrics
- 1% rule
- 1.26% ✓
- Cap rate
- 9.93%
- Cash-on-cash
- 13.00%
- DSCR
- 1.58
- GRM
- 6.6
CMA / ARV
- ARV (median comp)
- $139,402
- List price
- $179,000
- Delta
- 28.41%
- Verdict
- OVERPRICED
- Comps
- 20 within 1.0 mi
Show comp detail 12 sales within ~0.75 mi
| Address | Dist | Beds/Ba | Sqft | Sold | Price | $/sf | Match |
|---|---|---|---|---|---|---|---|
| 34848 Halyard St Unit E-431 | 0.24mi | 3/2.0 | 1,366 (+2%) | 5mo | $273,176 | $200 | 82 |
| 26990 Wood Duck Rd #52697 | 0.44mi | 3/2.0 | 1,334 (-1%) | 1mo | $180,000 | $135 | 77 |
| 34484 Oak Ln | 0.41mi | 3/2.0 | 1,400 (+4%) | 1mo | $207,900 | $149 | 73 |
| 34995 Keelson St Unit E-274 | 0.28mi | 3/2.0 | 1,232 (-8%) | 3mo | $158,500 | $129 | 71 |
| 34488 Easy St Unit E-810 | 0.35mi | 3/2.0 | 1,456 (+8%) | 0mo | $190,000 | $130 | 70 |
| 34495 Easy St | 0.35mi | 3/2.0 | 1,432 (+6%) | 6mo | $140,000 | $98 | 68 |
| 34635 Deck St Unit E-323 | 0.15mi | 4/2.0 (+1) | 1,168 (-13%) | 3mo | $134,900 | $115 | 64 |
| 26545 Woodchuck Ln Unit E-862 | 0.56mi | 3/2.0 | 1,456 (+8%) | 0mo | $159,000 | $109 | 60 |
| 35434 Pine Dr | 0.67mi | 3/2.0 | 1,396 (+4%) | 3mo | $106,500 | $76 | 60 |
| 27413 Grove Circle Rd #39 | 0.66mi | 3/2.0 | 1,444 (+7%) | 2mo | $190,000 | $132 | 55 |
| 34401 Mallard Rd #502 | 0.56mi | 3/2.0 | 1,200 (-11%) | 3mo | $99,900 | $83 | 53 |
| 35547 E Harbor Dr | 0.73mi | 2/2.0 (-1) | 1,184 (-12%) | 1mo | $165,000 | $139 | 40 |
Match score weights: distance 35% · size 25% · config 20% · recency 20%. Top-matched comps best support the ARV.
Projected returns pro-forma
-3.0% appreciation · 3.0% rent growth · sell at horizon
- IRR
- 2.9%
- Equity multiple
- 1.11×
- Total profit
- $5,609
- Equity at exit
- $26,689
- IRR
- 12.5%
- Equity multiple
- 1.99×
- Total profit
- $49,550
- Equity at exit
- $15,477
Cash invested: $50,120 (down + closing). Projections, not guarantees.
Landlord ↔ Tenant lean methodology
- Overall (STATE)
- 70 Landlord-Friendly
- State Delaware
- 70 Landlord-Friendly · D+7
- County
- — inherits STATE
- City
- — inherits STATE
ZIP-level market 19966
- Home prices YoY
- -6.4%
- Active inventory
- 865
- Price-to-rent
- 6.6×
Monthly cashflow live
- Estimated rent
- $2,253 medium interval (Pro) →
- Mortgage (P&I)
- −$939
- Tax est. 1.5%
- −$224 /mo · $2,685/yr
- Insurance
- −$75
- HOA
- −$0
- Vacancy / Maint / Mgmt
- −$473
- Net cashflow
- $543
Break-even live
UW: 25.0% down · 7.5% · 30yr · 1.5% tax · 5.0% vac · 8.0% maint · 8.0% mgmt
Financing live
Cash to close
- Down payment
- $44,750
- Closing costs
- $5,370
- Reserves months
- —
- Total cash needed
- —
Loan-product check · same deal, 3 products live
Conventional
25% down · 7.5% · 30yr
- Down + closing
- —
- Monthly P&I
- —
- Monthly cashflow
- —
- DSCR
- —
- Eligible?
- —
Personal DTI + credit; lowest rate.
DSCR
20% down · 8.5% · 30yr
- Down + closing
- —
- Monthly P&I
- —
- Monthly cashflow
- —
- DSCR
- —
- Eligible?
- —
No personal income docs; deal must DSCR.
Hard money
10% down · 12.0% · 12mo
- Down + closing
- —
- Monthly P&I
- —
- Monthly cashflow
- —
- DSCR
- —
- Eligible?
- —
Short-term bridge; refi at stabilization.
Rent comps 1 comps
| Address | Beds | Baths | Sqft | Rent | $/sqft | DOM | Units | Dist |
|---|---|---|---|---|---|---|---|---|
| 35829 S Gloucester Cir Unit 35829 Long Neck, DE | 3.0 | 2.5 | 1500 | $1,995 | $1.33 | 13d | 1 | 0.71mi |
Listing history 16 events
-
2026-06-18days on market $179,000 Active 55 DOM
-
2026-06-17days on market $179,000 Active 54 DOM
-
2026-06-16days on market $179,000 Active 53 DOM
-
2026-06-15days on market $179,000 Active 52 DOM
-
2026-06-14days on market $179,000 Active 50 DOM
-
2026-06-13days on market $179,000 Active 49 DOM
-
2026-06-10days on market $179,000 Active 47 DOM
-
2026-06-09days on market $179,000 Active 46 DOM
-
2026-06-08days on market $179,000 Active 45 DOM
-
2026-06-07days on market $179,000 Active 44 DOM
-
2026-06-02days on market $179,000 Active 39 DOM
-
2026-06-01days on market $179,000 Active 38 DOM
-
2026-05-31days on market $179,000 Active 37 DOM
-
2026-05-30days on market $179,000 Active 36 DOM
-
2026-04-24$179,000 Active 2149-char remark
-
2026-04-23historical $179,000 2149-char remark
ⓘ Source: listings_history table (triggers on properties + properties_extension) + one-shot
backfill from property_details.listing_events for pre-trigger history.
Climate risk First Street
- Flood 5/10 Major FEMA zone X (unshaded) · 44% chance over 30 yrs
- Wildfire 1/10 Low
- Heat 8/10 Severe 7 d/yr ≥101°F today · 18 d/yr by 30 yrs out
- Wind 8/10 Severe 80% chance of damaging wind over 30 yrs
- Air quality 2/10 Low 1 unhealthy d/yr today · 1 by 30 yrs out
Nearby sold comps map
Loading sold comps map…
Walkable amenities ~0.75 mi
Loading nearby amenities…
Taxation est. · year 1
- Rental income
- $27,038
- − Mortgage interest
- −$10,027
- − Property taxes
- −$2,685
- − Insurance
- −$895
- − Repairs & maintenance
- −$2,163
- − Management
- −$2,163
- − Depreciation
- −$5,207
- Taxable income
- $3,897
- Est. tax owed @ 24.0%
- −$935
- After-tax cash flow
- $5,580/yr
For passive investors: Depreciation is non-cash, so a rental often shows a tax loss while cash-flowing — sheltering income. Rental losses are passive: they offset passive income freely, and up to $25,000/yr can offset ordinary (W-2) income if you actively participate and your MAGI is under $100k (phasing out to $0 by $150k); unused losses carry forward. On sale, claimed depreciation is recaptured at up to 25%, and gains may owe capital-gains tax (a 1031 exchange can defer both). Figures are a year-1 estimate at your 24.0% rate — not tax advice; consult a CPA.
Condition & rehab AI · 12 photos
This home is in good condition with a good condition score of 80. It has a cosmetic rehab level and requires minor maintenance such as painting the exterior siding and cleaning the gutters. The home's curb appeal and landscaping are well-maintained, making it an attractive property for both resale and rental.
Value-add opportunities
- Resale Paint exterior siding — Fresh paint can enhance the home's curb appeal and make it more attractive to potential buyers.
- Rental Clean gutters — Clean gutters improve drainage and prevent water damage, which is important for maintaining a property's value and appeal to renters.
Renovation cost estimate screening
Value-add ROI direction
- Resale Paint exterior siding — Fresh paint can enhance the home's curb appeal and make it more attractive to potential buyers. ↑
- Rental Clean gutters — Clean gutters improve drainage and prevent water damage, which is important for maintaining a property's value and appeal to renters. ↑
ⓘ Cost ranges are severity-bucket heuristics (US national rule-of-thumb). Get contractor quotes + a written scope before underwriting a rehab budget.
Schools (NCES district)
- District
- Indian River School District
- NCES district ID
- 1000680
- Math proficiency
- 25% ▼ -27.00%
- Reading proficiency
- 41% ▼ -17.00%
- Median HH income
- $53,838
- Composite
- 28.99/100
- National rank
- #6620
- State rank
- #14 of 26 in DE
Livability — Long Neck
- Score
- 69/100
- State rank
- #30
- US rank
- #8720
Category grades
Schools grade is shown separately in the Schools card above.
Census & demographics
- Census place
- Long Neck, DE
- County
- Sussex County · 82,708 people
- Metro
- Salisbury, MD-DE
- Population (ZIP)
- 35,884
- Household income
- $78,305
- Rent vs Own
- Severe rent burden
- 464.0
Population outlook (Sussex County) Hauer SSP2
- Today (2025)
- 248,853 people
- By 2030
- 264,464 · +6.3%
- By 2040
- 290,980 · +16.9%
- By 2050
- 311,259 · +25.1%
- By 2075
- 352,488 · +41.6%
- By 2100
- 367,406 · +47.6%
Race, ethnicity, and origin ACS 2023
- Neighborhood character
- Predominantly White (74%)
- Race & ethnicity
- White 74% Hispanic / Latino 11% Black 8% Two or more races 7% Native American 3% Asian 1%
- Hispanic origin (detail)
- Mexican 3%
- Common ancestry
- Romanian 4% Slovak 2% Serbian 1%
- Foreign-born
- 8% · Canada, China
- Languages at home
- 88% English-only · Spanish 9% Other Indo-European 1%
Political lean MEDSL · Sussex
- 2024 margin
- R (+11.0) · D 43.9% · R 54.9% · Other 1.2%
- 2008→2024 swing
- -2.4pp toward R · 2008: -8.6pp · 2024: -11.0pp
- All cycles
- 2024: R+11.0 2020: R+11.2 2016: R+22.0 2012: R+13.0 2008: R+8.6
Not yet ingested
- Civics
- —
Market trends
- HPI YoY
- ▼ -18.26%
- Current HPI
- 268.5609
- Rent YoY
- —
- Metro
- Salisbury, MD-DE
- State GDP YoY
- —
- F500 in state
- 0
Price history
+0.0% since first listed2 events — show timeline
- 2026-04-24 Listed $179,000 BRIGHT MLS
- 2026-04-23 Coming Soon $179,000 BRIGHT MLS
Cash-flow waterfall
monthlySold comps — $/sqft
last 12 mo · ≤1 miLoading sold comps…