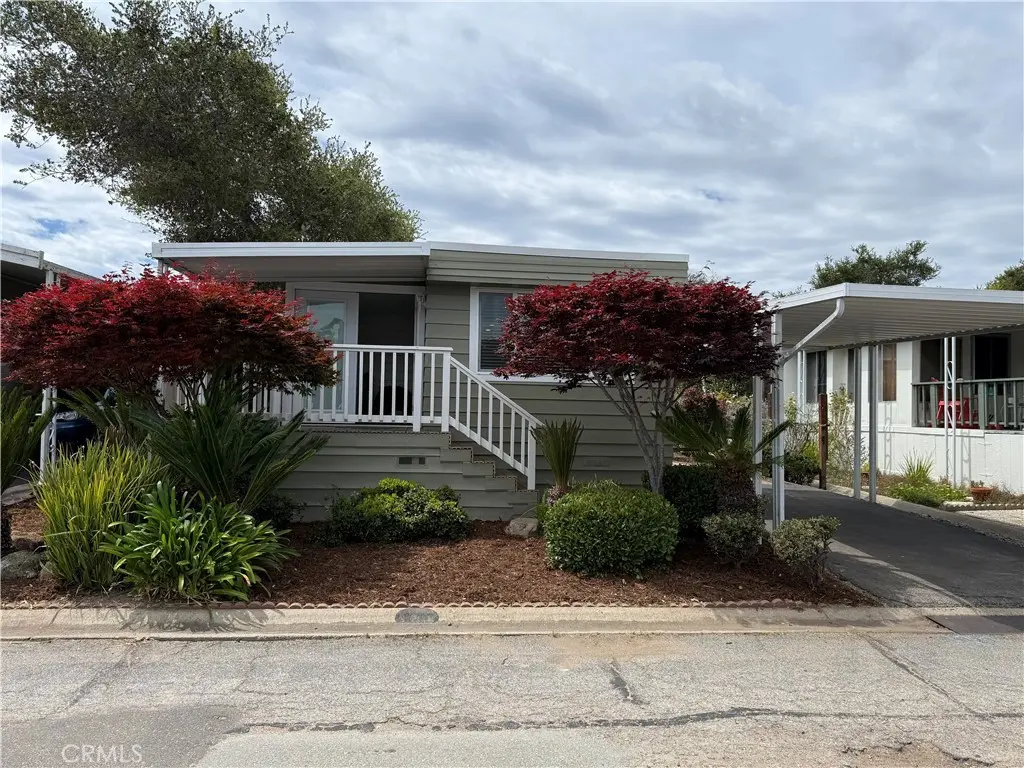
1675 Los Osos Valley Rd #125 · Los Osos, CA
Flood risk 1/10 · Minimal
- FEMA flood zone
- X (unshaded)
- Chance of flooding over 30 yrs
- 0.0%
- Est. flood insurance / yr
- $507 – $1,088
Fire risk 5/10 · Moderate
- Est. fire insurance / yr
- $659 – $1,223
Heat risk 3/10 · Minor
- Hot days now (above 80°F)
- 4 days/yr
- Hot days in 30 yrs
- 11 days/yr
Wind risk 1/10 · Minimal
- Chance of severe wind over 30 yrs
- —
Air-quality risk 6/10 · Moderate
- Unhealthy air days now
- 11 days/yr
- Unhealthy air days in 30 yrs
- 11 days/yr
Risk factors via First Street. Map © Google.
Why this score? — see what drove the C+ grade
The composite is a weighted blend of 9 inputs, each scored 0–100. Each bar is that input's sub-score; the figure is the points it added to the 100-point composite (weight × sub-score).
- Cash flow +26.3/30.0
- DSCR +8.9/10.0
- ARV discount +7.5/15.0
- 1% rule +7.0/10.0
- Schools +4.6/10.0
- Condition / age +4.0/5.0
- Livability +3.4/5.0
- Rent growth +2.5/5.0
- Appreciation +0.0/10.0
$149,900
🖨 Deal sheet 📄 Offer letter ✓ Due diligence
Listing remarks
An adorable turnkey home in the beautiful Sea Oaks Mobile home park in the Central Coast of California has just gone on the market! This home has been completely remodeled and what a beautiful job they have done. All new appliances, washer & dryer new kitchen, new roof, new flooring, new windows, custom wood finishes, new doors, new water heater, new front & side composite decks and all new drywall, paint & texture. French doors overlooking the landscaped front yard with Red Japanese Maple trees and assorted greenery. The heated pool and indoor hot tub are just a short walk away. The club house hosts weekly movies, bingo nights and boasts a large fireplace, game room and
Key facts
- Turnkey home
- New kitchen
- Completely remodeled
Tags
Property features AI
Finance
- Other: Sewer assessments
- Financial info: Land lease of $1,745 monthly (park provided)
- HOA & community: Senior community; Community amenities include pool, spa, barbecue/outdoor cooking area and picnic area; Community features include gutters, dog park, hiking and street lighting; Park name: Sea Oaks; Manager approval required for residency; Pets allowed: contact manager
Exterior
- Parking: Detached carport (2 carport spaces); Street parking
- Utilities: Public/District water; Public sewer and soils analysis septic
- Home design: Single-story mobile home (Homette model); Entry level 1; Mobile home remains in place; Turnkey condition
- Construction: 12 ft x 52 ft mobile dimensions
- Exterior features: Membrane roof; Wood fencing; Vinyl skirt; In-ground, fenced, heated community pool; One shed; Landscaped grounds; Close to clubhouse; Park nearby; Drip system sprinklers; Walkstreet
Interior
- Kitchen: Quartz counters; Garbage disposal; Microwave; Refrigerator; Vented exhaust fan; Free-standing gas range; Dishwasher; Water heater unit
- Flooring: Laminated flooring
- Bathrooms: One full bathroom with shower
- Interior features: Beamed ceilings; Double-pane windows; Front deck entry
- Laundry & utility: Washer included; Dryer included; Washer hookup; Gas dryer hookup; Interior laundry
Neighborhood map
What this means for you Summary
Snapshot
- This is a 1-bed/1.0-bath manufactured listed at $150k. Condition is rated good.
Deal economics
- At list price, monthly cash flow is $385 ($5k/yr) — positive.
- The deal already cash-flows at list — no discount required.
- Meets the 1% rule at list price ($2k rent vs $150k).
- Recommended offer: $145k (3.0% below list) — sets the bar for market timing.
- Cap rate 9.4% vs local median 1.7% in Los Osos — top-decile yield for the area; either an underpriced asset or a hidden risk that comps aren't pricing in. Stress-test before assuming the spread holds.
Location & tenants
- Location reads 68/100 on livability (#296 in CA) — a middle-class / working-renter tenant base. Strengths: employment A+, health & safety A-, schools B; Watch: commute D+, amenities F, cost of living F.
- San Luis Coastal Unified (urban): math 50% / reading 58% proficiency, ranked #118 of 517 in CA (top 23%) — acceptable for families but not a draw, mixed tenant base, ~2y average lease.
- Market conditions: 78 active listings in the ZIP; 1 comparable units currently listed for rent nearby; solid renter incomes; 1,104 units permitted in San Luis Obispo County in 2024 (273 in 5+ unit buildings).
Forward outlook
- Local home prices are declining (-3.0%/yr); year-one equity from $1k of loan paydown is wiped out by about $4k of value loss. Plan a longer hold.
- San Luis Obispo County population projected at +20% by 2050 — long-run rental-demand tailwind backs the buy-and-hold thesis.
- At projected returns (-3.0% appreciation + 3.0% rent growth), your $42k cash investment doubles in ~10 years — after that, you're playing with house money.
Negotiation context
- It's been on market 44 days — a 3% lower offer ($145k) is reasonable based on typical stale-listing flexibility.
Risks & watch-outs
- Climate carrying-cost: moderate wildfire risk — expect insurance premiums to compound above CPI over the hold.
Questions for the listing agent
- It's been on market 44 days. Have you received any prior offers? Is the seller open to a 3% concession, seller financing, or rate buy-down credit?
- Built in 1977 — when were the roof, HVAC, electrical panel, plumbing, and water heater last replaced?
- Is there a deadline driving the sale (1031 exchange, divorce, estate, relocation)? That informs how much negotiation room exists.
- Schools are B-rated — typically a magnet for longer-tenancy family renters. What's the average tenant stay here, and is there a school-zone premium baked into asking?
- What's the average days-on-market for RENTAL listings here right now (not sales)? A rising rental-DOM trend means longer vacancies and softer asking-rent achievability than the comps imply.
- What's the recent tenant-quality profile in this submarket — average credit score on applications, eviction rate, late-payment / NSF rate, and stable-employment percentage? A property-management company in the area should have these aggregated.
- How much new for-sale + rental construction is in the pipeline within 1–3 miles? Heavy new supply typically softens prices + rents 12–24 months out; constrained supply supports both.
Investment metrics
- 1% rule
- 1.20% ✓
- Cap rate
- 9.38%
- Cash-on-cash
- 11.02%
- DSCR
- 1.49
- GRM
- 6.9
CMA / ARV
- ARV (median comp)
- $350,378
- List price
- $149,900
- Delta
- -57.22%
- Verdict
- UNDERPRICED
- Comps
- 2 within 2.0 mi
Show comp detail 2 sales within ~0.75 mi
| Address | Dist | Beds/Ba | Sqft | Sold | Price | $/sf | Match |
|---|---|---|---|---|---|---|---|
| 1701 Los Osos Valley Rd #18 | 0.14mi | 2/1.0 (+1) | 660 (+6%) | 12mo | $140,000 | $212 | 69 |
| 1595 Los Osos Valley Rd Unit 42C | 0.14mi | 2/1.5 (+1) | 688 (+10%) | 2mo | $429,500 | $624 | 68 |
Match score weights: distance 35% · size 25% · config 20% · recency 20%. Top-matched comps best support the ARV.
Projected returns pro-forma
-3.0% appreciation · 3.0% rent growth · sell at horizon
- IRR
- 0.2%
- Equity multiple
- 1.01×
- Total profit
- $280
- Equity at exit
- $22,351
- IRR
- 9.8%
- Equity multiple
- 1.76×
- Total profit
- $31,957
- Equity at exit
- $12,961
Cash invested: $41,972 (down + closing). Projections, not guarantees.
Landlord ↔ Tenant lean methodology
- Overall (STATE)
- 18 Strongly Tenant-Friendly
- State California
- 18 Strongly Tenant-Friendly · D+13
- County
- — inherits STATE
- City
- — inherits STATE
ZIP-level market 93402
- Active inventory
- 78
- Price-to-rent
- 6.9×
Monthly cashflow live
- Estimated rent
- $1,799 medium interval (Pro) →
- Mortgage (P&I)
- −$786
- Tax est. 1.5%
- −$187 /mo · $2,248/yr
- Insurance
- −$62
- HOA
- −$0
- Vacancy / Maint / Mgmt
- −$378
- Net cashflow
- $385
Break-even live
UW: 25.0% down · 7.5% · 30yr · 1.5% tax · 5.0% vac · 8.0% maint · 8.0% mgmt
Financing live
Cash to close
- Down payment
- $37,475
- Closing costs
- $4,497
- Reserves months
- —
- Total cash needed
- —
Loan-product check · same deal, 3 products live
Conventional
25% down · 7.5% · 30yr
- Down + closing
- —
- Monthly P&I
- —
- Monthly cashflow
- —
- DSCR
- —
- Eligible?
- —
Personal DTI + credit; lowest rate.
DSCR
20% down · 8.5% · 30yr
- Down + closing
- —
- Monthly P&I
- —
- Monthly cashflow
- —
- DSCR
- —
- Eligible?
- —
No personal income docs; deal must DSCR.
Hard money
10% down · 12.0% · 12mo
- Down + closing
- —
- Monthly P&I
- —
- Monthly cashflow
- —
- DSCR
- —
- Eligible?
- —
Short-term bridge; refi at stabilization.
Rent comps 1 comps
| Address | Beds | Baths | Sqft | Rent | $/sqft | DOM | Units | Dist |
|---|---|---|---|---|---|---|---|---|
| 910 Santa Ynez Ave Los Osos, CA | 1.0 | 1.0 | 400 | $1,500 | $3.75 | 13d | 1 | 1.07mi |
Listing history 16 events
-
2026-06-18days on market $149,900 Active 44 DOM
-
2026-06-17days on market $149,900 Active 43 DOM
-
2026-06-16days on market $149,900 Active 42 DOM
-
2026-06-15days on market $149,900 Active 41 DOM
-
2026-06-14days on market $149,900 Active 39 DOM
-
2026-06-13days on market $149,900 Active 38 DOM
-
2026-06-10days on market $149,900 Active 36 DOM
-
2026-06-09days on market $149,900 Active 35 DOM
-
2026-06-08pricedays on market $149,900 Active 34 DOM
-
2026-06-07days on market $174,900 Active 33 DOM
-
2026-06-03days on market $174,900 Active 29 DOM
-
2026-06-02days on market $174,900 Active 28 DOM
-
2026-06-01days on market $174,900 Active 27 DOM
-
2026-05-31days on market $174,900 Active 26 DOM
-
2026-05-30days on market $174,900 Active 25 DOM
-
2026-05-05$225,000 Active 1129-char remark
ⓘ Source: listings_history table (triggers on properties + properties_extension) + one-shot
backfill from property_details.listing_events for pre-trigger history.
Climate risk First Street
- Flood 1/10 Low FEMA zone X (unshaded) · 0% chance over 30 yrs
- Wildfire 5/10 Major
- Heat 3/10 Moderate 4 d/yr ≥80°F today · 11 d/yr by 30 yrs out
- Wind 1/10 Low
- Air quality 6/10 Major 11 unhealthy d/yr today · 11 by 30 yrs out
Nearby sold comps map
Loading sold comps map…
Walkable amenities ~0.75 mi
Loading nearby amenities…
Taxation est. · year 1
- Rental income
- $21,589
- − Mortgage interest
- −$8,397
- − Property taxes
- −$2,248
- − Insurance
- −$750
- − Repairs & maintenance
- −$1,727
- − Management
- −$1,727
- − Depreciation
- −$4,361
- Taxable income
- $2,379
- Est. tax owed @ 24.0%
- −$571
- After-tax cash flow
- $4,053/yr
For passive investors: Depreciation is non-cash, so a rental often shows a tax loss while cash-flowing — sheltering income. Rental losses are passive: they offset passive income freely, and up to $25,000/yr can offset ordinary (W-2) income if you actively participate and your MAGI is under $100k (phasing out to $0 by $150k); unused losses carry forward. On sale, claimed depreciation is recaptured at up to 25%, and gains may owe capital-gains tax (a 1031 exchange can defer both). Figures are a year-1 estimate at your 24.0% rate — not tax advice; consult a CPA.
Condition & rehab AI · 15 photos
This turnkey home in Sea Oaks Mobile Home Park has been completely remodeled with new appliances, flooring, windows, and more, making it move-in ready.
Value-add opportunities
- Both landscaping — enhances curb appeal and adds value
- Both exterior paint — fresh paint can improve curb appeal and value
- Both interior paint — fresh paint can improve curb appeal and value
Renovation cost estimate screening
Value-add ROI direction
- Both landscaping — enhances curb appeal and adds value ↑
- Both exterior paint — fresh paint can improve curb appeal and value ↑
- Both interior paint — fresh paint can improve curb appeal and value ↑
ⓘ Cost ranges are severity-bucket heuristics (US national rule-of-thumb). Get contractor quotes + a written scope before underwriting a rehab budget.
Schools (NCES district)
- District
- San Luis Coastal Unified
- NCES district ID
- 0634800
- Math proficiency
- 50% ▼ -14.00%
- Reading proficiency
- 58% ▼ -12.00%
- Median HH income
- $53,428
- Composite
- 46.4/100
- National rank
- #2455
- State rank
- #118 of 517 in CA
Livability — Los Osos
- Score
- 68/100
- State rank
- #296
- US rank
- #9911
Category grades
Schools grade is shown separately in the Schools card above.
Census & demographics
- Census place
- Los Osos, CA
- County
- San Luis Obispo County · 224,651 people
- City population
- 14,197
- Metro
- San Luis Obispo-Paso Robles, CA
- Population (ZIP)
- 14,197
- Household income
- $109,090
- Rent vs Own
- Severe rent burden
- 367.0
Population outlook (San Luis Obispo County) Hauer SSP2
- Today (2025)
- 306,977 people
- By 2030
- 320,378 · +4.4%
- By 2040
- 343,933 · +12.0%
- By 2050
- 366,853 · +19.5%
- By 2075
- 428,329 · +39.5%
- By 2100
- 460,687 · +50.1%
Race, ethnicity, and origin ACS 2023
- Neighborhood character
- Predominantly White (73%)
- Race & ethnicity
- White 73% Hispanic / Latino 19% Two or more races 11% Asian 4%
- Hispanic origin (detail)
- Mexican 17%
- Common ancestry
- Slovak 4% Italian 4% Lithuanian 3%
- Foreign-born
- 7% · Canada, China
- Languages at home
- 88% English-only · Spanish 7% Tagalog/Filipino 2% German/W. Germanic 1%
Political lean MEDSL · San Luis Obispo
- 2024 margin
- D (+10.9) · D 53.9% · R 43.1% · Other 3.0%
- 2008→2024 swing
- +5.5pp toward D · 2008: 5.4pp · 2024: 10.9pp
- All cycles
- 2024: D+10.9 2020: D+13.1 2016: D+8.3 2012: D+1.0 2008: D+5.4
Not yet ingested
- Civics
- —
Market trends
- HPI YoY
- ▼ -868.24%
- Current HPI
- 384.6658
- Rent YoY
- —
- Metro
- San Luis Obispo-Paso Robles, CA
- State GDP YoY
- ▲ 3.21%
- F500 in state
- 116
Industry mix (Fortune 500 HQ in CA)
| Industry | F500 HQs | Revenue |
|---|---|---|
| Technology | 27 | $1,492B |
|
||
| Financial Services | 3 | $174B |
|
||
| Retail | 3 | $44B |
|
||
| Insurance | 3 | $26B |
|
||
| Media / Entertainment | 2 | $115B |
|
||
| Pharmaceuticals / Biotech | 2 | $62B |
|
||
Price history
-33.4% since first listed3 events — show timeline
- 2026-06-07 Price Changed $149,900 CRMLS
- 2026-05-19 Price Changed $174,900 CRMLS
- 2026-05-05 Listed $225,000 CRMLS
Cash-flow waterfall
monthlySold comps — $/sqft
last 12 mo · ≤1 miLoading sold comps…