2147 Mercer University Dr · Macon-Bibb County, GA
Flood risk 1/10 · Minimal
- FEMA flood zone
- X (unshaded)
- Chance of flooding over 30 yrs
- 0.0%
- Est. flood insurance / yr
- $507 – $1,088
Fire risk 1/10 · Minimal
- Est. fire insurance / yr
- $963 – $1,789
Heat risk 7/10 · Major
- Hot days now (above 108°F)
- 7 days/yr
- Hot days in 30 yrs
- 17 days/yr
Wind risk 6/10 · Moderate
- Chance of severe wind over 30 yrs
- 65.0%
Air-quality risk 3/10 · Minor
- Unhealthy air days now
- 3 days/yr
- Unhealthy air days in 30 yrs
- 4 days/yr
Risk factors via First Street. Map © Google.
Why this score? — see what drove the B- grade
The composite is a weighted blend of 9 inputs, each scored 0–100. Each bar is that input's sub-score; the figure is the points it added to the 100-point composite (weight × sub-score).
- Cash flow +30.0/30.0
- 1% rule +10.0/10.0
- DSCR +10.0/10.0
- ARV discount +7.7/15.0
- Rent growth +3.7/5.0
- Livability +2.5/5.0
- Condition / age +2.5/5.0
- Schools +1.2/10.0
- Appreciation +0.0/10.0
$49,900
🖨 Deal sheet 📄 Offer letter ✓ Due diligence
Listing remarks MLS
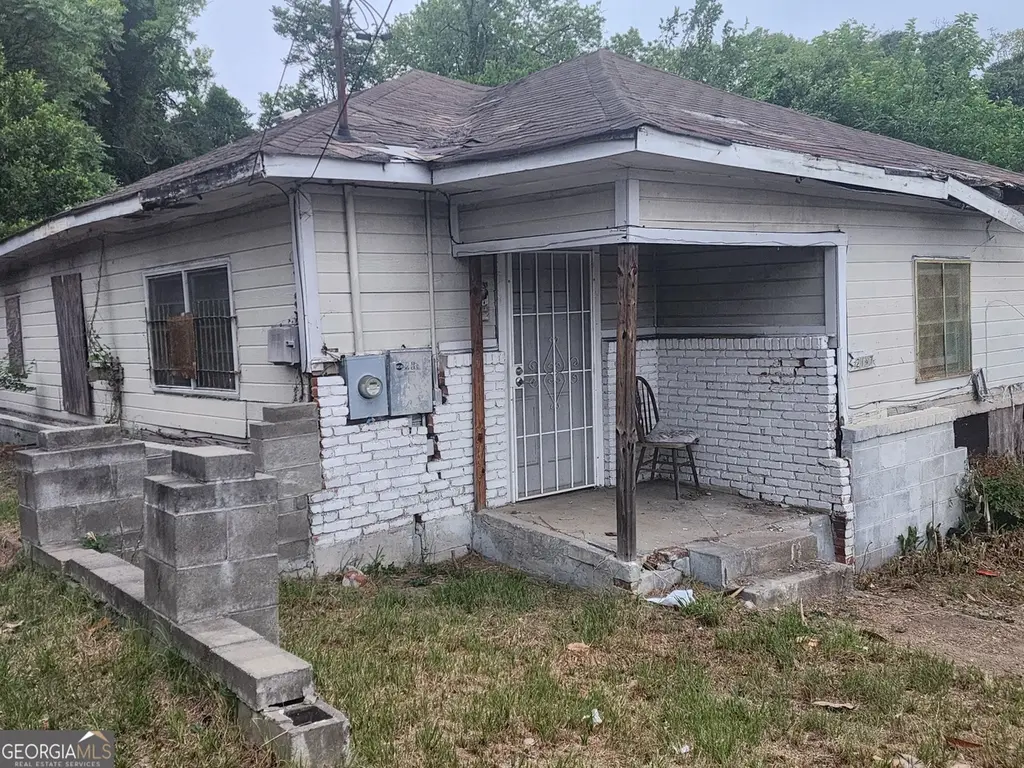
Great Speculative Buy! Investors this is a property that is a stone throw from I-75, very close vicinity to the Mercer University educational institution. Located next door to another property on the market for sale. It awaits a buyer with a vision of multi-housing, commercial probabilities, etc.
Key facts
- 0.24 acre lot
- Built 1900
- Listed 51 days
Tags
Property features AI
Finance
- Other: Lot size approximately 0.24 acres
- HOA & community: No HOA
Exterior
- Parking: Off-street parking
- Utilities: Public water; Public sewer (connected); Electricity available; Natural gas available; Cable available; High-speed internet available; Phone available
- Home design: Single-family house; Resale property; One story
- Construction: Brick construction; Composition roof; Built in 1900
- Exterior features: Level city lot
Interior
- Kitchen: No specific kitchen appliance details provided
- Bedrooms: 2 bedrooms on the main level
- Flooring: Other flooring
- Bathrooms: 1 full bathroom on the main level
- Heating & cooling: Central heating; Central air conditioning
- Interior features: One-level living; Den
- Laundry & utility: Laundry area designated as 'Other'
Neighborhood map
What this means for you Summary
Snapshot
- This is a 2-bed/1.0-bath single-family listed at $50k.
Deal economics
- At list price, monthly cash flow is $467 ($6k/yr) — positive.
- The deal already cash-flows at list — no discount required.
- Meets the 1% rule at list price ($977 rent vs $50k).
- Recommended offer: $48k (3.0% below list) — sets the bar for market timing.
- Cap rate 17.5% vs local median 5.4% in Macon-Bibb County — top-decile yield for the area; either an underpriced asset or a hidden risk that comps aren't pricing in. Stress-test before assuming the spread holds.
Location & tenants
- Location reads: area grade B — affects rentability + tenant quality, not the cash-flow math above.
- Bibb County (urban): math 11% / reading 18% proficiency, ranked #161 of 174 in GA (top 92%) — low school quality limits family demand, transient renter base, plan for 1-2y turnover; 75% free/reduced lunch — lower-income household profile, screen leases tightly.
- Zoned schools: Hartley Elementary School (math 2% / reading 2%, grade F, #1,204 of 1,228 statewide, top 100%, 438 students, 100% FRL); Southwest High School (math 2% / reading 17%, grade F, #365 of 424 statewide, top 88%, 800 students, 100% FRL) — zoned schools average 100% FRL vs 75% district-wide (25 pts higher); higher-poverty schools than district average — tighter screening recommended.
- Market conditions: Rents rising fast (+4.6%/yr); 255 active listings in the ZIP; 40 comparable units currently listed for rent nearby; rentals lingering (median 44d on market — plan ~5-8 weeks vacancy on turnover, expect pricing pressure); 60% of comp listings sitting > 30 days — soft ceiling on asking rent; lower-income renter base — watch delinquency; 154 units permitted in Bibb County in 2024 (0 in 5+ unit buildings).
- This rent runs 30% of the median local income ($39k/yr) — at the standard rent-burdened threshold; future hikes will face affordability resistance.
Forward outlook
- Local home prices are declining (-3.0%/yr); year-one equity from $345 of loan paydown is wiped out by about $1k of value loss. Plan a longer hold.
- Bibb County population projected at -12% by 2050 — secular population decline; favor cash flow + early exit over multi-decade hold.
- At projected returns (-3.0% appreciation + 4.6% rent growth), your $14k cash investment doubles in ~3 years — after that, you're playing with house money.
Negotiation context
- It's been on market 52 days — a 3% lower offer ($48k) is reasonable based on typical stale-listing flexibility.
- 3 sale attempts; this cycle's ask has dropped $19k (28%) from the opening price — seller is motivated, your offer sets the floor, not the list.
Risks & watch-outs
- Watch-outs: built in 1900 — expect roof / HVAC / electrical / plumbing capex.
- Climate carrying-cost: major wind risk, 65% chance of damaging wind over 30y; extreme-heat days projected 7→17/yr by 2055 (HVAC capex compounding) — expect insurance premiums to compound above CPI over the hold.
Questions for the listing agent
- It's been on market 52 days. Have you received any prior offers? Is the seller open to a 3% concession, seller financing, or rate buy-down credit?
- Built in 1900 — when were the roof, HVAC, electrical panel, plumbing, and water heater last replaced?
- Is there a deadline driving the sale (1031 exchange, divorce, estate, relocation)? That informs how much negotiation room exists.
- What's the average days-on-market for RENTAL listings here right now (not sales)? A rising rental-DOM trend means longer vacancies and softer asking-rent achievability than the comps imply.
- What's the recent tenant-quality profile in this submarket — average credit score on applications, eviction rate, late-payment / NSF rate, and stable-employment percentage? A property-management company in the area should have these aggregated.
- How much new for-sale + rental construction is in the pipeline within 1–3 miles? Heavy new supply typically softens prices + rents 12–24 months out; constrained supply supports both.
Investment metrics
- 1% rule
- 1.96% ✓
- Cap rate
- 17.52%
- Cash-on-cash
- 40.09%
- DSCR
- 2.78
- GRM
- 4.3
CMA / ARV
- ARV (median comp)
- $50,130
- List price
- $49,900
- Delta
- -0.46%
- Verdict
- FAIR
- Comps
- 20 within 1.0 mi
Show comp detail 10 sales within ~0.75 mi
| Address | Dist | Beds/Ba | Sqft | Sold | Price | $/sf | Match |
|---|---|---|---|---|---|---|---|
| 742 Grayson Ave | 0.63mi | 3/1.0 (+1) | 840 (+1%) | 3mo | $22,500 | $27 | 61 |
| 730 Grayson Ave | 0.62mi | 3/1.0 (+1) | 852 (+3%) | 3mo | $44,000 | $52 | 58 |
| 344 Blossom Ave | 0.31mi | 3/1.0 (+1) | 936 (+13%) | 4mo | $135,000 | $144 | 56 |
| 2332 Ballard Pl | 0.71mi | 2/1.0 | 868 (+5%) | 14mo | $25,000 | $29 | 47 |
| 2278 Ballard Pl | 0.66mi | 3/1.0 (+1) | 868 (+5%) | 14mo | $25,000 | $29 | 44 |
| 2288 Ballard Pl | 0.68mi | 3/1.0 (+1) | 868 (+5%) | 17mo | $30,000 | $35 | 41 |
| 2282 Ballard Pl | 0.67mi | 3/1.0 (+1) | 868 (+5%) | 22mo | $35,000 | $40 | 37 |
| 330 Hortman Ave | 0.63mi | 3/1.0 (+1) | 919 (+11%) | 14mo | $65,982 | $72 | 36 |
| 2324 Ballard Pl | 0.70mi | 3/1.0 (+1) | 868 (+5%) | 23mo | $57,000 | $66 | 35 |
| 703 Edwards Ave | 0.67mi | 3/1.0 (+1) | 932 (+13%) | 9mo | $105,000 | $113 | 35 |
Match score weights: distance 35% · size 25% · config 20% · recency 20%. Top-matched comps best support the ARV.
Projected returns pro-forma
-3.0% appreciation · 4.61% rent growth · sell at horizon
- IRR
- 38.2%
- Equity multiple
- 2.66×
- Total profit
- $23,238
- Equity at exit
- $7,440
- IRR
- 45.4%
- Equity multiple
- 5.67×
- Total profit
- $65,290
- Equity at exit
- $4,314
Cash invested: $13,972 (down + closing). Projections, not guarantees.
Landlord ↔ Tenant lean methodology
- Overall (STATE)
- 90 Strongly Landlord-Friendly
- State Georgia
- 90 Strongly Landlord-Friendly · R+3
- County
- — inherits STATE
- City
- — inherits STATE
ZIP-level market 31204
- Rents YoY
- 4.6%
- Active inventory
- 255
- Price-to-rent
- 4.3×
Monthly cashflow live
- Estimated rent
- $977 high interval (Pro) →
- Mortgage (P&I)
- −$262
- Tax from tax record
- −$22 /mo · $267/yr
- Insurance
- −$21
- HOA
- −$0
- Vacancy / Maint / Mgmt
- −$205
- Net cashflow
- $467
Break-even live
UW: 25.0% down · 7.5% · 30yr · 1.5% tax · 5.0% vac · 8.0% maint · 8.0% mgmt
Financing live
Cash to close
- Down payment
- $12,475
- Closing costs
- $1,497
- Reserves months
- —
- Total cash needed
- —
Loan-product check · same deal, 3 products live
Conventional
25% down · 7.5% · 30yr
- Down + closing
- —
- Monthly P&I
- —
- Monthly cashflow
- —
- DSCR
- —
- Eligible?
- —
Personal DTI + credit; lowest rate.
DSCR
20% down · 8.5% · 30yr
- Down + closing
- —
- Monthly P&I
- —
- Monthly cashflow
- —
- DSCR
- —
- Eligible?
- —
No personal income docs; deal must DSCR.
Hard money
10% down · 12.0% · 12mo
- Down + closing
- —
- Monthly P&I
- —
- Monthly cashflow
- —
- DSCR
- —
- Eligible?
- —
Short-term bridge; refi at stabilization.
Rent comps 40 comps
| Address | Beds | Baths | Sqft | Rent | $/sqft | DOM | Units | Dist |
|---|---|---|---|---|---|---|---|---|
| 424 Pansy Ave Macon, GA | 2.0 | 1.0 | 810 | $850 | $1.05 | 43d | 1 | 0.39mi |
| 2349 Mason St Macon, GA | 1.0 | 1.0 | 552 | $625 | $1.13 | 43d | 1 | 0.56mi |
| 668 Grosso Ave Unit A Macon, GA | 2.0 | 1.0 | 650 | $750 | $1.15 | 21d | 1 | 0.57mi |
| 2585 Napier Ave Unit B Macon, GA | 2.0 | 2.0 | 644 | $850 | $1.32 | 21d | 1 | 0.72mi |
| 1463 Bankston Ave Macon, GA | 2.0 | 1.0 | 960 | $950 | $0.99 | 43d | 1 | 0.72mi |
| 2445 Lowe St Macon, GA | 2.0 | 1.0 | 940 | $890 | $0.95 | 43d | 1 | 0.74mi |
| 1249 Duncan Ave Unit B Macon, GA | 2.0 | 2.0 | 700 | $1,095 | $1.56 | 43d | 1 | 0.83mi |
| 1249 Duncan Ave Unit C Macon, GA | 2.0 | 2.0 | 900 | $795 | $0.88 | 43d | 1 | 0.83mi |
| 806 Armory Dr Unit B Macon, GA | 3.0 | 1.0 | 1100 | $975 | $0.89 | 43d | 1 | 0.84mi |
| 3034 Churchill St Macon, GA | 2.0 | 1.0 | 872 | $900 | $1.03 | 21d | 1 | 0.91mi |
| 771 Harold St Macon, GA | 2.0 | 1.0 | 950 | $1,250 | $1.32 | 13d | 1 | 0.92mi |
| 672 Bowden St Macon, GA | 2.0 | 1.0 | 1076 | $900 | $0.84 | 21d | 1 | 0.97mi |
| 663 Williams St Macon, GA | 3.0 | 1.0 | 911 | $980 | $1.08 | 43d | 1 | 1.05mi |
| 832 Elm St Macon, GA | 3.0 | 2.0 | 1121 | $1,175 | $1.05 | 43d | 1 | 1.10mi |
| 260 Ryals Ave Macon, GA | 2.0 | 1.0 | 690 | $875 | $1.27 | 43d | 1 | 1.17mi |
| 1089 Brisbane St Macon, GA | 3.0 | 1.0 | 816 | $1,075 | $1.32 | 13d | 1 | 1.19mi |
| 2056 Vineville Ave Unit 25 Macon, GA | 1.0 | 1.0 | 621 | $825 | $1.33 | 13d | 1 | 1.20mi |
| 864 Tattnall St Macon, GA | 2.0 | 1.0 | 640 | $800 | $1.25 | 43d | 1 | 1.20mi |
| 1020 Radio Dr Macon, GA | 2.0 | 1.0 | 850 | $889 | $1.05 | 43d | 1 | 1.20mi |
| 1596 Burton Ave Macon, GA | 3.0 | 1.0 | 1117 | $895 | $0.80 | 13d | 1 | 1.21mi |
| 2350 English Ave Apt 3D Macon, GA | 3.0 | 1.5 | 980 | $1,095 | $1.12 | 43d | 1 | 1.21mi |
| 1121 Columbus St Unit A Macon, GA | 1.0 | 1.0 | 900 | $1,250 | $1.39 | 13d | 1 | 1.22mi |
| 2020 Vineville Ave Apt 31 Macon, GA | 1.0 | 1.0 | 550 | $800 | $1.45 | 13d | 1 | 1.23mi |
| 185 Oak Haven Ave Apt A4 Macon, GA | 3.0 | 2.0 | 1100 | $1,200 | $1.09 | 21d | 1 | 1.28mi |
| 1782 Eveline Ave Macon, GA | 3.0 | 1.0 | 900 | $1,050 | $1.17 | 43d | 1 | 1.29mi |
| 3080 Rice Mill Rd Unit C-1 Macon, GA | 3.0 | 1.5 | 1100 | $925 | $0.84 | 21d | 1 | 1.29mi |
| 3080 Rice Mill Rd Macon, GA | 3.0 | 1.0 | 1100 | $950 | $0.86 | 43d | 1 | 1.29mi |
| 3080 Rice Mill Rd Unit M-5 Macon, GA | 1.0 | 1.0 | 875 | $750 | $0.86 | 43d | 1 | 1.29mi |
| 1975 Vineville Ave Apt F3 Macon, GA | 1.0 | 1.0 | 950 | $700 | $0.74 | 13d | 1 | 1.32mi |
| 1975 Vineville Ave Macon, GA | 1.0–3.0 | 1.0 | 1050 | $825 | $0.79 | 21d | 5 | 1.33mi |
| 132 Oak Haven Ave Macon, GA | 2.0 | 1.0 | 720 | $975 | $1.35 | 43d | 1 | 1.37mi |
| 455 Pursley St Apt B15 Macon, GA | 1.0 | 1.0 | 850 | $650 | $0.76 | 13d | 1 | 1.37mi |
| 455 Pursley St Macon, GA | 1.0 | 1.0 | 850 | $625 | $0.74 | 21d | 9 | 1.37mi |
| 3149 Somerset Dr Macon, GA | 2.0 | 1.0 | 897 | $745 | $0.83 | 43d | 1 | 1.39mi |
| 867 Orange Ter #2 Macon, GA | 2.0 | 1.0 | 1088 | $1,500 | $1.38 | 43d | 1 | 1.42mi |
| 867 Orange Ter Unit B Macon, GA | 2.0 | 2.0 | 1088 | $1,400 | $1.29 | 43d | 1 | 1.42mi |
| 2755 Vineville Ave Unit B Macon, GA | 3.0 | 2.0 | 900 | $1,375 | $1.53 | 43d | 1 | 1.44mi |
| 2763 Vineville Ave Macon, GA | 1.0 | 1.0 | 900 | $900 | $1.00 | 43d | 1 | 1.45mi |
| 130 Calloway Dr Macon, GA | 2.0 | 2.0 | 950 | $950 | $1.00 | 43d | 1 | 1.47mi |
| 614 Cleveland St Macon, GA | 1.0 | 1.0 | 650 | $800 | $1.23 | 43d | 1 | 1.48mi |
Listing history 18 events
-
2026-06-19days on market $49,900 Active 52 DOM
-
2026-06-18days on market $49,900 Active 51 DOM
-
2026-06-17days on market $49,900 Active 50 DOM
-
2026-06-16days on market $49,900 Active 49 DOM
-
2026-06-15days on market $49,900 Active 48 DOM
-
2026-06-14days on market $49,900 Active 46 DOM
-
2026-06-13days on market $49,900 Active 45 DOM
-
2026-06-10days on market $49,900 Active 43 DOM
-
2026-06-09days on market $49,900 Active 42 DOM
-
2026-06-09days on market $49,900 Active 41 DOM
-
2026-06-07days on market $49,900 Active 40 DOM
-
2026-06-03days on market $49,900 Active 36 DOM
-
2026-06-02days on market $49,900 Active 35 DOM
-
2026-06-01days on market $49,900 Active 34 DOM
-
2026-05-31days on market $49,900 Active 33 DOM
-
2026-05-30days on market $49,900 Active 32 DOM
-
2026-04-28$49,900 Active
-
2026-04-26$49,900 New 302-char remark
ⓘ Source: listings_history table (triggers on properties + properties_extension) + one-shot
backfill from property_details.listing_events for pre-trigger history.
Tax reassessment forecast GA · Resets to sale price
- Current annual tax
- $267 · $22/mo
- Projected year-2 tax
- $459 · $38/mo
- Expected delta
- +$192/yr (+$16/mo · 71.7%)
ⓘ Screening estimate from a state-policy table — verify with the county assessor before closing.
Climate risk First Street
- Flood 1/10 Low FEMA zone X (unshaded) · 0% chance over 30 yrs
- Wildfire 1/10 Low
- Heat 7/10 Severe 7 d/yr ≥108°F today · 17 d/yr by 30 yrs out
- Wind 6/10 Major 65% chance of damaging wind over 30 yrs
- Air quality 3/10 Moderate 3 unhealthy d/yr today · 4 by 30 yrs out
Nearby sold comps map
Loading sold comps map…
Walkable amenities ~0.75 mi
Loading nearby amenities…
Taxation est. · year 1
- Rental income
- $11,719
- − Mortgage interest
- −$2,795
- − Property taxes
- −$267
- − Insurance
- −$250
- − Repairs & maintenance
- −$938
- − Management
- −$938
- − Depreciation
- −$1,452
- Taxable income
- $5,080
- Est. tax owed @ 24.0%
- −$1,219
- After-tax cash flow
- $4,382/yr
For passive investors: Depreciation is non-cash, so a rental often shows a tax loss while cash-flowing — sheltering income. Rental losses are passive: they offset passive income freely, and up to $25,000/yr can offset ordinary (W-2) income if you actively participate and your MAGI is under $100k (phasing out to $0 by $150k); unused losses carry forward. On sale, claimed depreciation is recaptured at up to 25%, and gains may owe capital-gains tax (a 1031 exchange can defer both). Figures are a year-1 estimate at your 24.0% rate — not tax advice; consult a CPA.
Schools (NCES district)
- District
- Bibb County
- NCES district ID
- 1300420
- Math proficiency
- 11% ▼ -14.00%
- Reading proficiency
- 18% ▼ -11.00%
- Median HH income
- $37,426
- Composite
- 12.13/100
- National rank
- #9654
- State rank
- #161 of 174 in GA
Livability — Macon-Bibb County
No livability data for this city. (Only ~50 U.S. cities are tracked.)
Census & demographics
- Census place
- Macon-Bibb County, GA
- County
- Bibb County · 164,332 people
- City population
- 143,186
- Metro
- Macon-Bibb County, GA
- Population (ZIP)
- 32,421
- Household income
- $38,784
- Rent vs Own
- Severe rent burden
- 2674.0
Population outlook (Bibb County) Hauer SSP2
- Today (2025)
- 148,772 people
- By 2030
- 145,904 · -1.9%
- By 2040
- 139,404 · -6.3%
- By 2050
- 131,603 · -11.5%
- By 2075
- 111,050 · -25.4%
- By 2100
- 83,346 · -44.0%
Race, ethnicity, and origin ACS 2023
- Neighborhood character
- Predominantly Black (65%)
- Race & ethnicity
- Black 65% White 28% Hispanic / Latino 3% Two or more races 2% Asian 1%
- Common ancestry
- Serbian 2% Slovak 1% Lithuanian 1%
- Foreign-born
- 2% · Canada
- Languages at home
- 96% English-only · Spanish 2% French/Haitian/Cajun 1%
Political lean MEDSL · Bibb
- 2024 margin
- Strong D (+22.4) · D 61.0% · R 38.5%
- 2008→2024 swing
- +4.4pp toward D · 2008: 18.0pp · 2024: 22.4pp
- All cycles
- 2024: D+22.4 2020: D+23.8 2016: D+20.2 2012: D+20.0 2008: D+18.0
Not yet ingested
- Civics
- —
Market trends
- HPI YoY
- ▼ -135.44%
- Current HPI
- 194.5459
- Rent YoY
- ▲ 4.61%
- Metro
- Macon-Bibb County, GA
- State GDP YoY
- ▲ 2.66%
- F500 in state
- 28
Industry mix (Fortune 500 HQ in GA)
| Industry | F500 HQs | Revenue |
|---|---|---|
| Paper / Packaging | 2 | $29B |
|
||
| Retail | 1 | $160B |
|
||
| Transportation / Logistics | 1 | $91B |
|
||
| Airlines | 1 | $62B |
|
||
| Consumer Goods | 1 | $47B |
|
||
| Utilities | 1 | $25B |
|
||
Price history
+38.3% since first listed3 events — show timeline
- 2026-04-30 Listed $69,000 CGMLS
- 2026-04-28 Listed $49,900 MGMLS
- 2026-04-26 Listed $49,900 GAMLS
Property tax history
+4.7%/yrLatest (2025): $267 · -1.3% YoY. Source: county tax records.
Cash-flow waterfall
monthlySold comps — $/sqft
last 12 mo · ≤1 miLoading sold comps…