2608 Millerfield Rd · Macon-Bibb County, GA
Flood risk 1/10 · Minimal
- FEMA flood zone
- X (unshaded)
- Chance of flooding over 30 yrs
- 0.0%
- Est. flood insurance / yr
- $507 – $1,088
Fire risk 3/10 · Minor
- Est. fire insurance / yr
- $963 – $1,789
Heat risk 7/10 · Major
- Hot days now (above 107°F)
- 7 days/yr
- Hot days in 30 yrs
- 17 days/yr
Wind risk 6/10 · Moderate
- Chance of severe wind over 30 yrs
- 66.0%
Air-quality risk 4/10 · Minor
- Unhealthy air days now
- 4 days/yr
- Unhealthy air days in 30 yrs
- 4 days/yr
Risk factors via First Street. Map © Google.
Why this score? — see what drove the C- grade
The composite is a weighted blend of 9 inputs, each scored 0–100. Each bar is that input's sub-score; the figure is the points it added to the 100-point composite (weight × sub-score).
- Cash flow +15.0/30.0
- ARV discount +7.5/15.0
- Appreciation +7.2/10.0
- 1% rule +5.0/10.0
- DSCR +5.0/10.0
- Rent growth +5.0/5.0
- Livability +2.5/5.0
- Condition / age +2.5/5.0
- Schools +1.2/10.0
$20,000
🖨 Deal sheet 📄 Offer letter ✓ Due diligence
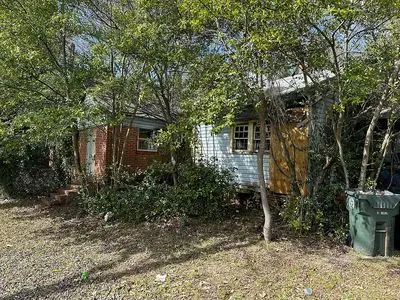
Listing remarks
As-is estate property with 1.59 acres in Macon. This 2-bedroom, 1-bath home sits on a generously sized lot and is being sold strictly as-is. The home is in very poor condition, has been vacant, and will need substantial repairs. Property may be best suited for an investor, contractor, or buyer looking for a land-value or redevelopment opportunity. Seller will make no repairs or improvements. Great potential for someone with vision.
Key facts
- 1.59 acres
- Generously sized lot
- Great potential
Tags
Neighborhood map
What this means for you Summary
Snapshot
- This is a 2-bed/1.0-bath single-family listed at $20k.
Deal economics
- At list price, monthly cash flow is $759 ($9k/yr) — positive.
- The deal already cash-flows at list — no discount required.
- Meets the 1% rule at list price ($1k rent vs $20k).
- Recommended offer: $19k (3.0% below list) — sets the bar for market timing.
- Cap rate 51.8% vs local median 5.4% in Macon-Bibb County — top-decile yield for the area; either an underpriced asset or a hidden risk that comps aren't pricing in. Stress-test before assuming the spread holds.
Location & tenants
- Location reads: area grade C — affects rentability + tenant quality, not the cash-flow math above.
- Bibb County (urban): math 11% / reading 18% proficiency, ranked #161 of 174 in GA (top 92%) — low school quality limits family demand, transient renter base, plan for 1-2y turnover; 75% free/reduced lunch — lower-income household profile, screen leases tightly.
- Market conditions: Rents rising fast (+10.8%/yr); 122 active listings in the ZIP; 14 comparable units currently listed for rent nearby; rentals lingering (median 44d on market — plan ~5-8 weeks vacancy on turnover, expect pricing pressure); 64% of comp listings sitting > 30 days — soft ceiling on asking rent; lower-income renter base — watch delinquency; 154 units permitted in Bibb County in 2024 (0 in 5+ unit buildings).
- This rent runs 31% of the median local income ($45k/yr) — at the standard rent-burdened threshold; future hikes will face affordability resistance.
Forward outlook
- In year one you build about $1k of equity ($138 loan paydown + $862 appreciation (4.3% local appreciation)).
- Bibb County population projected at -12% by 2050 — secular population decline; favor cash flow + early exit over multi-decade hold.
- At projected returns (4.3% appreciation + 8.0% rent growth), your $6k cash investment doubles in ~1 year — after that, you're playing with house money.
Negotiation context
- It's been on market 38 days — a 3% lower offer ($19k) is reasonable based on typical stale-listing flexibility.
Risks & watch-outs
- Watch-outs: built in 1942 — expect roof / HVAC / electrical / plumbing capex.
- Climate carrying-cost: major wind risk, 66% chance of damaging wind over 30y; extreme-heat days projected 7→17/yr by 2055 (HVAC capex compounding) — expect insurance premiums to compound above CPI over the hold.
Questions for the listing agent
- It's been on market 38 days. Have you received any prior offers? Is the seller open to a 3% concession, seller financing, or rate buy-down credit?
- Built in 1942 — when were the roof, HVAC, electrical panel, plumbing, and water heater last replaced?
- Is there a deadline driving the sale (1031 exchange, divorce, estate, relocation)? That informs how much negotiation room exists.
- What's the average days-on-market for RENTAL listings here right now (not sales)? A rising rental-DOM trend means longer vacancies and softer asking-rent achievability than the comps imply.
- What's the recent tenant-quality profile in this submarket — average credit score on applications, eviction rate, late-payment / NSF rate, and stable-employment percentage? A property-management company in the area should have these aggregated.
- How much new for-sale + rental construction is in the pipeline within 1–3 miles? Heavy new supply typically softens prices + rents 12–24 months out; constrained supply supports both.
Investment metrics
- 1% rule
- 5.74% ✓
- Cap rate
- 51.83%
- Cash-on-cash
- 162.64%
- DSCR
- 8.24
- GRM
- 1.5
CMA / ARV
- ARV (median comp)
- $168,157
- List price
- $20,000
- Delta
- -88.11%
- Verdict
- UNDERPRICED
- Comps
- 20 within 1.0 mi
Show comp detail 6 sales within ~0.75 mi
| Address | Dist | Beds/Ba | Sqft | Sold | Price | $/sf | Match |
|---|---|---|---|---|---|---|---|
| 896 Roseview Dr | 0.61mi | 3/2.0 (+1) | 1,695 (-2%) | 2mo | $40,000 | $24 | 57 |
| 3119 Imperial Dr | 0.61mi | 3/1.5 (+1) | 1,911 (+10%) | 2mo | $130,000 | $68 | 46 |
| 1958 Pine Hl | 0.61mi | 2/2.0 | 1,783 (+3%) | 22mo | $188,500 | $106 | 45 |
| 3048 Bethune Ave | 0.54mi | 3/2.5 (+1) | 1,914 (+10%) | 6mo | $155,000 | $81 | 42 |
| 3121 Wedgewood Dr | 0.62mi | 3/2.0 (+1) | 1,957 (+13%) | 16mo | $159,000 | $81 | 27 |
| 3067 Bethune Ave | 0.59mi | 3/2.0 (+1) | 1,485 (-14%) | 23mo | $152,000 | $102 | 20 |
Match score weights: distance 35% · size 25% · config 20% · recency 20%. Top-matched comps best support the ARV.
Projected returns pro-forma
4.31% appreciation · 8.0% rent growth · sell at horizon
- IRR
- —
- Equity multiple
- 11.40×
- Total profit
- $58,265
- Equity at exit
- $10,507
- IRR
- —
- Equity multiple
- 27.67×
- Total profit
- $149,350
- Equity at exit
- $17,485
Cash invested: $5,600 (down + closing). Projections, not guarantees.
Landlord ↔ Tenant lean methodology
- Overall (STATE)
- 90 Strongly Landlord-Friendly
- State Georgia
- 90 Strongly Landlord-Friendly · R+3
- County
- — inherits STATE
- City
- — inherits STATE
ZIP-level market 31217
- Home prices YoY
- 2.1%
- Rents YoY
- 10.8%
- Active inventory
- 122
- Price-to-rent
- 1.5×
Monthly cashflow live
- Estimated rent
- $1,148 high interval (Pro) →
- Mortgage (P&I)
- −$105
- Tax from tax record
- −$35 /mo · $421/yr
- Insurance
- −$8
- HOA
- −$0
- Vacancy / Maint / Mgmt
- −$241
- Net cashflow
- $759
Break-even live
UW: 25.0% down · 7.5% · 30yr · 1.5% tax · 5.0% vac · 8.0% maint · 8.0% mgmt
Financing live
Cash to close
- Down payment
- $5,000
- Closing costs
- $600
- Reserves months
- —
- Total cash needed
- —
Loan-product check · same deal, 3 products live
Conventional
25% down · 7.5% · 30yr
- Down + closing
- —
- Monthly P&I
- —
- Monthly cashflow
- —
- DSCR
- —
- Eligible?
- —
Personal DTI + credit; lowest rate.
DSCR
20% down · 8.5% · 30yr
- Down + closing
- —
- Monthly P&I
- —
- Monthly cashflow
- —
- DSCR
- —
- Eligible?
- —
No personal income docs; deal must DSCR.
Hard money
10% down · 12.0% · 12mo
- Down + closing
- —
- Monthly P&I
- —
- Monthly cashflow
- —
- DSCR
- —
- Eligible?
- —
Short-term bridge; refi at stabilization.
Rent comps 14 comps
| Address | Beds | Baths | Sqft | Rent | $/sqft | DOM | Units | Dist |
|---|---|---|---|---|---|---|---|---|
| 2055 Pine Hill Dr Macon, GA | 2.0 | 1.0 | 1056 | $775 | $0.73 | 21d | 1 | 0.42mi |
| 2623 Flewellyn Ct Macon, GA | 3.0 | 2.0 | 1705 | $1,750 | $1.03 | 13d | 1 | 0.52mi |
| 3240 Commodore Dr Macon, GA | 3.0 | 1.5 | 1135 | $1,200 | $1.06 | 43d | 1 | 0.80mi |
| 3240 Commodore Dr Macon, GA | 3.0 | 1.5 | 1135 | $1,200 | $1.06 | 13d | 1 | 0.80mi |
| 1918 Fairway Dr Macon, GA | 3.0 | 1.0 | 1228 | $975 | $0.79 | 21d | 1 | 0.97mi |
| 1143 Sunnydale Dr Macon, GA | 3.0 | 1.0 | 1053 | $975 | $0.93 | 43d | 1 | 0.98mi |
| 2867 New Clinton Rd Macon, GA | 3.0 | 1.0 | 1350 | $1,100 | $0.81 | 13d | 1 | 0.98mi |
| 2621 Jeffersonville Rd Unit 23 Macon, GA | 3.0 | 2.0 | 1152 | $1,150 | $1.00 | 43d | 1 | 1.02mi |
| 2621 Jeffersonville Rd Unit 42 Macon, GA | 3.0 | 2.0 | 1152 | $1,081 | $0.94 | 43d | 1 | 1.02mi |
| 2621 Jeffersonville Rd Unit 68 Macon, GA | 3.0 | 2.0 | 1056 | $1,050 | $0.99 | 43d | 1 | 1.02mi |
| 2871 New Clinton Rd Macon, GA | 3.0 | 1.0 | 1100 | $1,100 | $1.00 | 43d | 1 | 1.02mi |
| 3358 Club Dr Macon, GA | 3.0 | 1.5 | 1218 | $900 | $0.74 | 43d | 1 | 1.16mi |
| 3347 Thunderbird Rd Macon, GA | 3.0 | 2.0 | 1268 | $850 | $0.67 | 44d | 1 | 1.23mi |
| 854 Trinity Pl Macon, GA | 2.0 | 1.0 | 1260 | $875 | $0.69 | 43d | 1 | 1.39mi |
Listing history 17 events
-
2026-06-19days on market $20,000 Active 38 DOM
-
2026-06-18days on market $20,000 Active 37 DOM
-
2026-06-17days on market $20,000 Active 36 DOM
-
2026-06-16days on market $20,000 Active 35 DOM
-
2026-06-15days on market $20,000 Active 34 DOM
-
2026-06-14days on market $20,000 Active 32 DOM
-
2026-06-13days on market $20,000 Active 31 DOM
-
2026-06-10days on market $20,000 Active 29 DOM
-
2026-06-09days on market $20,000 Active 28 DOM
-
2026-06-09days on market $20,000 Active 27 DOM
-
2026-06-07days on market $20,000 Active 26 DOM
-
2026-06-03days on market $20,000 Active 22 DOM
-
2026-06-02days on market $20,000 Active 21 DOM
-
2026-06-01days on market $20,000 Active 20 DOM
-
2026-05-31days on market $20,000 Active 19 DOM
-
2026-05-30days on market $20,000 Active 18 DOM
-
2026-05-12$20,000 Active 435-char remark
ⓘ Source: listings_history table (triggers on properties + properties_extension) + one-shot
backfill from property_details.listing_events for pre-trigger history.
Tax reassessment forecast GA · Resets to sale price
- Current annual tax
- $421 · $35/mo
- Projected year-2 tax
- $421 · $35/mo
- Expected delta
- $0/yr ($0/mo · 0.0%)
ⓘ Screening estimate from a state-policy table — verify with the county assessor before closing.
Climate risk First Street
- Flood 1/10 Low FEMA zone X (unshaded) · 0% chance over 30 yrs
- Wildfire 3/10 Moderate
- Heat 7/10 Severe 7 d/yr ≥107°F today · 17 d/yr by 30 yrs out
- Wind 6/10 Major 66% chance of damaging wind over 30 yrs
- Air quality 4/10 Moderate 4 unhealthy d/yr today · 4 by 30 yrs out
Nearby sold comps map
Loading sold comps map…
Walkable amenities ~0.75 mi
Loading nearby amenities…
Taxation est. · year 1
- Rental income
- $13,781
- − Mortgage interest
- −$1,120
- − Property taxes
- −$421
- − Insurance
- −$100
- − Repairs & maintenance
- −$1,102
- − Management
- −$1,102
- − Depreciation
- −$582
- Taxable income
- $9,353
- Est. tax owed @ 24.0%
- −$2,245
- After-tax cash flow
- $6,863/yr
For passive investors: Depreciation is non-cash, so a rental often shows a tax loss while cash-flowing — sheltering income. Rental losses are passive: they offset passive income freely, and up to $25,000/yr can offset ordinary (W-2) income if you actively participate and your MAGI is under $100k (phasing out to $0 by $150k); unused losses carry forward. On sale, claimed depreciation is recaptured at up to 25%, and gains may owe capital-gains tax (a 1031 exchange can defer both). Figures are a year-1 estimate at your 24.0% rate — not tax advice; consult a CPA.
Schools (NCES district)
- District
- Bibb County
- NCES district ID
- 1300420
- Math proficiency
- 11% ▼ -14.00%
- Reading proficiency
- 18% ▼ -11.00%
- Median HH income
- $37,426
- Composite
- 12.13/100
- National rank
- #9654
- State rank
- #161 of 174 in GA
Livability — Macon-Bibb County
No livability data for this city. (Only ~50 U.S. cities are tracked.)
Census & demographics
- Census place
- Macon-Bibb County, GA
- County
- Bibb County · 164,332 people
- City population
- 143,186
- Metro
- Macon-Bibb County, GA
- Population (ZIP)
- 17,732
- Household income
- $44,809
- Rent vs Own
- Severe rent burden
- 391.0
Population outlook (Bibb County) Hauer SSP2
- Today (2025)
- 148,772 people
- By 2030
- 145,904 · -1.9%
- By 2040
- 139,404 · -6.3%
- By 2050
- 131,603 · -11.5%
- By 2075
- 111,050 · -25.4%
- By 2100
- 83,346 · -44.0%
Race, ethnicity, and origin ACS 2023
- Neighborhood character
- Majority Black (57%)
- Race & ethnicity
- Black 57% White 38% Two or more races 4% Hispanic / Latino 2%
- Common ancestry
- Slovak 1% Italian 1%
- Foreign-born
- 1% · Canada
- Languages at home
- 98% English-only · Spanish 1%
Political lean MEDSL · Bibb
- 2024 margin
- Strong D (+22.4) · D 61.0% · R 38.5%
- 2008→2024 swing
- +4.4pp toward D · 2008: 18.0pp · 2024: 22.4pp
- All cycles
- 2024: D+22.4 2020: D+23.8 2016: D+20.2 2012: D+20.0 2008: D+18.0
Not yet ingested
- Civics
- —
Market trends
- HPI YoY
- ▲ 4.31%
- Current HPI
- 209.9166
- Rent YoY
- ▲ 10.85%
- Metro
- Macon-Bibb County, GA
- State GDP YoY
- ▲ 2.66%
- F500 in state
- 28
Industry mix (Fortune 500 HQ in GA)
| Industry | F500 HQs | Revenue |
|---|---|---|
| Paper / Packaging | 2 | $29B |
|
||
| Retail | 1 | $160B |
|
||
| Transportation / Logistics | 1 | $91B |
|
||
| Airlines | 1 | $62B |
|
||
| Consumer Goods | 1 | $47B |
|
||
| Utilities | 1 | $25B |
|
||
Price history
1 event — show timeline
- 2026-05-12 Listed $20,000 FSBO.com
Property tax history
+5.2%/yrLatest (2025): $421 · -39.8% YoY. Source: county tax records.
Cash-flow waterfall
monthlySold comps — $/sqft
last 12 mo · ≤1 miLoading sold comps…