302 S Paseo Aguila Unit B · Green Valley, AZ
Flood risk 1/10 · Minimal
- FEMA flood zone
- X (unshaded)
- Chance of flooding over 30 yrs
- 0.0%
- Est. flood insurance / yr
- $507 – $1,088
Fire risk 6/10 · Moderate
- Est. fire insurance / yr
- $610 – $1,132
Heat risk 7/10 · Major
- Hot days now (above 106°F)
- 7 days/yr
- Hot days in 30 yrs
- 19 days/yr
Wind risk 1/10 · Minimal
- Chance of severe wind over 30 yrs
- —
Air-quality risk 1/10 · Minimal
- Unhealthy air days now
- 0 days/yr
- Unhealthy air days in 30 yrs
- 0 days/yr
Risk factors via First Street. Map © Google.
Why this score? — see what drove the C+ grade
The composite is a weighted blend of 9 inputs, each scored 0–100. Each bar is that input's sub-score; the figure is the points it added to the 100-point composite (weight × sub-score).
- Cash flow +22.8/30.0
- 1% rule +10.0/10.0
- ARV discount +7.5/15.0
- DSCR +7.3/10.0
- Rent growth +3.9/5.0
- Condition / age +3.8/5.0
- Schools +3.3/10.0
- Livability +3.1/5.0
- Appreciation +0.0/10.0
$87,500
🖨 Deal sheet 📄 Offer letter ✓ Due diligence
Listing remarks MLS
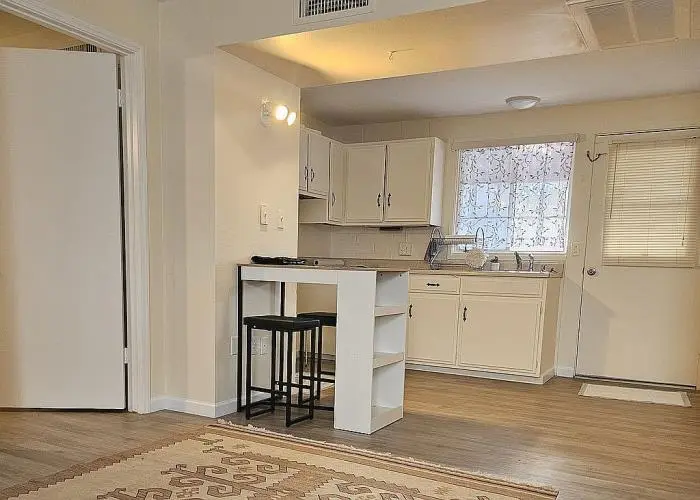
This white-arch Villa is move in ready with fresh paint, updated bathroom, 2 yr old a/c, brand new range/oven. Complete with laundry room with washer and dryer. Washer and dryer sold as-is. This Villa is short distance to the neighborhood park and pool, Green Valley Rec. Centers and shopping at the Green Valley Village, Great for year round or seasonal living.
Key facts
- Updated bathroom
- Garage
- Built 1964
Tags
Neighborhood map
What this means for you Summary
Snapshot
- This is a 1-bed/1.0-bath condo listed at $88k. Condition is rated good.
Deal economics
- At list price, monthly cash flow is $152 ($2k/yr) — positive.
- The deal already cash-flows at list — no discount required.
- Meets the 1% rule at list price ($1k rent vs $88k).
- Recommended offer: $85k (3.0% below list) — sets the bar for market timing.
- Cap rate 8.4% vs local median 4.5% in Green Valley — top-decile yield for the area; either an underpriced asset or a hidden risk that comps aren't pricing in. Stress-test before assuming the spread holds.
Location & tenants
- Location reads 61/100 on livability (#165 in AZ) — a middle-class / working-renter tenant base. Strengths: cost of living A+, housing A+; Watch: schools C-, amenities F, commute F.
- Continental Elementary District (4416) (rural): math 35% / reading 42% proficiency, ranked #72 of 249 in AZ (top 29%) — families likely to look elsewhere, expect single-tenant / working-renter base with shorter leases; only 19% free/reduced lunch — higher-income household profile.
- Market conditions: Rents rising fast (+5.6%/yr); 411 active listings in the ZIP; 12 comparable units currently listed for rent nearby; rentals at typical pace (median 17d on market — plan ~3-4 weeks tenant-placement turnaround); 5,268 units permitted in Pima County in 2024 (996 in 5+ unit buildings).
Forward outlook
- Local home prices are declining (-3.0%/yr); year-one equity from $605 of loan paydown is wiped out by about $3k of value loss. Plan a longer hold.
- Pima County population projected at +8% by 2050 — modest demand growth; plan on rents tracking national, not racing it.
- At projected returns (-3.0% appreciation + 5.6% rent growth), your $24k cash investment doubles in ~9 years — after that, you're playing with house money.
Negotiation context
- It's been on market 43 days — a 3% lower offer ($85k) is reasonable based on typical stale-listing flexibility.
- 6 sale attempts since 20y ago with the ask held roughly flat each time — persistent listings suggest the price (not the market) is what's stuck; bring a comps-based counter.
- Current owner paid $35k; list at $88k implies a 150% gain — meaningful room to come down on a strong offer.
Risks & watch-outs
- Watch-outs: HOA is 24% of rent.
- Climate carrying-cost: major wildfire risk; extreme-heat days projected 7→19/yr by 2055 (HVAC capex compounding) — expect insurance premiums to compound above CPI over the hold.
Questions for the listing agent
- It's been on market 43 days. Have you received any prior offers? Is the seller open to a 3% concession, seller financing, or rate buy-down credit?
- Built in 1964 — when were the roof, HVAC, electrical panel, plumbing, and water heater last replaced?
- What does the HOA fee cover, when was the last increase, and are there any pending special assessments or reserve-fund shortfalls?
- Any open or pending special assessments — roof, HVAC, plumbing, elevator, façade? What's the per-unit balance and payoff schedule, and is the seller paying it off at close or rolling it to the buyer?
- Is there a deadline driving the sale (1031 exchange, divorce, estate, relocation)? That informs how much negotiation room exists.
- What's the average days-on-market for RENTAL listings here right now (not sales)? A rising rental-DOM trend means longer vacancies and softer asking-rent achievability than the comps imply.
- What's the recent tenant-quality profile in this submarket — average credit score on applications, eviction rate, late-payment / NSF rate, and stable-employment percentage? A property-management company in the area should have these aggregated.
- How much new apartment / multifamily construction is in the pipeline within 1–3 miles? Heavy new supply (>2% of stock underway) typically softens rents 12–24 months out; light construction supports rent growth.
Investment metrics
- 1% rule
- 1.56% ✓
- Cap rate
- 8.37%
- Cash-on-cash
- 7.43%
- DSCR
- 1.33
- GRM
- 5.3
CMA / ARV
No comps found within radius.
Projected returns pro-forma
-3.0% appreciation · 5.6% rent growth · sell at horizon
- IRR
- -0.7%
- Equity multiple
- 0.97×
- Total profit
- $-634
- Equity at exit
- $13,047
- IRR
- 12.6%
- Equity multiple
- 2.17×
- Total profit
- $28,623
- Equity at exit
- $7,565
Cash invested: $24,500 (down + closing). Projections, not guarantees.
Landlord ↔ Tenant lean methodology
- Overall (STATE)
- 87 Strongly Landlord-Friendly
- State Arizona
- 87 Strongly Landlord-Friendly · R+3
- County
- — inherits STATE
- City
- — inherits STATE
ZIP-level market 85614
- Rents YoY
- 5.6%
- Active inventory
- 411
- Price-to-rent
- 5.3×
Monthly cashflow live
- Estimated rent
- $1,364 high interval (Pro) →
- Mortgage (P&I)
- −$459
- Tax est. 1.5%
- −$109 /mo · $1,312/yr
- Insurance
- −$36
- HOA est. from 3 same-building comps
- −$321
- Vacancy / Maint / Mgmt
- −$286
- Net cashflow
- $152
Break-even live
UW: 25.0% down · 7.5% · 30yr · 1.5% tax · 5.0% vac · 8.0% maint · 8.0% mgmt
Financing live
Cash to close
- Down payment
- $21,875
- Closing costs
- $2,625
- Reserves months
- —
- Total cash needed
- —
Loan-product check · same deal, 3 products live
Conventional
25% down · 7.5% · 30yr
- Down + closing
- —
- Monthly P&I
- —
- Monthly cashflow
- —
- DSCR
- —
- Eligible?
- —
Personal DTI + credit; lowest rate.
DSCR
20% down · 8.5% · 30yr
- Down + closing
- —
- Monthly P&I
- —
- Monthly cashflow
- —
- DSCR
- —
- Eligible?
- —
No personal income docs; deal must DSCR.
Hard money
10% down · 12.0% · 12mo
- Down + closing
- —
- Monthly P&I
- —
- Monthly cashflow
- —
- DSCR
- —
- Eligible?
- —
Short-term bridge; refi at stabilization.
Rent comps 12 comps
| Address | Beds | Baths | Sqft | Rent | $/sqft | DOM | Units | Dist |
|---|---|---|---|---|---|---|---|---|
| 262 S Paseo Cerro Unit B Green Valley, AZ | 1.0 | 1.0 | 588 | $1,200 | $2.04 | 23d | 1 | 0.08mi |
| 262 S Paseo Cerro Green Valley, AZ | 1.0 | 1.0 | 588 | $1,200 | $2.04 | 1d | 1 | 0.08mi |
| 303 S Paseo Lobo Green Valley, AZ | 2.0 | 1.0 | 696 | $1,000 | $1.44 | 23d | 1 | 0.10mi |
| 90 W Camino Manzana Green Valley, AZ | 1.0 | 1.0 | 588 | $2,000 | $3.40 | 23d | 1 | 0.13mi |
| 321 S Paseo Madera Unit A Green Valley, AZ | 2.0 | 1.0 | 696 | $1,250 | $1.80 | 23d | 1 | 0.13mi |
| 466 S Paseo Madera Green Valley, AZ | 2.0 | 1.0 | 696 | $2,300 | $3.30 | 16d | 1 | 0.24mi |
| 466 Paseo Madera Unit A Green Valley, AZ | 2.0 | 1.0 | 696 | $1,100 | $1.58 | 16d | 1 | 0.24mi |
| 478 Paseo Madera Unit B Green Valley, AZ | 1.0 | 1.0 | 588 | $1,250 | $2.13 | 23d | 1 | 0.26mi |
| 133 S Paseo Pena Green Valley, AZ | 1.0 | 1.0 | 588 | $1,095 | $1.86 | 1d | 1 | 0.34mi |
| 430 S Paseo Pena Green Valley, AZ | 2.0 | 1.0 | 696 | $1,025 | $1.47 | 14d | 1 | 0.36mi |
| 132 S Paseo Sarta Green Valley, AZ | 1.0 | 1.0 | 588 | $2,000 | $3.40 | 1d | 1 | 0.47mi |
| 174 S Paseo Tierra Green Valley, AZ | 1.0 | 1.0 | 588 | $1,100 | $1.87 | 1d | 1 | 0.51mi |
HOA detail condo
- Monthly dues
- $0 · $0/yr
- Likely covers
- pool
- Assessments
- None detected in remarks — confirm with the listing agent.
Listing history 25 events
-
2026-06-18days on market $87,500 Active 43 DOM
-
2026-06-17days on market $87,500 Active 42 DOM
-
2026-06-16days on market $87,500 Active 41 DOM
-
2026-06-15days on market $87,500 Active 40 DOM
-
2026-06-13days on market $87,500 Active 38 DOM
-
2026-06-10days on market $87,500 Active 35 DOM
-
2026-06-09days on market $87,500 Active 34 DOM
-
2026-06-08days on market $87,500 Active 33 DOM
-
2026-06-07days on market $87,500 Active 32 DOM
-
2026-06-03days on market $87,500 Active 28 DOM
-
2026-06-02days on market $87,500 Active 27 DOM
-
2026-06-01days on market $87,500 Active 26 DOM
-
2026-05-31days on market $87,500 Active 25 DOM
-
2026-05-05$87,500 Active
-
2026-03-08historical
-
2026-01-23$1 Active
-
2014-08-04soldstatus $35,000 Closed 362-char remark
Show marketing remark (362 chars)
This white-arch Villa is move in ready with fresh paint, updated bathroom, 2 yr old a/c, brand new range/oven. Complete with laundry room with washer and dryer. Washer and dryer sold as-is. This Villa is short distance to the neighborhood park and pool, Green Valley Rec. Centers and shopping at the Green Valley Village, Great for year round or seasonal living.
-
2013-06-01historical
-
2012-10-25$39,500
-
2011-07-01historical
-
2011-03-21$44,900
-
2011-03-01historical
-
2010-09-01$44,900
-
2006-04-26soldstatus $80,000
-
2006-02-10$82,000
ⓘ Source: listings_history table (triggers on properties + properties_extension) + one-shot
backfill from property_details.listing_events for pre-trigger history.
Climate risk First Street
- Flood 1/10 Low FEMA zone X (unshaded) · 0% chance over 30 yrs
- Wildfire 6/10 Major
- Heat 7/10 Severe 7 d/yr ≥106°F today · 19 d/yr by 30 yrs out
- Wind 1/10 Low
- Air quality 1/10 Low 0 unhealthy d/yr today · 0 by 30 yrs out
Nearby sold comps map
Loading sold comps map…
Walkable amenities ~0.75 mi
Loading nearby amenities…
Taxation est. · year 1
- Rental income
- $16,366
- − Mortgage interest
- −$4,901
- − Property taxes
- −$1,312
- − Insurance
- −$438
- − Repairs & maintenance
- −$1,309
- − Management
- −$1,309
- − HOA
- −$3,852
- − Depreciation
- −$2,545
- Taxable income
- $699
- Est. tax owed @ 24.0%
- −$168
- After-tax cash flow
- $1,653/yr
For passive investors: Depreciation is non-cash, so a rental often shows a tax loss while cash-flowing — sheltering income. Rental losses are passive: they offset passive income freely, and up to $25,000/yr can offset ordinary (W-2) income if you actively participate and your MAGI is under $100k (phasing out to $0 by $150k); unused losses carry forward. On sale, claimed depreciation is recaptured at up to 25%, and gains may owe capital-gains tax (a 1031 exchange can defer both). Figures are a year-1 estimate at your 24.0% rate — not tax advice; consult a CPA.
Condition & rehab AI · 12 photos
This move-in ready, well-maintained condo features updated bathrooms, new flooring, and fresh paint, making it an attractive investment opportunity.
Value-add opportunities
- Resale new quartz countertops — enhances kitchen appeal
- Both new flooring — improves both resale and rental value
- Both new paint — refreshes interior and exterior
- Both landscaping — enhances curb appeal and rental value
Renovation cost estimate screening
Value-add ROI direction
- Resale new quartz countertops — enhances kitchen appeal ↑
- Both new flooring — improves both resale and rental value ↑
- Both new paint — refreshes interior and exterior ↑
- Both landscaping — enhances curb appeal and rental value ↑
ⓘ Cost ranges are severity-bucket heuristics (US national rule-of-thumb). Get contractor quotes + a written scope before underwriting a rehab budget.
Schools (NCES district)
- District
- Continental Elementary District (4416)
- NCES district ID
- 0402250
- Math proficiency
- 35% ▼ -11.00%
- Reading proficiency
- 42% ▬ 0.00%
- Median HH income
- $48,475
- Composite
- 33.08/100
- National rank
- #5565
- State rank
- #72 of 249 in AZ
Livability — Green Valley
- Score
- 61/100
- State rank
- #165
- US rank
- #18276
Category grades
Schools grade is shown separately in the Schools card above.
Census & demographics
- Census place
- Green Valley, AZ
- County
- Pima County · 1,012,107 people
- City population
- 25,381
- Metro
- Tucson, AZ
- Population (ZIP)
- 25,381
- Household income
- $64,879
- Rent vs Own
- Severe rent burden
- 860.0
Population outlook (Pima County) Hauer SSP2
- Today (2025)
- 1,066,056 people
- By 2030
- 1,086,684 · +1.9%
- By 2040
- 1,117,160 · +4.8%
- By 2050
- 1,149,778 · +7.9%
- By 2075
- 1,271,480 · +19.3%
- By 2100
- 1,321,160 · +23.9%
Race, ethnicity, and origin ACS 2023
- Neighborhood character
- Predominantly White (80%)
- Race & ethnicity
- White 80% Hispanic / Latino 15% Two or more races 7% Black 2%
- Hispanic origin (detail)
- Mexican 14%
- Common ancestry
- Portuguese 4% Slovak 4% Italian 3%
- Foreign-born
- 8% · Canada, China
- Languages at home
- 87% English-only · Spanish 9% French/Haitian/Cajun 1% German/W. Germanic 0%
Political lean MEDSL · Pima
- 2024 margin
- D (+15.2) · D 57.0% · R 41.8% · Other 1.2%
- 2008→2024 swing
- +9.1pp toward D · 2008: 6.1pp · 2024: 15.2pp
- All cycles
- 2024: D+15.2 2020: D+18.7 2016: D+13.5 2012: D+5.8 2008: D+6.1
Not yet ingested
- Civics
- —
Market trends
- HPI YoY
- ▼ -231.05%
- Current HPI
- 250.5933
- Rent YoY
- ▲ 5.60%
- Metro
- Tucson, AZ
- State GDP YoY
- ▲ 4.54%
- F500 in state
- 20
Industry mix (Fortune 500 HQ in AZ)
| Industry | F500 HQs | Revenue |
|---|---|---|
| Technology | 2 | $13B |
|
||
| Mining / Metals | 1 | $23B |
|
||
| Environmental Services | 1 | $16B |
|
||
| Metals / Steel | 1 | $14B |
|
||
| Technology Distribution | 1 | $9B |
|
||
| Homebuilding | 1 | $8B |
|
||
Price history
+6.7% since first listed12 events — show timeline
- 2026-05-05 Listed $87,500 Fizber.com
- 2026-03-08 Listing Removed — MLSSAZ
- 2026-01-23 Listed $1 MLSSAZ
- 2014-08-04 Sold (MLS) $35,000 MLSSAZ
- 2013-06-01 Listing Removed — MLSSAZ
- 2012-10-25 Listed $39,500 MLSSAZ
- 2011-07-01 Listing Removed — MLSSAZ
- 2011-03-21 Listed $44,900 MLSSAZ
- 2011-03-01 Listing Removed — MLSSAZ
- 2010-09-01 Listed $44,900 MLSSAZ
- 2006-04-26 Sold (MLS) $80,000 MLSSAZ
- 2006-02-10 Listed $82,000 MLSSAZ
Cash-flow waterfall
monthlySold comps — $/sqft
last 12 mo · ≤1 miLoading sold comps…