 Multi-family
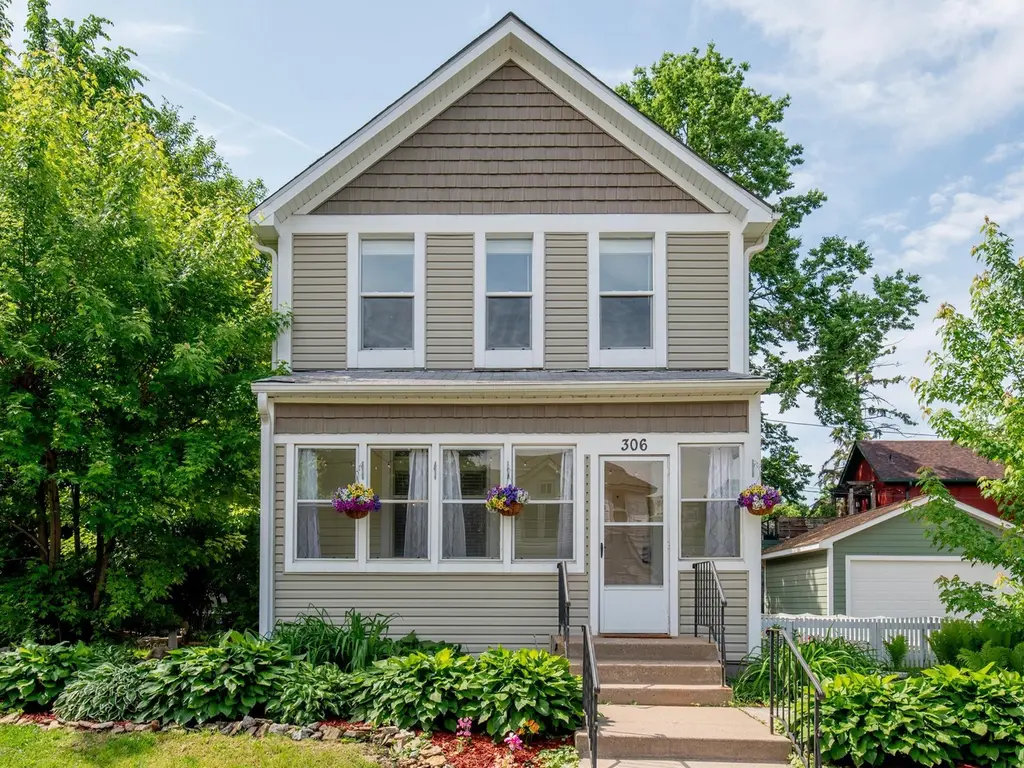
306 Harrison Ave · St. Paul, MN
Flood risk 6/10 · Moderate
- FEMA flood zone
- X (unshaded)
- Chance of flooding over 30 yrs
- 0.69%
- Est. flood insurance / yr
- $507 – $1,088
Fire risk 1/10 · Minimal
- Est. fire insurance / yr
- $888 – $1,650
Heat risk 2/10 · Minimal
- Hot days now (above 100°F)
- 7 days/yr
- Hot days in 30 yrs
- 14 days/yr
Wind risk 2/10 · Minimal
- Chance of severe wind over 30 yrs
- —
Air-quality risk 2/10 · Minimal
- Unhealthy air days now
- 1 days/yr
- Unhealthy air days in 30 yrs
- 1 days/yr
Risk factors via First Street. Map © Google.
Why this score? — see what drove the D grade
The composite is a weighted blend of 9 inputs, each scored 0–100. Each bar is that input's sub-score; the figure is the points it added to the 100-point composite (weight × sub-score).
- Cash flow +15.0/30.0
- ARV discount +7.5/15.0
- DSCR +4.6/10.0
- 1% rule +4.1/10.0
- Rent growth +2.9/5.0
- Livability +2.5/5.0
- Condition / age +2.5/5.0
- Schools +2.4/10.0
- Appreciation +0.0/10.0
$345,000
🖨 Deal sheet 📄 Offer letter ✓ Due diligence
Multi-family units
County records classify this as Multi-Family (2-4 Unit). Listing-text estimate: 1 unit. estimate disagrees with records
Listing remarks MLS
Clean, move in ready duplex; perfect for owner occupant! Pay entire mortgage w/rental income from 1 unit! Maintenance free siding, large 2 car gar, forced air furnace, updated elec, refinished hdwd flrs & more! Easily converted to single family home.
Key facts
- Spacious pantry
- Rich hardwood floors
- Main-floor office
Tags
Property features AI
Finance
- Other: Above-grade finished living area approximately 1,784; Below-grade area approximately 476; Main level finished area approximately 1,035; Total building area approximately 2,260; Not fractional ownership
Exterior
- Parking: Detached or attached 2-car garage with concrete apron and garage door opener
- Utilities: City water connected; City sewer connected; Natural gas fuel; 100 amp electrical service with circuit breakers
- Home design: Residential property; Two levels; Porch entry
- Construction: Asphalt roof (age 8 years or less); Block foundation; Built with vinyl siding
- Exterior features: Vinyl exterior; Patio; Wood fencing; Medium tree coverage on lot; City street frontage; Lot dimensions approximately 50 x 102
Interior
- Kitchen: Dishwasher; Range; Microwave; Refrigerator; Stainless steel appliances; Kitchen configured with eat-in area
- Bedrooms: 4 bedrooms total; Bedrooms located on main and upper levels (3 bedrooms on one level noted)
- Flooring: Hardwood floors
- Bathrooms: Main floor three-quarter bath; Upper-level full bath
- Heating & cooling: Baseboard heating; Forced air heating; No central air
- Interior features: Eat-in kitchen and separate/formal dining room; Sun room; Office; Main floor laundry; Primary bedroom suite; Partial basement; Hardwood floors; Kitchen window; Porch
- Laundry & utility: Main level laundry room; Washer and dryer included; Electric dryer hookup; Washer/dryer hookup
Neighborhood map
What this means for you Summary
Snapshot
- This is a 4-bed/2.0-bath multifamily listed at $345k.
Deal economics
- At list price, monthly cash flow is $108 ($1k/yr) — positive.
- The deal already cash-flows at list — no discount required.
- To meet the 1% rule (rent ≥ 1% of price), the offer needs to be $316k (8.5% below list).
- Recommended offer: $316k (8.5% below list) — sets the bar for 1% rule.
Location & tenants
- Location reads: area grade D — affects rentability + tenant quality, not the cash-flow math above.
- St. Paul Public School District (urban): math 21% / reading 33% proficiency, ranked #270 of 301 in MN (top 90%) — low school quality limits family demand, transient renter base, plan for 1-2y turnover; 64% free/reduced lunch — lower-income household profile, screen leases tightly.
- Market conditions: Rents rising (+1.6%/yr); 145 active listings in the ZIP; 5 comparable units currently listed for rent nearby; rentals leasing fast (median 2d on market — plan ~1-2 weeks tenant-placement turnaround); solid renter incomes; 1,202 units permitted in Ramsey County in 2024 (880 in 5+ unit buildings).
- At $3,155/mo this rent would consume 50% of the median local household income ($76k/yr) (locally 1116% of renters already pay >50% of income on rent) — very limited rent-growth headroom before tenants either downsize or default.
Forward outlook
- Local home prices are declining (-3.0%/yr); year-one equity from $2k of loan paydown is wiped out by about $10k of value loss. Plan a longer hold.
- Ramsey County population projected at +27% by 2050 — long-run rental-demand tailwind backs the buy-and-hold thesis.
Negotiation context
- It's been on market 16 days — a 2% lower offer ($340k) is reasonable based on typical stale-listing flexibility.
- 5 sale attempts since 32y ago with the ask held roughly flat each time — persistent listings suggest the price (not the market) is what's stuck; bring a comps-based counter.
- Current owner paid $114k; list at $345k implies a 203% gain — meaningful room to come down on a strong offer.
Risks & watch-outs
- Watch-outs: built in 1879 — expect roof / HVAC / electrical / plumbing capex.
- Climate carrying-cost: major flood risk — expect insurance premiums to compound above CPI over the hold.
Questions for the listing agent
- Built in 1879 — when were the roof, HVAC, electrical panel, plumbing, and water heater last replaced?
- Is there a deadline driving the sale (1031 exchange, divorce, estate, relocation)? That informs how much negotiation room exists.
- The area grade is low — what's the realistic commute time and amenity access for the typical tenant pool here? Any planned neighborhood developments (good or bad) we should know about?
- What's the average days-on-market for RENTAL listings here right now (not sales)? A rising rental-DOM trend means longer vacancies and softer asking-rent achievability than the comps imply.
- What's the recent tenant-quality profile in this submarket — average credit score on applications, eviction rate, late-payment / NSF rate, and stable-employment percentage? A property-management company in the area should have these aggregated.
- How much new apartment / multifamily construction is in the pipeline within 1–3 miles? Heavy new supply (>2% of stock underway) typically softens rents 12–24 months out; light construction supports rent growth.
Investment metrics
- 1% rule
- 0.91% ✗
- Cap rate
- 6.67%
- Cash-on-cash
- 1.35%
- DSCR
- 1.06
- GRM
- 9.1
CMA / ARV
No comps found within radius.
Projected returns pro-forma
-3.0% appreciation · 1.6% rent growth · sell at horizon
- IRR
- -15.7%
- Equity multiple
- 0.45×
- Total profit
- $-53,341
- Equity at exit
- $51,441
- IRR
- -9.9%
- Equity multiple
- 0.43×
- Total profit
- $-54,859
- Equity at exit
- $29,829
Cash invested: $96,600 (down + closing). Projections, not guarantees.
Landlord ↔ Tenant lean methodology
- Overall (STATE)
- 46 Balanced
- State Minnesota
- 46 Balanced · D+2
- County
- — inherits STATE
- City
- — inherits STATE
ZIP-level market 55102
- Rents YoY
- 1.6%
- Active inventory
- 145
- Price-to-rent
- 9.1×
Monthly cashflow live
- Estimated rent
- $3,155 high interval (Pro) →
- Mortgage (P&I)
- −$1,809
- Tax est. 1.5%
- −$431 /mo · $5,175/yr
- Insurance
- −$144
- HOA
- −$0
- Vacancy / Maint / Mgmt
- −$663
- Net cashflow
- $108
Break-even live
UW: 25.0% down · 7.5% · 30yr · 1.5% tax · 5.0% vac · 8.0% maint · 8.0% mgmt
Financing live
Cash to close
- Down payment
- $86,250
- Closing costs
- $10,350
- Reserves months
- —
- Total cash needed
- —
Loan-product check · same deal, 3 products live
Conventional
25% down · 7.5% · 30yr
- Down + closing
- —
- Monthly P&I
- —
- Monthly cashflow
- —
- DSCR
- —
- Eligible?
- —
Personal DTI + credit; lowest rate.
DSCR
20% down · 8.5% · 30yr
- Down + closing
- —
- Monthly P&I
- —
- Monthly cashflow
- —
- DSCR
- —
- Eligible?
- —
No personal income docs; deal must DSCR.
Hard money
10% down · 12.0% · 12mo
- Down + closing
- —
- Monthly P&I
- —
- Monthly cashflow
- —
- DSCR
- —
- Eligible?
- —
Short-term bridge; refi at stabilization.
Rent comps 5 comps
| Address | Beds | Baths | Sqft | Rent | $/sqft | DOM | Units | Dist |
|---|---|---|---|---|---|---|---|---|
| 255 Western Ave N Saint Paul, MN | 3.0 | 1.0–2.0 | 1049 | $3,700 | $3.53 | 1d | 23 | 0.72mi |
| 101 10th St E Saint Paul, MN | 3.0 | 1.0–2.0 | 887 | $2,490 | $2.81 | 2d | 25 | 1.21mi |
| 111 Kellogg Blvd E Saint Paul, MN | 3.0 | 1.0–2.0 | 1000 | $2,783 | $2.78 | 1d | 20 | 1.22mi |
| 180 E Kellogg Blvd St Paul, MN | 3.0 | 1.0–2.5 | 1436 | $4,595 | $3.20 | 1d | 22 | 1.38mi |
| 333 Sibley St Saint Paul, MN | 3.0 | 1.0–2.0 | 1358 | $3,269 | $2.41 | 10d | 10 | 1.38mi |
Listing history 11 events
-
2026-06-18days on market $345,000 Active 16 DOM
-
2026-06-17days on market $345,000 Active 15 DOM
-
2026-06-16days on market $345,000 Active 14 DOM
-
2026-06-15days on market $345,000 Active 13 DOM
-
2026-06-13days on market $345,000 Active 11 DOM
-
2026-06-09days on market $345,000 Active 7 DOM
-
2026-06-08days on market $345,000 Active 6 DOM
-
2026-06-07days on market $345,000 Active 5 DOM
-
2026-06-04days on market $345,000 Active 2 DOM
-
2026-06-02remarks 699-char remark
-
2026-06-02$345,000 Active 1 DOM
ⓘ Source: listings_history table (triggers on properties + properties_extension) + one-shot
backfill from property_details.listing_events for pre-trigger history.
Climate risk First Street
- Flood 6/10 Major FEMA zone X (unshaded) · 69% chance over 30 yrs
- Wildfire 1/10 Low
- Heat 2/10 Low 7 d/yr ≥100°F today · 14 d/yr by 30 yrs out
- Wind 2/10 Low
- Air quality 2/10 Low 1 unhealthy d/yr today · 1 by 30 yrs out
Nearby sold comps map
Loading sold comps map…
Walkable amenities ~0.75 mi
Loading nearby amenities…
Taxation est. · year 1
- Rental income
- $37,861
- − Mortgage interest
- −$19,325
- − Property taxes
- −$5,175
- − Insurance
- −$1,725
- − Repairs & maintenance
- −$3,029
- − Management
- −$3,029
- − Depreciation
- −$10,036
- Taxable loss
- −$4,458
- Est. tax savings @ 24.0%
- +$1,070
- After-tax cash flow
- $2,370/yr
For passive investors: Depreciation is non-cash, so a rental often shows a tax loss while cash-flowing — sheltering income. Rental losses are passive: they offset passive income freely, and up to $25,000/yr can offset ordinary (W-2) income if you actively participate and your MAGI is under $100k (phasing out to $0 by $150k); unused losses carry forward. On sale, claimed depreciation is recaptured at up to 25%, and gains may owe capital-gains tax (a 1031 exchange can defer both). Figures are a year-1 estimate at your 24.0% rate — not tax advice; consult a CPA.
Schools (NCES district)
- District
- St. Paul Public School District
- NCES district ID
- 2733840
- Math proficiency
- 21% ▼ -11.00%
- Reading proficiency
- 33% ▼ -7.00%
- Median HH income
- $48,316
- Composite
- 23.51/100
- National rank
- #7868
- State rank
- #270 of 301 in MN
Livability — St. Paul
No livability data for this city. (Only ~50 U.S. cities are tracked.)
Census & demographics
- Census place
- St. Paul, MN
- County
- Ramsey County · 542,837 people
- City population
- 280,599
- Metro
- Minneapolis-St. Paul-Bloomington, MN-WI
- Population (ZIP)
- 19,630
- Household income
- $76,406
- Rent vs Own
- Severe rent burden
- 1116.0
Population outlook (Ramsey County) Hauer SSP2
- Today (2025)
- 603,431 people
- By 2030
- 636,459 · +5.5%
- By 2040
- 700,596 · +16.1%
- By 2050
- 765,819 · +26.9%
- By 2075
- 929,297 · +54.0%
- By 2100
- 1,053,924 · +74.7%
Race, ethnicity, and origin ACS 2023
- Neighborhood character
- Predominantly White (77%)
- Race & ethnicity
- White 77% Black 10% Two or more races 6% Hispanic / Latino 5% Asian 3%
- Hispanic origin (detail)
- Mexican 4%
- Common ancestry
- Portuguese 10% Lithuanian 5% Romanian 3%
- Foreign-born
- 9% · Canada, South Korea
- Languages at home
- 87% English-only · Spanish 4% Other Indo-European 1% German/W. Germanic 1%
Political lean MEDSL · Ramsey
- 2024 margin
- Solid D (+43.3) · D 70.5% · R 27.2% · Other 2.3%
- 2008→2024 swing
- +9.4pp toward D · 2008: 33.9pp · 2024: 43.3pp
- All cycles
- 2024: D+43.3 2020: D+45.4 2016: D+39.4 2012: D+35.3 2008: D+33.9
Not yet ingested
- Civics
- —
Market trends
- HPI YoY
- ▼ -217.83%
- Current HPI
- 241.7112
- Rent YoY
- ▲ 1.60%
- Metro
- Minneapolis-St. Paul-Bloomington, MN-WI
- State GDP YoY
- ▲ 2.41%
- F500 in state
- 34
Industry mix (Fortune 500 HQ in MN)
| Industry | F500 HQs | Revenue |
|---|---|---|
| Healthcare | 2 | $407B |
|
||
| Retail | 2 | $150B |
|
||
| Consumer Goods | 2 | $32B |
|
||
| Industrial Machinery | 2 | $6B |
|
||
| Agriculture | 1 | $40B |
|
||
| Healthcare / Medical Devices | 1 | $32B |
|
||
Price history
+668.4% since first listed10 events — show timeline
- 2026-06-02 Listed $345,000 NORTHSTARMLS as Distributed by MLS Grid
- 2010-12-17 Sold (MLS) $114,000 NORTHSTARMLS as Distributed by MLS Grid
- 2010-11-30 Listing Removed — NORTHSTARMLS as Distributed by MLS Grid
- 2010-07-27 Listed $116,900 NORTHSTARMLS as Distributed by MLS Grid
- 2007-09-19 Listing Removed — NORTHSTARMLS as Distributed by MLS Grid
- 2007-08-23 Listed $184,900 NORTHSTARMLS as Distributed by MLS Grid
- 2007-08-21 Listing Removed — NORTHSTARMLS as Distributed by MLS Grid
- 2007-06-20 Listed $189,900 NORTHSTARMLS as Distributed by MLS Grid
- 1994-10-12 Listing Removed — NORTHSTARMLS as Distributed by MLS Grid
- 1994-07-19 Listed $44,900 NORTHSTARMLS as Distributed by MLS Grid
Cash-flow waterfall
monthlySold comps — $/sqft
last 12 mo · ≤1 miLoading sold comps…