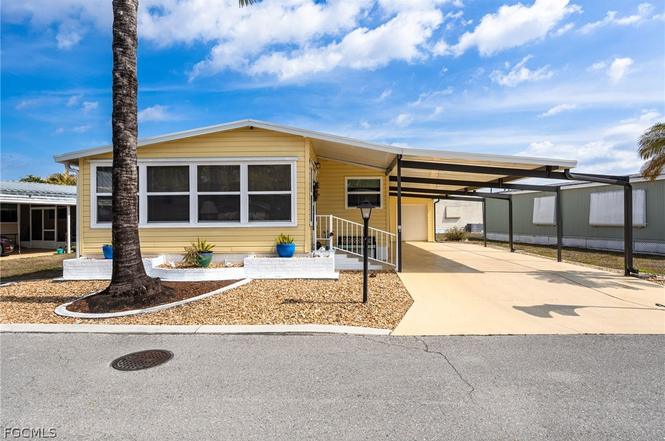
447 Snead Dr · North Fort Myers, FL
Flood risk 1/10 · Minimal
- FEMA flood zone
- X (unshaded)
- Chance of flooding over 30 yrs
- 0.0%
- Est. flood insurance / yr
- $507 – $1,088
Fire risk 5/10 · Moderate
- Est. fire insurance / yr
- $947 – $1,759
Heat risk 9/10 · Severe
- Hot days now (above 106°F)
- 4 days/yr
- Hot days in 30 yrs
- 18 days/yr
Wind risk 10/10 · Severe
- Chance of severe wind over 30 yrs
- 99.0%
Air-quality risk 2/10 · Minimal
- Unhealthy air days now
- 1 days/yr
- Unhealthy air days in 30 yrs
- 1 days/yr
Risk factors via First Street. Map © Google.
Why this score? — see what drove the D grade
The composite is a weighted blend of 9 inputs, each scored 0–100. Each bar is that input's sub-score; the figure is the points it added to the 100-point composite (weight × sub-score).
- Cash flow +11.1/30.0
- ARV discount +7.5/15.0
- 1% rule +6.2/10.0
- Schools +4.1/10.0
- Livability +3.7/5.0
- DSCR +3.2/10.0
- Condition / age +2.5/5.0
- Rent growth +2.0/5.0
- Appreciation +0.0/10.0
$159,900
🖨 Deal sheet 📄 Offer letter ✓ Due diligence
Listing remarks
Welcome to your dream home in the Six Lakes Country Club! This stunning manufactured home boasts 2 bedrooms and 2 bathrooms, with luxurious granite counters and stainless steel appliances in the kitchen. The new thermal windows flood the space with natural light, highlighting the spacious layout and large kitchen with ample cabinet space. The home comes fully furnished, including a golf cart for easy transportation around the community. Enjoy the convenience of an inside laundry room, 2 walk-in closets, and a new roof for peace of mind. The property also features a new shed and carport. With over 1300 sqft of living space, its perfect for entertaining guests or simply relaxing in style. Don
Key facts
- Corian counters
- Walk-in closets
- Inside laundry room
Tags
Property features AI
Finance
- Other: On-site management; Community has about 595 units; Street lights; Senior community
- Financial info: Pets not allowed
- HOA & community: Homeowners association with quarterly fee; Association fee covers management, cable TV, golf, internet, legal/accounting, grounds maintenance, recreation facilities, reserve fund, road maintenance, and security; Community amenities include clubhouse, fitness center, golf course, pool, spa/hot tub, tennis courts, pickleball, shuffleboard, billiards, billiard room, library, business center, putting greens, restaurant
Exterior
- Parking: Attached carport; 2 covered spaces; Garage door opener
- Security: Gated community with guard and security gate
- Utilities: Public water; Public sewer; Cable available; High-speed internet available
- Home design: Manufactured home with vinyl siding; One story; Entry level: 1; Shingle roof; Resale condition; Zoned MH-2
- Construction: Manufactured construction; Vinyl siding; Shingle roof
- Exterior features: Shutters (manual); Outbuilding; Community pool; Rectangular lot; Private paved road frontage, privately maintained; Property faces southwest; Northeast exposure
Interior
- Kitchen: Dishwasher; Freezer; Microwave; Refrigerator; Self-cleaning oven
- Bedrooms: Den; Florida room
- Flooring: Laminate; Tile
- Bathrooms: 2 full bathrooms
- Heating & cooling: Central heating (electric); Central air conditioning (electric); Ceiling fan(s)
- Interior features: Thermal windows and window coverings; Furnished; Dual sinks; Living/dining room; Pantry; Shower-only bath with separate shower; Cable TV; Walk-in closet(s); Window treatments
- Laundry & utility: Washer hookup inside; Dryer (appliance included); Washer (appliance included)
Neighborhood map
What this means for you Summary
Snapshot
- This is a 2-bed/2.0-bath condo listed at $160k.
Deal economics
- At list price, monthly cash flow is $-65 ($-776/yr) — negative.
- To cash-flow at today's rent, offer at most $148k (7.1% below list).
- Meets the 1% rule at list price ($2k rent vs $160k).
- Recommended offer: $146k (9.0% below list) — sets the bar for market timing.
- Cap rate 5.8% vs local median 3.6% in North Fort Myers — top-decile yield for the area; either an underpriced asset or a hidden risk that comps aren't pricing in. Stress-test before assuming the spread holds.
Location & tenants
- Location reads 74/100 on livability (#269 in FL, #4,409 nationally) — a middle-class / working-renter tenant base. Strengths: cost of living A+, housing A+, health & safety A+; Watch: employment C-, amenities F, commute F.
- Lee (suburban): math 47% / reading 50% proficiency, ranked #42 of 73 in FL (top 58%) — families likely to look elsewhere, expect single-tenant / working-renter base with shorter leases.
- Market conditions: Rents soft (-1.9%/yr); 472 active listings in the ZIP; 29 comparable units currently listed for rent nearby; rentals leasing fast (median 12d on market — plan ~1-2 weeks tenant-placement turnaround); 15,411 units permitted in Lee County in 2024 (4,686 in 5+ unit buildings).
- This rent runs 38% of the median local income ($57k/yr) — at the standard rent-burdened threshold; future hikes will face affordability resistance.
Forward outlook
- Local home prices are declining (-3.0%/yr); year-one equity from $1k of loan paydown is wiped out by about $5k of value loss. Plan a longer hold.
- Lee County population projected at +44% by 2050 — long-run rental-demand tailwind backs the buy-and-hold thesis.
Negotiation context
- It's been on market 105 days — a 9% lower offer ($146k) is reasonable based on typical stale-listing flexibility.
- 3 sale attempts since 21y ago; this cycle's ask has dropped $15k (9%) from the opening price — seller is motivated, your offer sets the floor, not the list.
Risks & watch-outs
- Watch-outs: HOA is 31% of rent.
- Climate carrying-cost: severe wind risk, 99% chance of damaging wind over 30y; moderate wildfire risk; extreme-heat days projected 4→18/yr by 2055 (HVAC capex compounding) — expect insurance premiums to compound above CPI over the hold.
Questions for the listing agent
- What do current leases actually rent for vs. the listed asking? Can we see a recent rent roll and the last 12 months of T-12 income?
- It's been on market 105 days. Have you received any prior offers? Is the seller open to a 9% concession, seller financing, or rate buy-down credit?
- What does the HOA fee cover, when was the last increase, and are there any pending special assessments or reserve-fund shortfalls?
- Any open or pending special assessments — roof, HVAC, plumbing, elevator, façade? What's the per-unit balance and payoff schedule, and is the seller paying it off at close or rolling it to the buyer?
- Why hasn't it sold? Are there any deal-killer items the seller is aware of (foundation, flood, title, zoning, code violations)?
- Is there a deadline driving the sale (1031 exchange, divorce, estate, relocation)? That informs how much negotiation room exists.
- The area grade is low — what's the realistic commute time and amenity access for the typical tenant pool here? Any planned neighborhood developments (good or bad) we should know about?
- What's the average days-on-market for RENTAL listings here right now (not sales)? A rising rental-DOM trend means longer vacancies and softer asking-rent achievability than the comps imply.
- What's the recent tenant-quality profile in this submarket — average credit score on applications, eviction rate, late-payment / NSF rate, and stable-employment percentage? A property-management company in the area should have these aggregated.
- How much new apartment / multifamily construction is in the pipeline within 1–3 miles? Heavy new supply (>2% of stock underway) typically softens rents 12–24 months out; light construction supports rent growth.
Investment metrics
- 1% rule
- 1.12% ✓
- Cap rate
- 5.81%
- Cash-on-cash
- -1.73%
- DSCR
- 0.92
- GRM
- 7.4
CMA / ARV
No comps found within radius.
Projected returns pro-forma
-3.0% appreciation · 0.0% rent growth · sell at horizon
- IRR
- -23.7%
- Equity multiple
- 0.22×
- Total profit
- $-35,033
- Equity at exit
- $23,842
- IRR
- -36.7%
- Equity multiple
- -0.23×
- Total profit
- $-55,094
- Equity at exit
- $13,825
Cash invested: $44,772 (down + closing). Projections, not guarantees.
Landlord ↔ Tenant lean methodology
- Overall (STATE)
- 87 Strongly Landlord-Friendly
- State Florida
- 87 Strongly Landlord-Friendly · R+3
- County
- — inherits STATE
- City
- — inherits STATE
ZIP-level market 33903
- Rents YoY
- -1.9%
- Active inventory
- 472
- Price-to-rent
- 7.4×
Monthly cashflow live
- Estimated rent
- $1,796 high interval (Pro) →
- Mortgage (P&I)
- −$839
- Tax from tax record
- −$28 /mo · $338/yr
- Insurance
- −$67
- HOA
- −$550
- Vacancy / Maint / Mgmt
- −$377
- Net cashflow
- $-65
Break-even live
UW: 25.0% down · 7.5% · 30yr · 1.5% tax · 5.0% vac · 8.0% maint · 8.0% mgmt
Financing live
Cash to close
- Down payment
- $39,975
- Closing costs
- $4,797
- Reserves months
- —
- Total cash needed
- —
Loan-product check · same deal, 3 products live
Conventional
25% down · 7.5% · 30yr
- Down + closing
- —
- Monthly P&I
- —
- Monthly cashflow
- —
- DSCR
- —
- Eligible?
- —
Personal DTI + credit; lowest rate.
DSCR
20% down · 8.5% · 30yr
- Down + closing
- —
- Monthly P&I
- —
- Monthly cashflow
- —
- DSCR
- —
- Eligible?
- —
No personal income docs; deal must DSCR.
Hard money
10% down · 12.0% · 12mo
- Down + closing
- —
- Monthly P&I
- —
- Monthly cashflow
- —
- DSCR
- —
- Eligible?
- —
Short-term bridge; refi at stabilization.
Rent comps 29 comps
| Address | Beds | Baths | Sqft | Rent | $/sqft | DOM | Units | Dist |
|---|---|---|---|---|---|---|---|---|
| 2700 Diplomat Pkwy E Cape Coral, FL | 1.0–3.0 | 1.0–2.0 | 1116 | $2,382 | $2.13 | 3d | 41 | 0.29mi |
| 571 Sunrise Ln North Fort Myers, FL | 2.0 | 2.0 | 1004 | $1,400 | $1.39 | 23d | 1 | 0.53mi |
| 8791 Littleton Rd North Fort Myers, FL | 2.0 | 2.0 | 1074 | $1,549 | $1.44 | 23d | 1 | 0.63mi |
| 3260 Stockton St North Fort Myers, FL | 3.0 | 1.0–2.0 | 976 | $2,371 | $2.43 | 1d | 27 | 0.76mi |
| 3050 Steeple Cir Cape Coral, FL | 1.0–3.0 | 1.0–2.0 | 1003 | $1,668 | $1.66 | 2d | 27 | 0.77mi |
| 28 Nyborg Ave North Fort Myers, FL | 3.0 | 2.0 | 1042 | $1,299 | $1.25 | 14d | 1 | 0.90mi |
| 2309 NE 15th Ln Cape Coral, FL | 3.0 | 2.0 | 1250 | $1,595 | $1.28 | 3d | 1 | 0.90mi |
| 2116 NE 22nd Ave Cape Coral, FL | 3.0 | 2.0 | 1759 | $2,200 | $1.25 | 15d | 1 | 0.94mi |
| 2116 NE 22nd Ave Cape Coral, FL | 3.0 | 2.0 | 1759 | $2,195 | $1.25 | 3d | 1 | 0.94mi |
| 2627 Riverfield Rd Cape Coral, FL | 3.0 | 2.5 | 1324 | $1,424 | $1.08 | 23d | 1 | 0.95mi |
| 2221 NE 15th Ln Cape Coral, FL | 2.0 | 2.0 | 1400 | $1,675 | $1.20 | 15d | 1 | 0.98mi |
| 2505 Liberty Park Dr Cape Coral, FL | 1.0–2.0 | 1.0–2.0 | 1092 | $2,203 | $2.02 | 2d | 14 | 1.01mi |
| 538 State St North Fort Myers, FL | 3.0 | 1.5 | 1000 | $1,199 | $1.20 | 23d | 1 | 1.02mi |
| 2044 NE 20th Ter Cape Coral, FL | 3.0 | 2.0 | 1800 | $1,745 | $0.97 | 13d | 1 | 1.08mi |
| 2500 Ne Pine Island Rd North Fort Myers, FL | 1.0–3.0 | 1.0–2.0 | 962 | $2,018 | $2.10 | 3d | 19 | 1.08mi |
| 3404 Rainbow Ln North Fort Myers, FL | 2.0 | 2.0 | 1056 | $1,800 | $1.70 | 3d | 1 | 1.09mi |
| 2116 NE 25th St Cape Coral, FL | 3.0 | 2.0 | 1352 | $1,891 | $1.40 | 3d | 1 | 1.12mi |
| 446 San Bernardino St North Fort Myers, FL | 2.0 | 1.0 | 1104 | $1,590 | $1.44 | 10d | 1 | 1.15mi |
| 2105 NE 15th Ter Cape Coral, FL | 3.0 | 2.0 | 1621 | $1,895 | $1.17 | 11d | 1 | 1.16mi |
| 2864 Star Coral Dr Unit Na North Fort Myers, FL | 3.0 | 2.0 | 1614 | $1,999 | $1.24 | 23d | 1 | 1.28mi |
| 2022 NE 25th Ter Cape Coral, FL | 3.0 | 2.0 | 1600 | $2,300 | $1.44 | 3d | 1 | 1.29mi |
| 2006 NE 15th Ter Cape Coral, FL | 3.0 | 2.0 | 1141 | $1,999 | $1.75 | 10d | 1 | 1.29mi |
| 260 Stockton St North Fort Myers, FL | 2.0 | 2.0 | 924 | $1,200 | $1.30 | 3d | 1 | 1.32mi |
| 1125 Winding Pines Cir #207 Cape Coral, FL | 2.0 | 2.0 | 1338 | $1,550 | $1.16 | 23d | 1 | 1.32mi |
| 247 Stockton St North Fort Myers, FL | 3.0 | 2.0 | 924 | $1,325 | $1.43 | 23d | 1 | 1.34mi |
| 248 Stockton St North Fort Myers, FL | 3.0 | 2.0 | 924 | $1,300 | $1.41 | 23d | 1 | 1.35mi |
| 1085 Hancock Creek South Blvd #203 Cape Coral, FL | 2.0 | 2.0 | 1199 | $1,475 | $1.23 | 3d | 1 | 1.40mi |
| 1030 Hancock Creek South Blvd #204 Cape Coral, FL | 2.0 | 2.0 | 1199 | $1,350 | $1.13 | 23d | 1 | 1.42mi |
| 1080 Hancock Creek South Blvd #201 Cape Coral, FL | 2.0 | 2.0 | 1199 | $1,600 | $1.33 | 23d | 1 | 1.45mi |
HOA detail condo
- Monthly dues
- $550 · $6,600/yr
- Assessments
- None detected in remarks — confirm with the listing agent.
Listing history 16 events
-
2026-06-17price $159,900 Active 105 DOM
-
2026-06-17days on market $164,900 Active 105 DOM
-
2026-06-16days on market $164,900 Active 104 DOM
-
2026-06-15days on market $164,900 Active 103 DOM
-
2026-06-13days on market $164,900 Active 101 DOM
-
2026-06-10days on market $164,900 Active 98 DOM
-
2026-06-09days on market $164,900 Active 97 DOM
-
2026-06-07days on market $164,900 Active 95 DOM
-
2026-06-02days on market $164,900 Active 90 DOM
-
2026-06-01days on market $164,900 Active 89 DOM
-
2026-06-01days on market $164,900 Active 88 DOM
-
2026-04-17status Active
-
2026-04-07status Pending
-
2026-03-09price $164,900
-
2026-02-22$174,900 Active
-
2005-02-19$82,900
ⓘ Source: listings_history table (triggers on properties + properties_extension) + one-shot
backfill from property_details.listing_events for pre-trigger history.
Tax reassessment forecast FL · Resets to sale price
- Current annual tax
- $338 · $28/mo
- Projected year-2 tax
- $1,327 · $111/mo
- Expected delta
- +$989/yr (+$82/mo · 292.3%)
ⓘ Screening estimate from a state-policy table — verify with the county assessor before closing.
Climate risk First Street
- Flood 1/10 Low FEMA zone X (unshaded) · 0% chance over 30 yrs
- Wildfire 5/10 Major
- Heat 9/10 Extreme 4 d/yr ≥106°F today · 18 d/yr by 30 yrs out
- Wind 10/10 Extreme 99% chance of damaging wind over 30 yrs
- Air quality 2/10 Low 1 unhealthy d/yr today · 1 by 30 yrs out
Nearby sold comps map
Loading sold comps map…
Walkable amenities ~0.75 mi
Loading nearby amenities…
Taxation est. · year 1
- Rental income
- $21,549
- − Mortgage interest
- −$8,957
- − Property taxes
- −$338
- − Insurance
- −$800
- − Repairs & maintenance
- −$1,724
- − Management
- −$1,724
- − HOA
- −$6,600
- − Depreciation
- −$4,652
- Taxable loss
- −$3,245
- Est. tax savings @ 24.0%
- +$779
- After-tax cash flow
- $3/yr
For passive investors: Depreciation is non-cash, so a rental often shows a tax loss while cash-flowing — sheltering income. Rental losses are passive: they offset passive income freely, and up to $25,000/yr can offset ordinary (W-2) income if you actively participate and your MAGI is under $100k (phasing out to $0 by $150k); unused losses carry forward. On sale, claimed depreciation is recaptured at up to 25%, and gains may owe capital-gains tax (a 1031 exchange can defer both). Figures are a year-1 estimate at your 24.0% rate — not tax advice; consult a CPA.
Schools (NCES district)
- District
- Lee
- NCES district ID
- 1201080
- Math proficiency
- 47% ▼ -11.00%
- Reading proficiency
- 50% ▼ -4.00%
- Median HH income
- $49,518
- Composite
- 41.49/100
- National rank
- #3458
- State rank
- #42 of 73 in FL
Livability — North Fort Myers
- Score
- 74/100
- State rank
- #269
- US rank
- #4409
Category grades
Schools grade is shown separately in the Schools card above.
Census & demographics
- Census place
- North Fort Myers, FL
- County
- Lee County · 788,662 people
- City population
- 57,035
- Metro
- Cape Coral-Fort Myers, FL
- Population (ZIP)
- 23,655
- Household income
- $56,993
- Rent vs Own
- Severe rent burden
- 468.0
Population outlook (Lee County) Hauer SSP2
- Today (2025)
- 871,946 people
- By 2030
- 955,468 · +9.6%
- By 2040
- 1,113,587 · +27.7%
- By 2050
- 1,256,891 · +44.1%
- By 2075
- 1,560,270 · +78.9%
- By 2100
- 1,726,848 · +98.0%
Race, ethnicity, and origin ACS 2023
- Neighborhood character
- Predominantly White (81%)
- Race & ethnicity
- White 81% Hispanic / Latino 14% Two or more races 8% Black 2%
- Hispanic origin (detail)
- Mexican 3% Puerto Rican 3% Cuban 3%
- Common ancestry
- Lithuanian 4% Romanian 4% Italian 3%
- Foreign-born
- 11% · Canada
- Languages at home
- 88% English-only · Spanish 9% Other Indo-European 1%
Political lean MEDSL · Lee
- 2024 margin
- Strong R (+28.4) · D 35.5% · R 63.9%
- 2008→2024 swing
- -18.0pp toward R · 2008: -10.4pp · 2024: -28.4pp
- All cycles
- 2024: R+28.4 2020: R+19.2 2016: R+20.4 2012: R+16.6 2008: R+10.4
Not yet ingested
- Civics
- —
Market trends
- HPI YoY
- ▼ -172.26%
- Current HPI
- 256.773
- Rent YoY
- ▼ -1.94%
- Metro
- Cape Coral-Fort Myers, FL
- State GDP YoY
- ▲ 3.28%
- F500 in state
- 36
Industry mix (Fortune 500 HQ in FL)
| Industry | F500 HQs | Revenue |
|---|---|---|
| Industrial Technology | 2 | $29B |
|
||
| Insurance | 2 | $17B |
|
||
| Retail | 1 | $60B |
|
||
| Technology Distribution | 1 | $58B |
|
||
| Homebuilding | 1 | $35B |
|
||
| Technology Manufacturing | 1 | $35B |
|
||
Price history
+98.9% since first listed5 events — show timeline
- 2026-04-17 Relisted — FORTMLS
- 2026-04-07 Pending — FORTMLS
- 2026-03-09 Price Changed $164,900 FORTMLS
- 2026-02-22 Listed $174,900 FORTMLS
- 2005-02-19 Listed $82,900 FORTMLS
Property tax history
-8.1%/yrLatest (2025): $338 · +2.8% YoY. Source: county tax records.
Cash-flow waterfall
monthlySold comps — $/sqft
last 12 mo · ≤1 miLoading sold comps…