 Duplex
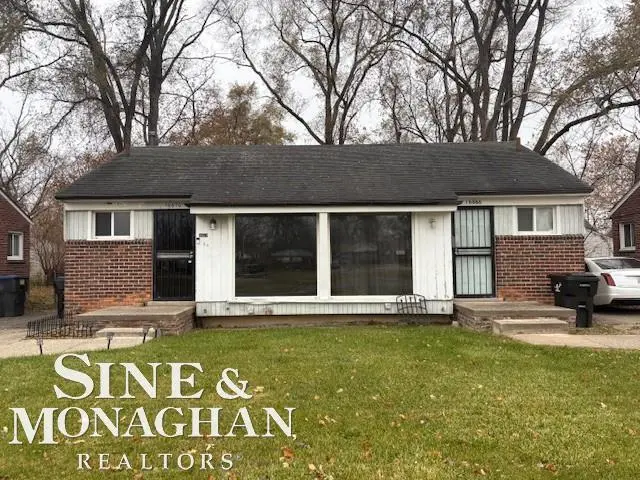
16666 E 8 Mile Rd · Detroit, MI
Flood risk 1/10 · Minimal
- FEMA flood zone
- X (unshaded)
- Chance of flooding over 30 yrs
- 0.0%
- Est. flood insurance / yr
- $507 – $1,088
Fire risk 1/10 · Minimal
- Est. fire insurance / yr
- $784 – $1,456
Heat risk 3/10 · Minor
- Hot days now (above 96°F)
- 7 days/yr
- Hot days in 30 yrs
- 15 days/yr
Wind risk 2/10 · Minimal
- Chance of severe wind over 30 yrs
- —
Air-quality risk 3/10 · Minor
- Unhealthy air days now
- 3 days/yr
- Unhealthy air days in 30 yrs
- 4 days/yr
Risk factors via First Street. Map © Google.
Why this score? — see what drove the B- grade
The composite is a weighted blend of 9 inputs, each scored 0–100. Each bar is that input's sub-score; the figure is the points it added to the 100-point composite (weight × sub-score).
- Cash flow +30.0/30.0
- 1% rule +10.0/10.0
- DSCR +10.0/10.0
- ARV discount +7.8/15.0
- Livability +3.7/5.0
- Rent growth +2.8/5.0
- Condition / age +2.2/5.0
- Schools +1.3/10.0
- Appreciation +0.0/10.0
$75,000
🖨 Deal sheet 📄 Offer letter ✓ Due diligence
Multi-family units
County records classify this as Multi-Family (2-4 Unit). Listing-text estimate: 2 units. confirmed
Listing remarks MLS
This is a side by side duplex-one bedroom unit each with private basements; separate driveways, separate utilities (including water); The property was sold twice. .. and both times the buyer's financing fell through (though no fault of the property). The seller was burned twice. .. The seller wants an offer now, so the seller did a huge price reduction. This is now a cash only transaction. This property makes money. .. one side was bringing in $535 (long term tenant) and $675 on the other. A few amenities of the property: vinyl windows; glass block windows with vents; wood flooring in the living rooms and bedrooms; profit to be made from day one of ownership!
Key facts
- Wood flooring
- Separate utilities
- Vinyl windows
Tags
Property features AI
Finance
- Other: Located near E. Eight Mile Road and Kelly; Subdivision: Tepperts Golf Park
- Financial info: Annual tax information available
Exterior
- Utilities: Public water; Public sewer
- Home design: One-level building; Residential income, multi-family property; Brick construction
- Construction: Brick exterior; Concrete basement
- Exterior features: Lot roughly 54 x 110 (0.13 acres)
Interior
- Bathrooms: 2 full bathrooms
- Heating & cooling: Forced air heating; Natural gas heating; Separate meters for heating; No central cooling
- Interior features: Gas water heater; Basement with concrete foundation
Neighborhood map
What this means for you Summary
Snapshot
- This is a 2 × 1-bed/1.0-bath units multifamily listed at $75k. Condition is rated fair.
Deal economics
- At list price, monthly cash flow is $991 ($12k/yr) — positive. Per door: $496/mo.
- The deal already cash-flows at list — no discount required.
- Meets the 1% rule at list price ($2k rent vs $75k).
- Recommended offer: $73k (3.0% below list) — sets the bar for market timing.
- Cap rate 22.2% vs local median 10.2% in Detroit — top-decile yield for the area; either an underpriced asset or a hidden risk that comps aren't pricing in. Stress-test before assuming the spread holds.
Location & tenants
- Location reads 73/100 on livability (#218 in MI) — a middle-class / working-renter tenant base. Strengths: amenities A+, commute A+, cost of living A+; Watch: schools F, crime F, employment F.
- Detroit Public Schools Community District (urban): math 10% / reading 24% proficiency, ranked #499 of 540 in MI (top 92%) — low school quality limits family demand, transient renter base, plan for 1-2y turnover; 90% free/reduced lunch — lower-income household profile, screen leases tightly.
- Market conditions: Rents rising (+1.3%/yr); 373 active listings in the ZIP; 12 comparable units currently listed for rent nearby; rentals at typical pace (median 17d on market — plan ~3-4 weeks tenant-placement turnaround); lower-income renter base — watch delinquency; 2,639 units permitted in Wayne County in 2024 (1,216 in 5+ unit buildings).
- At $1,911/mo this rent would consume 59% of the median local household income ($39k/yr) (locally 2121% of renters already pay >50% of income on rent) — very limited rent-growth headroom before tenants either downsize or default.
Forward outlook
- Local home prices are declining (-3.0%/yr); year-one equity from $519 of loan paydown is wiped out by about $2k of value loss. Plan a longer hold.
- Wayne County population projected at -17% by 2050 — secular population decline; favor cash flow + early exit over multi-decade hold.
- At projected returns (-3.0% appreciation + 1.3% rent growth), your $21k cash investment doubles in ~3 years — after that, you're playing with house money.
Negotiation context
- It's been on market 37 days — a 3% lower offer ($73k) is reasonable based on typical stale-listing flexibility.
- 8 sale attempts with the ask held roughly flat each time — persistent listings suggest the price (not the market) is what's stuck; bring a comps-based counter.
Risks & watch-outs
- Watch-outs: built in 1950 — expect roof / HVAC / electrical / plumbing capex.
Questions for the listing agent
- It's been on market 37 days. Have you received any prior offers? Is the seller open to a 3% concession, seller financing, or rate buy-down credit?
- Can we see the unit-by-unit rent roll, current vacancy, and any below-market leases? What's the average tenancy length?
- What capital expenditures (roof, boiler, parking lot, exteriors) have been made in the last 5 years, and what's planned in the next 2?
- Have any recent inspections been done? Can we get a copy of the seller's disclosures and any deferred-maintenance estimates?
- Built in 1950 — when were the roof, HVAC, electrical panel, plumbing, and water heater last replaced?
- Is there a deadline driving the sale (1031 exchange, divorce, estate, relocation)? That informs how much negotiation room exists.
- Schools are F-rated, which usually means shorter tenancies and higher turnover. Who's the typical renter profile here, and what's been the actual vacancy rate?
- Crime grade is F in this area — have there been break-ins, vandalism, or insurance claims at this property in the last 3 years? What carrier currently insures it and at what premium?
- What's the average days-on-market for RENTAL listings here right now (not sales)? A rising rental-DOM trend means longer vacancies and softer asking-rent achievability than the comps imply.
- What's the recent tenant-quality profile in this submarket — average credit score on applications, eviction rate, late-payment / NSF rate, and stable-employment percentage? A property-management company in the area should have these aggregated.
- How much new apartment / multifamily construction is in the pipeline within 1–3 miles? Heavy new supply (>2% of stock underway) typically softens rents 12–24 months out; light construction supports rent growth.
Investment metrics
- 1% rule
- 2.55% ✓
- Cap rate
- 22.16%
- Cash-on-cash
- 56.65%
- DSCR
- 3.52
- GRM
- 3.3
CMA / ARV
- ARV (median comp)
- $75,464
- List price
- $75,000
- Delta
- -0.61%
- Verdict
- FAIR
- Comps
- 11 within 2.0 mi
Projected returns pro-forma
-3.0% appreciation · 1.33% rent growth · sell at horizon
- IRR
- 53.2%
- Equity multiple
- 3.28×
- Total profit
- $47,859
- Equity at exit
- $11,183
- IRR
- 57.7%
- Equity multiple
- 6.26×
- Total profit
- $110,563
- Equity at exit
- $6,485
Cash invested: $21,000 (down + closing). Projections, not guarantees.
Landlord ↔ Tenant lean methodology
- Overall (STATE)
- 62 Landlord-Friendly
- State Michigan
- 62 Landlord-Friendly · EVEN
- County
- — inherits STATE
- City
- — inherits STATE
ZIP-level market 48205
- Home prices YoY
- -28.1%
- Rents YoY
- 1.3%
- Active inventory
- 373
- Price-to-rent
- 6.5×
Monthly cashflow live
- Estimated rent
- $1,911 medium interval (Pro) →
- Mortgage (P&I)
- −$393
- Tax est. 1.5%
- −$94 /mo · $1,125/yr
- Insurance
- −$31
- HOA
- −$0
- Vacancy / Maint / Mgmt
- −$401
- Net cashflow
- $991
Break-even live
2-unit breakdown (identical units grouped — click to expand)
| Units | Beds | Baths | Est. rent |
|---|---|---|---|
| 2× units | 1 | 1 | $1,912 |
| #1 | 1 | 1 | $956 |
| #2 | 1 | 1 | $956 |
| Total (2 units) | $1,911 | ||
UW: 25.0% down · 7.5% · 30yr · 1.5% tax · 5.0% vac · 8.0% maint · 8.0% mgmt
Financing live
Cash to close
- Down payment
- $18,750
- Closing costs
- $2,250
- Reserves months
- —
- Total cash needed
- —
Loan-product check · same deal, 3 products live
Conventional
25% down · 7.5% · 30yr
- Down + closing
- —
- Monthly P&I
- —
- Monthly cashflow
- —
- DSCR
- —
- Eligible?
- —
Personal DTI + credit; lowest rate.
DSCR
20% down · 8.5% · 30yr
- Down + closing
- —
- Monthly P&I
- —
- Monthly cashflow
- —
- DSCR
- —
- Eligible?
- —
No personal income docs; deal must DSCR.
Hard money
10% down · 12.0% · 12mo
- Down + closing
- —
- Monthly P&I
- —
- Monthly cashflow
- —
- DSCR
- —
- Eligible?
- —
Short-term bridge; refi at stabilization.
Rent comps 12 comps
| Address | Beds | Baths | Sqft | Rent | $/sqft | DOM | Units | Dist |
|---|---|---|---|---|---|---|---|---|
| 16410 Edmore Dr Detroit, MI | 3.0 | 1.0 | 850 | $1,250 | $1.47 | 14d | 1 | 0.27mi |
| 16291 Eastburn St Detroit, MI | 3.0 | 1.0 | 1000 | $1,364 | $1.36 | 24d | 1 | 0.38mi |
| 16225 Manning St Detroit, MI | 4.0 | 2.0 | 1036 | $1,475 | $1.42 | 43d | 1 | 0.67mi |
| 19152 Woodside St Harper Woods, MI | 3.0 | 1.0 | 916 | $1,500 | $1.64 | 17d | 1 | 0.96mi |
| 15909 Maddelein St Detroit, MI | 3.0 | 1.0 | 894 | $1,266 | $1.42 | 43d | 1 | 1.03mi |
| 20015 Lochmoor St Harper Woods, MI | 3.0 | 1.0 | 1006 | $1,500 | $1.49 | 16d | 1 | 1.15mi |
| 19365 Kingsville St Harper Woods, MI | 4.0 | 1.5 | 996 | $1,650 | $1.66 | 14d | 1 | 1.24mi |
| 19661 Kenosha St Harper Woods, MI | 3.0 | 2.0 | 1000 | $1,400 | $1.40 | 24d | 1 | 1.30mi |
| 19442 Kingsville St Harper Woods, MI | 3.0 | 1.0 | 1000 | $1,500 | $1.50 | 17d | 1 | 1.31mi |
| 12716 Riad St Detroit, MI | 3.0 | 1.0 | 974 | $1,275 | $1.31 | 17d | 1 | 1.32mi |
| 12075 Rossiter St Detroit, MI | 3.0 | 1.0 | 1100 | $1,245 | $1.13 | 14d | 1 | 1.40mi |
| 12075 Rossiter St Detroit, MI | 3.0 | 1.0 | 1100 | $1,245 | $1.13 | 43d | 1 | 1.40mi |
Listing history 29 events
-
2026-06-18days on market $75,000 Active 37 DOM
-
2026-06-17days on market $75,000 Active 36 DOM
-
2026-06-15days on market $75,000 Active 34 DOM
-
2026-06-13days on market $75,000 Active 32 DOM
-
2026-06-13days on market $75,000 Active 31 DOM
-
2026-06-09days on market $75,000 Active 28 DOM
-
2026-06-08days on market $75,000 Active 27 DOM
-
2026-06-07days on market $75,000 Active 26 DOM
-
2026-06-04days on market $75,000 Active 23 DOM
-
2026-06-03days on market $75,000 Active 22 DOM
-
2026-06-02days on market $75,000 Active 21 DOM
-
2026-06-01days on market $75,000 Active 20 DOM
-
2026-05-31days on market $75,000 Active 19 DOM
-
2026-05-11$75,000 Active 668-char remark
Show marketing remark (668 chars)
This is a side by side duplex-one bedroom unit each with private basements; separate driveways, separate utilities (including water); The property was sold twice. .. and both times the buyer's financing fell through (though no fault of the property). The seller was burned twice. .. The seller wants an offer now, so the seller did a huge price reduction. This is now a cash only transaction. This property makes money. .. one side was bringing in $535 (long term tenant) and $675 on the other. A few amenities of the property: vinyl windows; glass block windows with vents; wood flooring in the living rooms and bedrooms; profit to be made from day one of ownership!
-
2026-05-07historical
-
2026-05-04status Active
-
2026-05-04status Active
-
2026-04-24historical Active Under Contract
-
2026-04-24historical Accepting Backup Offers
-
2026-04-08status Active
-
2026-04-08status Back on Market
-
2026-04-02status Pending
-
2026-04-02status Pending
-
2026-04-02historical
-
2026-03-17price $92,500
-
2026-03-17price $92,500
-
2025-11-25$99,900 Active
-
2025-11-25$99,900 Active
ⓘ Source: listings_history table (triggers on properties + properties_extension) + one-shot
backfill from property_details.listing_events for pre-trigger history.
Climate risk First Street
- Flood 1/10 Low FEMA zone X (unshaded) · 0% chance over 30 yrs
- Wildfire 1/10 Low
- Heat 3/10 Moderate 7 d/yr ≥96°F today · 15 d/yr by 30 yrs out
- Wind 2/10 Low
- Air quality 3/10 Moderate 3 unhealthy d/yr today · 4 by 30 yrs out
Nearby sold comps map
Loading sold comps map…
Walkable amenities ~0.75 mi
Loading nearby amenities…
Taxation est. · year 1
- Rental income
- $22,932
- − Mortgage interest
- −$4,201
- − Property taxes
- −$1,125
- − Insurance
- −$375
- − Repairs & maintenance
- −$1,835
- − Management
- −$1,835
- − Depreciation
- −$2,182
- Taxable income
- $11,380
- Est. tax owed @ 24.0%
- −$2,731
- After-tax cash flow
- $9,165/yr
For passive investors: Depreciation is non-cash, so a rental often shows a tax loss while cash-flowing — sheltering income. Rental losses are passive: they offset passive income freely, and up to $25,000/yr can offset ordinary (W-2) income if you actively participate and your MAGI is under $100k (phasing out to $0 by $150k); unused losses carry forward. On sale, claimed depreciation is recaptured at up to 25%, and gains may owe capital-gains tax (a 1031 exchange can defer both). Figures are a year-1 estimate at your 24.0% rate — not tax advice; consult a CPA.
Condition & rehab AI · 12 photos
This side-by-side duplex is in fair condition with cosmetic updates needed. The property is move-in ready with minor repairs and maintenance required.
Repairs flagged
- Minor kitchen cabinets — existing cabinets show wear
- Minor bathroom fixtures — existing fixtures show wear
- Minor exterior siding — existing siding shows minor wear
Value-add opportunities
- Both paint interior walls — enhances curb appeal and interior aesthetics
- Both replace kitchen cabinets — modernizes kitchen and increases value
- Both replace bathroom fixtures — modernizes bathroom and increases value
Renovation cost estimate screening
| Repair item | Severity | Est. cost |
|---|---|---|
| kitchen cabinets · existing cabinets show wear | Minor | $500–3,000 |
| bathroom fixtures · existing fixtures show wear | Minor | $500–3,000 |
| exterior siding · existing siding shows minor wear | Minor | $500–3,000 |
| Total estimated repair cost · 3 items | $1,500–9,000 |
Value-add ROI direction
- Both paint interior walls — enhances curb appeal and interior aesthetics ↑
- Both replace kitchen cabinets — modernizes kitchen and increases value ↑
- Both replace bathroom fixtures — modernizes bathroom and increases value ↑
ⓘ Cost ranges are severity-bucket heuristics (US national rule-of-thumb). Get contractor quotes + a written scope before underwriting a rehab budget.
Schools (NCES district)
- District
- Detroit Public Schools Community District
- NCES district ID
- 2601103
- Math proficiency
- 10% ▼ -2.00%
- Reading proficiency
- 24% ▲ 6.00%
- Median HH income
- $25,815
- Composite
- 13.06/100
- National rank
- #9564
- State rank
- #499 of 540 in MI
Livability — Detroit
- Score
- 73/100
- State rank
- #218
- US rank
- #5427
Category grades
Schools grade is shown separately in the Schools card above.
Census & demographics
- Census place
- Detroit, MI
- County
- Wayne County · 1,562,939 people
- City population
- 572,865
- Metro
- Detroit-Warren-Dearborn, MI
- Population (ZIP)
- 34,187
- Household income
- $38,966
- Rent vs Own
- Severe rent burden
- 2121.0
Population outlook (Wayne County) Hauer SSP2
- Today (2025)
- 1,675,273 people
- By 2030
- 1,620,300 · -3.3%
- By 2040
- 1,502,341 · -10.3%
- By 2050
- 1,384,039 · -17.4%
- By 2075
- 1,124,592 · -32.9%
- By 2100
- 881,193 · -47.4%
Race, ethnicity, and origin ACS 2023
- Neighborhood character
- Predominantly Black (93%)
- Race & ethnicity
- Black 93% White 3% Two or more races 2%
- Foreign-born
- 1% · Canada
- Languages at home
- 98% English-only · Spanish 1%
Political lean MEDSL · Wayne
- 2024 margin
- Strong D (+29.0) · D 62.7% · R 33.7% · Other 3.6%
- 2008→2024 swing
- -20.5pp toward R · 2008: 49.5pp · 2024: 29.0pp
- All cycles
- 2024: D+29.0 2020: D+38.1 2016: D+37.3 2012: D+46.9 2008: D+49.5
Not yet ingested
- Civics
- —
Market trends
- HPI YoY
- ▼ -91.80%
- Current HPI
- 235.0926
- Rent YoY
- ▲ 1.33%
- Metro
- Detroit-Warren-Dearborn, MI
- State GDP YoY
- ▲ 1.37%
- F500 in state
- 28
Industry mix (Fortune 500 HQ in MI)
| Industry | F500 HQs | Revenue |
|---|---|---|
| Automotive Parts | 3 | $48B |
|
||
| Automotive | 2 | $372B |
|
||
| Chemicals | 1 | $45B |
|
||
| Automotive Retail | 1 | $29B |
|
||
| Healthcare / Medical Devices | 1 | $23B |
|
||
| Automotive Technology | 1 | $20B |
|
||
Price history
-24.9% since first listed16 events — show timeline
- 2026-05-11 Listed $75,000 REALCOMP
- 2026-05-11 Listed $75,000 MiRealSource-MiMLS
- 2026-05-07 Listing Removed — MiRealSource-MiMLS
- 2026-05-04 Relisted — REALCOMP
- 2026-05-04 Relisted — MiRealSource-MiMLS
- 2026-04-24 Contingent — REALCOMP
- 2026-04-24 Contingent — MiRealSource-MiMLS
- 2026-04-08 Relisted — REALCOMP
- 2026-04-08 Relisted — MiRealSource-MiMLS
- 2026-04-02 Pending — REALCOMP
- 2026-04-02 Pending — MiRealSource-MiMLS
- 2026-04-02 Listing Removed — REALCOMP
- 2026-03-17 Price Changed $92,500 MiRealSource-MiMLS
- 2026-03-17 Price Changed $92,500 REALCOMP
- 2025-11-25 Listed $99,900 REALCOMP
- 2025-11-25 Listed $99,900 MiRealSource-MiMLS
Cash-flow waterfall
monthlySold comps — $/sqft
last 12 mo · ≤1 miLoading sold comps…