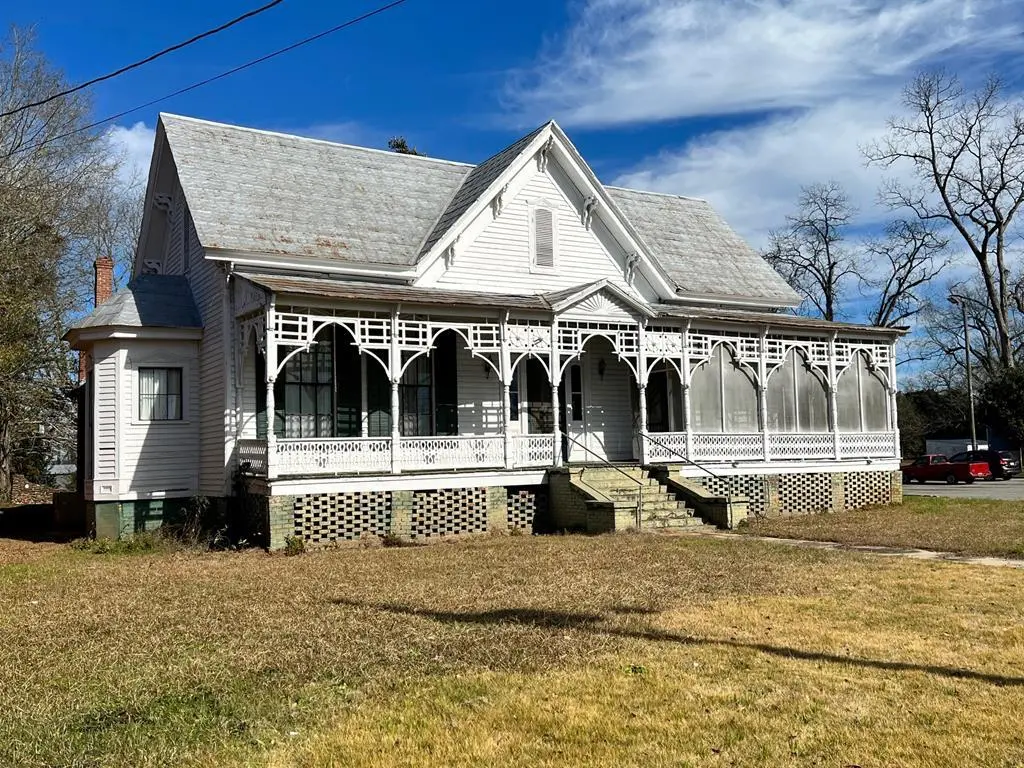
34 Eufaula Ave · Clayton, AL
Flood risk No data
- FEMA flood zone
- —
- Chance of flooding over 30 yrs
- —
- Est. flood insurance / yr
- —
Fire risk No data
- Est. fire insurance / yr
- —
Heat risk No data
- Hot days now (above threshold)
- —
- Hot days in 30 yrs
- —
Wind risk No data
- Chance of severe wind over 30 yrs
- —
Air-quality risk No data
- Unhealthy air days now
- —
- Unhealthy air days in 30 yrs
- —
Risk factors via First Street. Map © Google.
Why this score? — see what drove the B grade
The composite is a weighted blend of 9 inputs, each scored 0–100. Each bar is that input's sub-score; the figure is the points it added to the 100-point composite (weight × sub-score).
- Cash flow +30.0/30.0
- DSCR +10.0/10.0
- 1% rule +9.1/10.0
- ARV discount +9.0/15.0
- Appreciation +6.9/10.0
- Livability +2.7/5.0
- Rent growth +2.5/5.0
- Condition / age +2.2/5.0
- Schools +1.4/10.0
$85,000
🖨 Deal sheet 📄 Offer letter ✓ Due diligence
Listing remarks
Great place to operate a food business or residential. Once a restaurant with dining. Lots of charm and some equiptment to remain. Only has 2 bathrooms no showers or tubs. Has been rewired, has gas utility but must have new gas tank. Several burners and cookers need gas. It does have hot water heater. lots of charm and history with this home. Needs plumbing work and has had some electrical done. This could be a gem again. Seller is motivated but will not rent or owner finance. Reduced $10,000.00 SELLER SAYS SELL!! Must see! call Sherrin Mira or your favorite Realtor.
Key facts
- 0.8 acre lot
- Built 1890
- Listed 520 days
Property features AI
Finance
- Financial info: Annual tax amount reported
Exterior
- Utilities: Public water; Public sewer
- Home design: Single-family residence; One story; Residential zoning
- Construction: Wood siding and frame construction
- Exterior features: Metal roof
Interior
- Bathrooms: Two half bathrooms
- Interior features: Crawl space basement
Neighborhood map
What this means for you Summary
Snapshot
- This is a 3-bed/1.0-bath single-family listed at $85k. Condition is rated fair.
Deal economics
- At list price, monthly cash flow is $356 ($4k/yr) — positive.
- The deal already cash-flows at list — no discount required.
- Meets the 1% rule at list price ($1k rent vs $85k).
- Recommended offer: $75k (12.0% below list) — sets the bar for market timing.
Location & tenants
- Location reads 54/100 on livability (#453 in AL) — a working-class tenant base; expect higher turnover. Strengths: cost of living A+; Watch: health & safety D, schools F, amenities F.
- Barbour County (rural): math 10% / reading 16% proficiency, ranked #133 of 133 in AL (top 100%) — low school quality limits family demand, transient renter base, plan for 1-2y turnover; 95% free/reduced lunch — lower-income household profile, screen leases tightly.
- Market conditions: 16 active listings in the ZIP; 34 units permitted in Barbour County in 2024 (0 in 5+ unit buildings).
Forward outlook
- In year one you build about $4k of equity ($588 loan paydown + $3k appreciation (3.7% local appreciation)).
- Barbour County population projected at -23% by 2050 — secular population decline; favor cash flow + early exit over multi-decade hold.
- At projected returns (3.7% appreciation + 3.0% rent growth), your $24k cash investment doubles in ~3 years — after that, you're playing with house money.
- By year 9, paydown + projected appreciation supports a ~$32k cash-out refi (75% LTV) — recoverable capital for the next deal without selling this one.
Negotiation context
- It's been on market 520 days — a 12% lower offer ($75k) is reasonable based on typical stale-listing flexibility.
- 3 sale attempts since 4y ago; this cycle's ask has dropped $34k (29%) from the opening price — seller is motivated, your offer sets the floor, not the list.
Risks & watch-outs
- Watch-outs: built in 1890 — expect roof / HVAC / electrical / plumbing capex.
Questions for the listing agent
- It's been on market 520 days. Have you received any prior offers? Is the seller open to a 12% concession, seller financing, or rate buy-down credit?
- Have any recent inspections been done? Can we get a copy of the seller's disclosures and any deferred-maintenance estimates?
- Built in 1890 — when were the roof, HVAC, electrical panel, plumbing, and water heater last replaced?
- Why hasn't it sold? Are there any deal-killer items the seller is aware of (foundation, flood, title, zoning, code violations)?
- Is there a deadline driving the sale (1031 exchange, divorce, estate, relocation)? That informs how much negotiation room exists.
- Schools are F-rated, which usually means shorter tenancies and higher turnover. Who's the typical renter profile here, and what's been the actual vacancy rate?
- What's the average days-on-market for RENTAL listings here right now (not sales)? A rising rental-DOM trend means longer vacancies and softer asking-rent achievability than the comps imply.
- What's the recent tenant-quality profile in this submarket — average credit score on applications, eviction rate, late-payment / NSF rate, and stable-employment percentage? A property-management company in the area should have these aggregated.
- How much new for-sale + rental construction is in the pipeline within 1–3 miles? Heavy new supply typically softens prices + rents 12–24 months out; constrained supply supports both.
Investment metrics
- 1% rule
- 1.41% ✓
- Cap rate
- 11.32%
- Cash-on-cash
- 17.97%
- DSCR
- 1.80
- GRM
- 5.9
CMA / ARV
- ARV (median comp)
- $87,853
- List price
- $85,000
- Delta
- -3.25%
- Verdict
- FAIR
- Comps
- 8 within 1.0 mi
Show comp detail 1 sale within ~0.75 mi
| Address | Dist | Beds/Ba | Sqft | Sold | Price | $/sf | Match |
|---|---|---|---|---|---|---|---|
| 71 N Midway St | 0.34mi | 4/2.0 (+1) | 2,800 (+6%) | 17mo | $165,000 | $59 | 51 |
Match score weights: distance 35% · size 25% · config 20% · recency 20%. Top-matched comps best support the ARV.
Projected returns pro-forma
3.74% appreciation · 3.0% rent growth · sell at horizon
- IRR
- 25.9%
- Equity multiple
- 2.53×
- Total profit
- $36,343
- Equity at exit
- $41,826
- IRR
- 26.0%
- Equity multiple
- 4.93×
- Total profit
- $93,544
- Equity at exit
- $67,415
Cash invested: $23,800 (down + closing). Projections, not guarantees.
Landlord ↔ Tenant lean methodology
- Overall (STATE)
- 90 Strongly Landlord-Friendly
- State Alabama
- 90 Strongly Landlord-Friendly · R+15
- County
- — inherits STATE
- City
- — inherits STATE
ZIP-level market 36016
- Home prices YoY
- 2.8%
- Active inventory
- 16
- Price-to-rent
- 5.9×
Monthly cashflow live
- Estimated rent
- $1,195 medium interval (Pro) →
- Mortgage (P&I)
- −$446
- Tax est. 1.5%
- −$106 /mo · $1,275/yr
- Insurance
- −$35
- HOA
- −$0
- Vacancy / Maint / Mgmt
- −$251
- Net cashflow
- $356
Break-even live
UW: 25.0% down · 7.5% · 30yr · 1.5% tax · 5.0% vac · 8.0% maint · 8.0% mgmt
Financing live
Cash to close
- Down payment
- $21,250
- Closing costs
- $2,550
- Reserves months
- —
- Total cash needed
- —
Loan-product check · same deal, 3 products live
Conventional
25% down · 7.5% · 30yr
- Down + closing
- —
- Monthly P&I
- —
- Monthly cashflow
- —
- DSCR
- —
- Eligible?
- —
Personal DTI + credit; lowest rate.
DSCR
20% down · 8.5% · 30yr
- Down + closing
- —
- Monthly P&I
- —
- Monthly cashflow
- —
- DSCR
- —
- Eligible?
- —
No personal income docs; deal must DSCR.
Hard money
10% down · 12.0% · 12mo
- Down + closing
- —
- Monthly P&I
- —
- Monthly cashflow
- —
- DSCR
- —
- Eligible?
- —
Short-term bridge; refi at stabilization.
Listing history 17 events
-
2026-06-14days on market $85,000 Active 520 DOM
-
2026-06-12days on market $85,000 Active 519 DOM
-
2026-06-09days on market $85,000 Active 516 DOM
-
2026-06-08days on market $85,000 Active 515 DOM
-
2026-06-07days on market $85,000 Active 514 DOM
-
2026-06-07days on market $85,000 Active 513 DOM
-
2026-06-04days on market $85,000 Active 510 DOM
-
2026-06-02days on market $85,000 Active 509 DOM
-
2026-06-01days on market $85,000 Active 508 DOM
-
2026-05-31days on market $85,000 Active 507 DOM
-
2026-05-31days on market $85,000 Active 506 DOM
-
2026-03-24price $95,000
-
2025-06-14price $99,000
-
2025-06-14$119,000 Active
-
2023-05-31soldstatus Closed
-
2023-01-31status Active
-
2022-01-20$119,000 Active
ⓘ Source: listings_history table (triggers on properties + properties_extension) + one-shot
backfill from property_details.listing_events for pre-trigger history.
Nearby sold comps map
Loading sold comps map…
Walkable amenities ~0.75 mi
Loading nearby amenities…
Taxation est. · year 1
- Rental income
- $14,336
- − Mortgage interest
- −$4,761
- − Property taxes
- −$1,275
- − Insurance
- −$425
- − Repairs & maintenance
- −$1,147
- − Management
- −$1,147
- − Depreciation
- −$2,473
- Taxable income
- $3,108
- Est. tax owed @ 24.0%
- −$746
- After-tax cash flow
- $3,530/yr
For passive investors: Depreciation is non-cash, so a rental often shows a tax loss while cash-flowing — sheltering income. Rental losses are passive: they offset passive income freely, and up to $25,000/yr can offset ordinary (W-2) income if you actively participate and your MAGI is under $100k (phasing out to $0 by $150k); unused losses carry forward. On sale, claimed depreciation is recaptured at up to 25%, and gains may owe capital-gains tax (a 1031 exchange can defer both). Figures are a year-1 estimate at your 24.0% rate — not tax advice; consult a CPA.
Condition & rehab AI · 12 photos
This property requires extensive repairs and updates to bring it up to a fair condition. The extensive work needed includes repairs to the exterior, kitchen, bathroom, and landscaping. Updates to these areas would significantly increase its resale and rental value.
Repairs flagged
- Major exterior railings — Broken and unsafe
- Major kitchen cabinetry — Worn and outdated
- Major bathroom fixtures — Outdated and in poor condition
- Major landscaping — Overgrown and unkempt
Value-add opportunities
- Both exterior paint — Enhances curb appeal and value
- Both kitchen cabinets — Modernizes and increases functionality
- Both bathroom fixtures — Updates and improves functionality
- Both landscaping — Enhances curb appeal and value
Renovation cost estimate screening
| Repair item | Severity | Est. cost |
|---|---|---|
| exterior railings · Broken and unsafe | Major | $15,000–50,000 |
| kitchen cabinetry · Worn and outdated | Major | $15,000–50,000 |
| bathroom fixtures · Outdated and in poor condition | Major | $15,000–50,000 |
| landscaping · Overgrown and unkempt | Major | $15,000–50,000 |
| Total estimated repair cost · 4 items | $60,000–200,000 |
Value-add ROI direction
- Both exterior paint — Enhances curb appeal and value ↑
- Both kitchen cabinets — Modernizes and increases functionality ↑
- Both bathroom fixtures — Updates and improves functionality ↑
- Both landscaping — Enhances curb appeal and value ↑
ⓘ Cost ranges are severity-bucket heuristics (US national rule-of-thumb). Get contractor quotes + a written scope before underwriting a rehab budget.
Schools (NCES district)
- District
- Barbour County
- NCES district ID
- 0100300
- Math proficiency
- 10% ▼ -5.00%
- Reading proficiency
- 16% ▬ 0.00%
- Median HH income
- $32,058
- Composite
- 13.92/100
- National rank
- #14458
- State rank
- #133 of 133 in AL
Livability — Clayton
- Score
- 54/100
- State rank
- #453
- US rank
- #23745
Category grades
Schools grade is shown separately in the Schools card above.
Census & demographics
- Census place
- Clayton, AL
- Population (ZIP)
- 4,357
Population outlook (Barbour County) Hauer SSP2
- Today (2025)
- 24,533 people
- By 2030
- 23,439 · -4.5%
- By 2040
- 21,129 · -13.9%
- By 2050
- 18,982 · -22.6%
- By 2075
- 14,114 · -42.5%
- By 2100
- 9,180 · -62.6%
Race, ethnicity, and origin ACS 2023
- Race & ethnicity
- Black 49% White 46% Two or more races 3% Asian 1%
- Common ancestry
- Serbian 2% Lithuanian 1%
- Foreign-born
- 2% · South Korea, China, Canada
- Languages at home
- 96% English-only · Spanish 2% Korean 1% Chinese 1%
Political lean MEDSL · Barbour
- 2024 margin
- R (+14.7) · D 42.3% · R 57.0%
- 2008→2024 swing
- -13.3pp toward R · 2008: -1.4pp · 2024: -14.7pp
- All cycles
- 2024: R+14.7 2020: R+7.7 2016: R+5.6 2012: D+2.9 2008: R+1.4
Not yet ingested
- Civics
- —
Market trends
- HPI YoY
- ▲ 3.74%
- Current HPI
- 137.2237
- Rent YoY
- —
- Metro
- —
- State GDP YoY
- ▲ 2.94%
- F500 in state
- 4
Industry mix (Fortune 500 HQ in AL)
| Industry | F500 HQs | Revenue |
|---|---|---|
| Financial Services | 1 | $8B |
|
||
| Healthcare | 1 | $5B |
|
||
Price history
-28.6% since first listed7 events — show timeline
- 2026-05-14 Price Changed $85,000 EBOR
- 2026-03-24 Price Changed $95,000 EBOR
- 2025-06-14 Price Changed $99,000 EBOR
- 2025-06-14 Listed $119,000 EBOR
- 2023-05-31 Sold (MLS) — EBOR
- 2023-01-31 Relisted — EBOR
- 2022-01-20 Listed $119,000 EBOR
Cash-flow waterfall
monthlySold comps — $/sqft
last 12 mo · ≤1 miLoading sold comps…