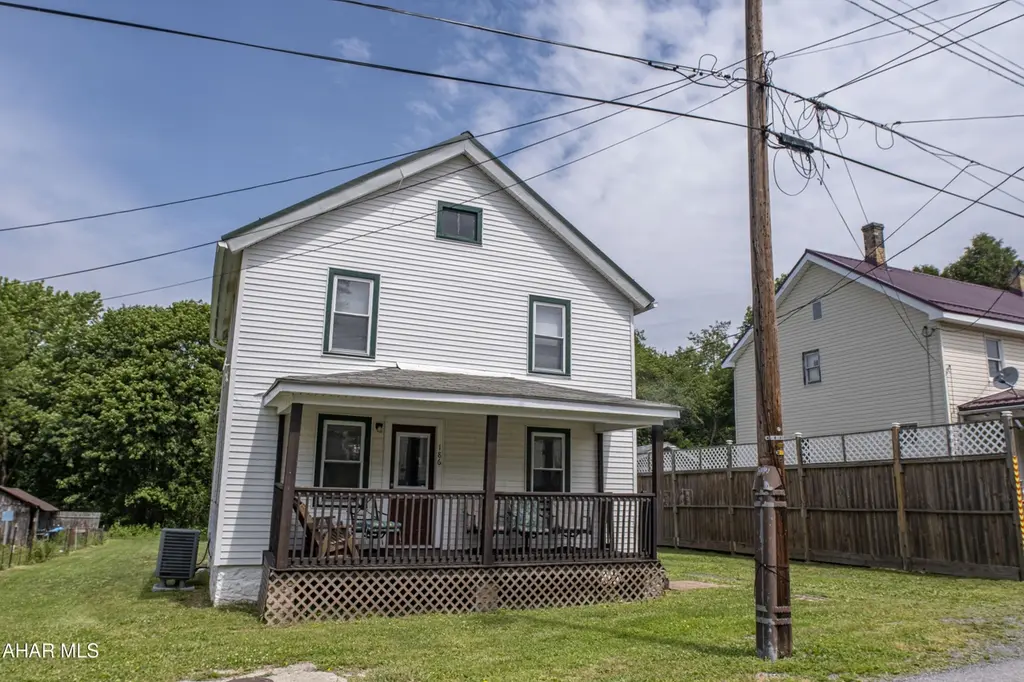
186 Boyd St · Blandburg, PA
Flood risk 1/10 · Minimal
- FEMA flood zone
- X (unshaded)
- Chance of flooding over 30 yrs
- 0.0%
- Est. flood insurance / yr
- $473 – $860
Fire risk 3/10 · Minor
- Est. fire insurance / yr
- $511 – $949
Heat risk 2/10 · Minimal
- Hot days now (above 89°F)
- 7 days/yr
- Hot days in 30 yrs
- 18 days/yr
Wind risk 2/10 · Minimal
- Chance of severe wind over 30 yrs
- —
Air-quality risk 2/10 · Minimal
- Unhealthy air days now
- 1 days/yr
- Unhealthy air days in 30 yrs
- 2 days/yr
Risk factors via First Street. Map © Google.
Why this score? — see what drove the D+ grade
The composite is a weighted blend of 9 inputs, each scored 0–100. Each bar is that input's sub-score; the figure is the points it added to the 100-point composite (weight × sub-score).
- Cash flow +13.7/30.0
- ARV discount +7.5/15.0
- Appreciation +5.0/10.0
- Schools +4.2/10.0
- DSCR +4.1/10.0
- Livability +3.2/5.0
- 1% rule +2.7/10.0
- Rent growth +2.5/5.0
- Condition / age +2.5/5.0
$139,900
🖨 Deal sheet (PDF) 📄 Offer letter ✓ Due diligence
Listing remarks
Beautifully remodeled from top to bottom, this stunning colonial perfectly blends modern elegance with everyday functionality. The main level welcomes you with an expansive, light-filled family room that flows effortlessly into a gorgeous open-concept dining area and kitchen. A chef's dream, the kitchen boasts a large central island, sleek finishes, and warm under-cabinet lighting that sets the perfect ambiance. Upstairs, you will find three comfortable bedrooms, highlighted by a private primary suite complete with its own dedicated full bath and a conveniently integrated laundry area. Outside, the property features a beautifully landscaped, spacious yard and a handy storage shed, offering
Key facts
- Central island
- Storage shed
- Landscaped yard
Tags
Property features AI
Exterior
- Utilities: Public water
- Home design: Single family residence; Two levels
- Construction: Vinyl siding; Shingle roof
- Exterior features: Porch; Shed(s); Cleared, level lot
Interior
- Kitchen: Dishwasher; Microwave; Oven; Refrigerator
- Bedrooms: Total rooms: 8
- Flooring: Laminate; Carpet
- Bathrooms: 2 full bathrooms
- Heating & cooling: Electric heat; Forced air; Heat pump; Ceiling fan(s)
- Interior features: Eat-in kitchen; Basement
- Laundry & utility: Washer; Dryer
Neighborhood map
What this means for you Summary
Snapshot
- This is a 3-bed/2.0-bath single-family listed at $140k.
Deal economics
- At list price, monthly cash flow is $10 ($123/yr) — positive.
- The deal already cash-flows at list — no discount required.
- To meet the 1% rule (rent ≥ 1% of price), the offer needs to be $107k (23.2% below list).
- Recommended offer: $107k (23.2% below list) — sets the bar for 1% rule.
Location & tenants
- Location reads 63/100 on livability (#1,309 in PA) — a middle-class / working-renter tenant base. Strengths: cost of living A+, housing A+; Watch: employment D, amenities F, commute F.
- Glendale SD (rural): math 39% / reading 62% proficiency, ranked #195 of 539 in PA (top 36%) — acceptable for families but not a draw, mixed tenant base, ~2y average lease.
- Zoned schools: Glendale El Sch (math 42% / reading 62%, grade C-, #586 of 1,518 statewide, top 42%, 320 students, 100% FRL); Glendale Jshs (math 37% / reading 62%, grade D, #138 of 437 statewide, top 34%, 340 students, 91% FRL) — zoned schools average 95% FRL vs 44% district-wide (52 pts higher); higher-poverty schools than district average — tighter screening recommended.
- Market conditions: 6 active listings in the ZIP; 64 units permitted in Cambria County in 2024 (0 in 5+ unit buildings).
Forward outlook
- In year one you build about $5k of equity ($967 loan paydown + $4k appreciation (3.0% local appreciation)).
- Cambria County population projected at -28% by 2050 — secular population decline; favor cash flow + early exit over multi-decade hold.
- At projected returns (3.0% appreciation + 3.0% rent growth), your $39k cash investment doubles in ~6 years — after that, you're playing with house money.
- By year 7, paydown + projected appreciation supports a ~$33k cash-out refi (75% LTV) — recoverable capital for the next deal without selling this one.
Negotiation context
- Only 5 days on market — expect competitive offers; lowballing is unlikely to land.
- Current owner paid $30k; list at $140k implies a 366% gain — meaningful room to come down on a strong offer.
Risks & watch-outs
- Watch-outs: built in 1920 — expect roof / HVAC / electrical / plumbing capex.
Questions for the listing agent
- Built in 1920 — when were the roof, HVAC, electrical panel, plumbing, and water heater last replaced?
- Is there a deadline driving the sale (1031 exchange, divorce, estate, relocation)? That informs how much negotiation room exists.
- Schools are D-rated, which usually means shorter tenancies and higher turnover. Who's the typical renter profile here, and what's been the actual vacancy rate?
- The area grade is low — what's the realistic commute time and amenity access for the typical tenant pool here? Any planned neighborhood developments (good or bad) we should know about?
- What's the average days-on-market for RENTAL listings here right now (not sales)? A rising rental-DOM trend means longer vacancies and softer asking-rent achievability than the comps imply.
- What's the recent tenant-quality profile in this submarket — average credit score on applications, eviction rate, late-payment / NSF rate, and stable-employment percentage? A property-management company in the area should have these aggregated.
- How much new for-sale + rental construction is in the pipeline within 1–3 miles? Heavy new supply typically softens prices + rents 12–24 months out; constrained supply supports both.
Investment metrics
- 1% rule
- 0.77% ✗
- Cap rate
- 6.38%
- Cash-on-cash
- 0.32%
- DSCR
- 1.01
- GRM
- 10.9
CMA / ARV
No comps found within radius.
Projected returns pro-forma
3.0% appreciation · 3.0% rent growth · sell at horizon
- IRR
- 7.8%
- Equity multiple
- 1.45×
- Total profit
- $17,445
- Equity at exit
- $62,905
- IRR
- 10.4%
- Equity multiple
- 2.56×
- Total profit
- $61,121
- Equity at exit
- $96,944
Cash invested: $39,172 (down + closing). Projections, not guarantees.
Landlord ↔ Tenant lean methodology
- Overall (STATE)
- 62 Landlord-Friendly
- State Pennsylvania
- 62 Landlord-Friendly · EVEN
- County
- — inherits STATE
- City
- — inherits STATE
ZIP-level market 16619
- Active inventory
- 6
- Price-to-rent
- 10.9×
Monthly cashflow live
- Estimated rent
- $1,074 medium interval (Pro) →
- Mortgage (P&I)
- −$734
- Tax from tax record
- −$46 /mo · $554/yr
- Insurance
- −$58
- HOA
- −$0
- Vacancy / Maint / Mgmt
- −$226
- Net cashflow
- $10
Break-even live
Sensitivity live
| Price | -10% $89 | -5% $50 | +0% $10 | +5% $-29 | +10% $-69 |
|---|---|---|---|---|---|
| Rent | -10% $-75 | -5% $-32 | +0% $10 | +5% $53 | +10% $95 |
| Rate | -1.0pp $81 | -0.5pp $46 | base $10 | +0.5pp $-26 | +1.0pp $-63 |
UW: 25.0% down · 7.5% · 30yr · 1.5% tax · 5.0% vac · 8.0% maint · 8.0% mgmt
Financing live
Cash to close
- Down payment
- $34,975
- Closing costs
- $4,197
- Reserves months
- —
- Total cash needed
- —
Loan-product check · same deal, 3 products live
Conventional
25% down · 7.5% · 30yr
- Down + closing
- —
- Monthly P&I
- —
- Monthly cashflow
- —
- DSCR
- —
- Eligible?
- —
Personal DTI + credit; lowest rate.
DSCR
20% down · 8.5% · 30yr
- Down + closing
- —
- Monthly P&I
- —
- Monthly cashflow
- —
- DSCR
- —
- Eligible?
- —
No personal income docs; deal must DSCR.
Hard money
10% down · 12.0% · 12mo
- Down + closing
- —
- Monthly P&I
- —
- Monthly cashflow
- —
- DSCR
- —
- Eligible?
- —
Short-term bridge; refi at stabilization.
Listing history 4 events
-
2026-06-22days on market $139,900 Active 5 DOM
-
2026-06-19days on market $139,900 Active 2 DOM
-
2026-06-17remarks 699-char remark
-
2026-06-17$139,900 Active 1 DOM
ⓘ Source: listings_history table (triggers on properties + properties_extension) + one-shot
backfill from property_details.listing_events for pre-trigger history.
Tax reassessment forecast PA · Partial reset (capped growth)
- Current annual tax
- $554 · $46/mo
- Projected year-2 tax
- $1,382 · $115/mo
- Expected delta
- +$828/yr (+$69/mo · 149.6%)
ⓘ Screening estimate from a state-policy table — verify with the county assessor before closing.
Climate risk First Street
- Flood 1/10 Low FEMA zone X (unshaded) · 0% chance over 30 yrs
- Wildfire 3/10 Moderate
- Heat 2/10 Low 7 d/yr ≥89°F today · 18 d/yr by 30 yrs out
- Wind 2/10 Low
- Air quality 2/10 Low 1 unhealthy d/yr today · 2 by 30 yrs out
Nearby sold comps map
Loading sold comps map…
Walkable amenities ~0.75 mi
Loading nearby amenities…
Taxation est. · year 1
- Rental income
- $12,887
- − Mortgage interest
- −$7,837
- − Property taxes
- −$554
- − Insurance
- −$700
- − Repairs & maintenance
- −$1,031
- − Management
- −$1,031
- − Depreciation
- −$4,070
- Taxable loss
- −$2,335
- Est. tax savings @ 24.0%
- +$560
- After-tax cash flow
- $684/yr
For passive investors: Depreciation is non-cash, so a rental often shows a tax loss while cash-flowing — sheltering income. Rental losses are passive: they offset passive income freely, and up to $25,000/yr can offset ordinary (W-2) income if you actively participate and your MAGI is under $100k (phasing out to $0 by $150k); unused losses carry forward. On sale, claimed depreciation is recaptured at up to 25%, and gains may owe capital-gains tax (a 1031 exchange can defer both). Figures are a year-1 estimate at your 24.0% rate — not tax advice; consult a CPA.
Schools (NCES district)
- District
- Glendale SD
- NCES district ID
- 4210830
- Math proficiency
- 39% ▼ -9.00%
- Reading proficiency
- 62% ▼ -3.00%
- Median HH income
- $37,869
- Composite
- 41.95/100
- National rank
- #3350
- State rank
- #195 of 539 in PA
Livability — Blandburg
- Score
- 63/100
- State rank
- #1309
- US rank
- #16092
Category grades
Schools grade is shown separately in the Schools card above.
Census & demographics
- Census place
- Blandburg, PA
- City population
- 315
- Population (ZIP)
- 315
Population outlook (Cambria County) Hauer SSP2
- Today (2025)
- 122,754 people
- By 2030
- 115,827 · -5.6%
- By 2040
- 101,309 · -17.5%
- By 2050
- 88,379 · -28.0%
- By 2075
- 65,237 · -46.9%
- By 2100
- 46,909 · -61.8%
Race, ethnicity, and origin ACS 2023
- Neighborhood character
- Predominantly White (89%)
- Race & ethnicity
- White 89% Two or more races 8% Hispanic / Latino 4% Black 3%
- Common ancestry
- Subsaharan African 3% Romanian 2% Polish 1%
- Languages at home
- 99% English-only · Other Indo-European 1%
Political lean MEDSL · Cambria
- 2024 margin
- Solid R (+39.7) · D 29.8% · R 69.5%
- 2008→2024 swing
- -40.4pp toward R · 2008: 0.7pp · 2024: -39.7pp
- All cycles
- 2024: R+39.7 2020: R+37.3 2016: R+37.8 2012: R+17.8 2008: D+0.7
Not yet ingested
- Civics
- —
Market trends
- HPI YoY
- —
- Current HPI
- —
- Rent YoY
- —
- Metro
- —
- State GDP YoY
- ▲ 1.68%
- F500 in state
- 34
Industry mix (Fortune 500 HQ in PA)
| Industry | F500 HQs | Revenue |
|---|---|---|
| Healthcare | 2 | $309B |
|
||
| Insurance | 2 | $27B |
|
||
| Telecommunications / Media | 1 | $124B |
|
||
| Industrial Distribution | 1 | $22B |
|
||
| Financial Services | 1 | $20B |
|
||
| Chemicals / Materials | 1 | $18B |
|
||
Price history
+1898.6% since first listed4 events — show timeline
- 2026-06-17 Listed $139,900 AHARMLS
- 2022-04-01 Price Changed $639 RENT.
- 2003-04-05 Sold (Public Records) $30,000 Public Records
- 1997-07-01 Sold (Public Records) $7,000 Public Records
Property tax history
+26.7%/yrLatest (2026): $554 · +4.3% YoY. Source: county tax records.
Cash-flow waterfall
monthlySold comps — $/sqft
last 12 mo · ≤1 miLoading sold comps…