4804 Creekside Rd · Melissa, TX
Flood risk 1/10 · Minimal
- FEMA flood zone
- X (unshaded)
- Chance of flooding over 30 yrs
- 0.0%
- Est. flood insurance / yr
- $507 – $1,088
Fire risk 5/10 · Moderate
- Est. fire insurance / yr
- $1,222 – $2,270
Heat risk 7/10 · Major
- Hot days now (above 110°F)
- 6 days/yr
- Hot days in 30 yrs
- 19 days/yr
Wind risk 5/10 · Moderate
- Chance of severe wind over 30 yrs
- 26.0%
Air-quality risk 3/10 · Minor
- Unhealthy air days now
- 3 days/yr
- Unhealthy air days in 30 yrs
- 3 days/yr
Risk factors via First Street. Map © Google.
Why this score? — see what drove the F grade
The composite is a weighted blend of 9 inputs, each scored 0–100. Each bar is that input's sub-score; the figure is the points it added to the 100-point composite (weight × sub-score).
- ARV discount +7.5/15.0
- Cash flow +7.2/30.0
- Schools +5.8/10.0
- Livability +3.4/5.0
- Appreciation +2.7/10.0
- Condition / age +2.5/5.0
- Rent growth +2.1/5.0
- DSCR +1.4/10.0
- 1% rule +1.0/10.0
$389,000
🖨 Deal sheet 📄 Offer letter ✓ Due diligence
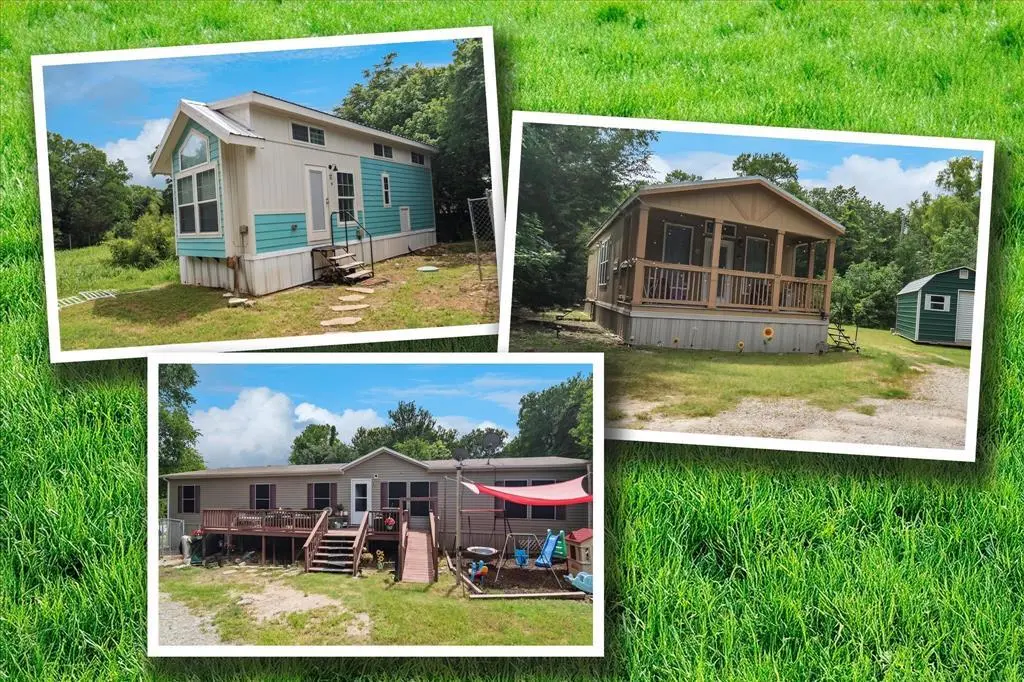
Listing remarks
Three homes are included with this listing, live in one and rent out the other two or rent out all three homes. Main home is 1976 SF, 4 bedrooms, 2 living areas and was built in 2015. Approximate rent, $1,900-$2,100, has fenced back yard, large 8x32 front deck, playground and the refrigerator is included. New water heater 2023, new washer and dryer 2024 also included. Tiny house has 399 sf with one bedroom and large loft upstairs, built in 2018, approximate rent is $1,000-$1,200. No property taxes on home because it has less than 400 SF. Full size refrigerator, washer and dryer included, new hot water heater 2023. Rustic Cabin in back of property, 800 SF built in 2018. Approximate rent
Key facts
- Fenced back yard
- New washer and dryer
- New water heater
Tags
Property features AI
Finance
- Other: Lot approximately 1.3 acres; Will not subdivide; Located at the end of the road in the Creekside subdivision
- Financial info: Treat as clear loan type; No second mortgage
- HOA & community: No association
Exterior
- Parking: Aggregate parking surface
- Security: Smoke detector(s)
- Utilities: Aerobic septic; Co-op water; Electricity connected
- Home design: Manufactured home; One story; Accessory unit on site; Residential property
- Construction: Built in 2015; Metal siding; Composition roof
- Exterior features: Chain link fencing; Gravel/rock on property
Interior
- Kitchen: Dishwasher; Disposal; Electric range
- Bedrooms: 4 bedrooms, all on the main level
- Flooring: Carpet; Tile
- Bathrooms: 2 full bathrooms
- Heating & cooling: Central heating (electric); Central air; Ceiling fan(s)
- Interior features: Open floorplan; Kitchen island; Walk-in closet(s)
- Laundry & utility: 1 utility/living area
Neighborhood map
What this means for you Summary
Snapshot
- This is a 4-bed/2.0-bath land listed at $389k.
Deal economics
- At list price, monthly cash flow is $-539 ($-6k/yr) — negative.
- To cash-flow at today's rent, offer at most $294k (24.5% below list).
- To meet the 1% rule (rent ≥ 1% of price), the offer needs to be $234k (39.8% below list).
- Recommended offer: $234k (39.8% below list) — sets the bar for 1% rule.
- Cap rate 4.6% vs local median 2.8% in Melissa — top-decile yield for the area; either an underpriced asset or a hidden risk that comps aren't pricing in. Stress-test before assuming the spread holds.
Location & tenants
- Location reads 68/100 on livability (#477 in TX) — a middle-class / working-renter tenant base. Strengths: crime A+, employment A+, housing A+; Watch: cost of living D, amenities F, commute F.
- Melissa ISD (suburban): math 65% / reading 65% proficiency, ranked #24 of 826 in TX (top 3%) — acceptable for families but not a draw, mixed tenant base, ~2y average lease.
- Zoned schools: Willow Wood El (930 students, 20% FRL) — zoned schools at 20% FRL track the district average.
- Market conditions: Rents soft (-1.4%/yr); 503 active listings in the ZIP; 22 comparable units currently listed for rent nearby; rentals at typical pace (median 22d on market — plan ~3-4 weeks tenant-placement turnaround); high-income renter base; 19,194 units permitted in Collin County in 2024 (3,988 in 5+ unit buildings).
Forward outlook
- Local home prices are declining (-3.0%/yr); year-one equity from $3k of loan paydown is wiped out by about $12k of value loss. Plan a longer hold.
- Collin County population projected at +60% by 2050 — long-run rental-demand tailwind backs the buy-and-hold thesis.
Negotiation context
- It's been on market 33 days — a 3% lower offer ($377k) is reasonable based on typical stale-listing flexibility.
- 2 sale attempts with the ask held roughly flat each time — persistent listings suggest the price (not the market) is what's stuck; bring a comps-based counter.
Risks & watch-outs
- Climate carrying-cost: moderate wind risk, 26% chance of damaging wind over 30y; moderate wildfire risk; extreme-heat days projected 6→19/yr by 2055 (HVAC capex compounding) — expect insurance premiums to compound above CPI over the hold.
Questions for the listing agent
- What do current leases actually rent for vs. the listed asking? Can we see a recent rent roll and the last 12 months of T-12 income?
- It's been on market 33 days. Have you received any prior offers? Is the seller open to a 40% concession, seller financing, or rate buy-down credit?
- Is there a deadline driving the sale (1031 exchange, divorce, estate, relocation)? That informs how much negotiation room exists.
- Schools are A-rated — typically a magnet for longer-tenancy family renters. What's the average tenant stay here, and is there a school-zone premium baked into asking?
- The area grade is low — what's the realistic commute time and amenity access for the typical tenant pool here? Any planned neighborhood developments (good or bad) we should know about?
- What's the average days-on-market for RENTAL listings here right now (not sales)? A rising rental-DOM trend means longer vacancies and softer asking-rent achievability than the comps imply.
- What's the recent tenant-quality profile in this submarket — average credit score on applications, eviction rate, late-payment / NSF rate, and stable-employment percentage? A property-management company in the area should have these aggregated.
- How much new for-sale + rental construction is in the pipeline within 1–3 miles? Heavy new supply typically softens prices + rents 12–24 months out; constrained supply supports both.
Investment metrics
- 1% rule
- 0.60% ✗
- Cap rate
- 4.63%
- Cash-on-cash
- -5.94%
- DSCR
- 0.74
- GRM
- 13.8
CMA / ARV
No comps found within radius.
Projected returns pro-forma
-3.0% appreciation · 0.0% rent growth · sell at horizon
- IRR
- -29.5%
- Equity multiple
- 0.04×
- Total profit
- $-104,404
- Equity at exit
- $58,001
- IRR
- -45.5%
- Equity multiple
- -0.49×
- Total profit
- $-162,282
- Equity at exit
- $33,634
Cash invested: $108,920 (down + closing). Projections, not guarantees.
Landlord ↔ Tenant lean methodology
- Overall (STATE)
- 87 Strongly Landlord-Friendly
- State Texas
- 87 Strongly Landlord-Friendly · R+5
- County
- — inherits STATE
- City
- — inherits STATE
ZIP-level market 75454
- Home prices YoY
- -1.9%
- Rents YoY
- -1.4%
- Active inventory
- 503
- Price-to-rent
- 13.8×
Monthly cashflow live
- Estimated rent
- $2,342 high interval (Pro) →
- Mortgage (P&I)
- −$2,040
- Tax from tax record
- −$188 /mo · $2,254/yr
- Insurance
- −$162
- HOA
- −$0
- Vacancy / Maint / Mgmt
- −$492
- Net cashflow
- $-539
Break-even live
UW: 25.0% down · 7.5% · 30yr · 1.5% tax · 5.0% vac · 8.0% maint · 8.0% mgmt
Financing live
Cash to close
- Down payment
- $97,250
- Closing costs
- $11,670
- Reserves months
- —
- Total cash needed
- —
Loan-product check · same deal, 3 products live
Conventional
25% down · 7.5% · 30yr
- Down + closing
- —
- Monthly P&I
- —
- Monthly cashflow
- —
- DSCR
- —
- Eligible?
- —
Personal DTI + credit; lowest rate.
DSCR
20% down · 8.5% · 30yr
- Down + closing
- —
- Monthly P&I
- —
- Monthly cashflow
- —
- DSCR
- —
- Eligible?
- —
No personal income docs; deal must DSCR.
Hard money
10% down · 12.0% · 12mo
- Down + closing
- —
- Monthly P&I
- —
- Monthly cashflow
- —
- DSCR
- —
- Eligible?
- —
Short-term bridge; refi at stabilization.
Rent comps 22 comps
| Address | Beds | Baths | Sqft | Rent | $/sqft | DOM | Units | Dist |
|---|---|---|---|---|---|---|---|---|
| 2201 River Trl Melissa, TX | 4.0 | 2.5 | 2129 | $2,800 | $1.32 | 43d | 1 | 0.76mi |
| 300 Willow Grove Way Melissa, TX | 1.0–3.0 | 1.0–2.0 | 1069 | $1,950 | $1.82 | 3d | 8 | 0.82mi |
| 315 Willow Grove Way Unit 3103 Melissa, TX | 3.0 | 2.0 | 1312 | $1,875 | $1.43 | 43d | 1 | 0.83mi |
| 315 Willow Grove Way Unit 3303 Melissa, TX | 3.0 | 2.0 | 1312 | $1,645 | $1.25 | 12d | 1 | 0.83mi |
| 508 Fisherman Trl Melissa, TX | 3.0 | 2.0 | 1797 | $2,050 | $1.14 | 43d | 1 | 0.90mi |
| 1824 Central Expy Melissa, TX | 3.0 | 2.0 | 1312 | $1,645 | $1.25 | 24d | 1 | 0.90mi |
| 1824 Central Expy Unit 813 Melissa, TX | 3.0 | 2.0 | 1312 | $1,645 | $1.25 | 7d | 1 | 0.90mi |
| 504 Teal Ln Melissa, TX | 4.0 | 2.0 | 1798 | $2,100 | $1.17 | 10d | 1 | 0.99mi |
| 365 Basswood Ln Melissa, TX | 3.0 | 2.0 | 1792 | $1,795 | $1.00 | 16d | 1 | 1.01mi |
| 380 Elk Trl Melissa, TX | 4.0 | 2.0 | 1798 | $1,950 | $1.08 | 43d | 1 | 1.06mi |
| 1800 Canyon Ln Melissa, TX | 3.0 | 2.5 | 2478 | $2,600 | $1.05 | 43d | 1 | 1.16mi |
| 2304 Pheasant Run Melissa, TX | 3.0 | 2.0 | 1872 | $2,150 | $1.15 | 12d | 1 | 1.16mi |
| 2305 Pheasant Run Melissa, TX | 3.0 | 2.0 | 1872 | $2,000 | $1.07 | 20d | 1 | 1.17mi |
| 2504 Quail Ridge Rd Melissa, TX | 4.0 | 2.5 | 2099 | $2,100 | $1.00 | 21d | 1 | 1.18mi |
| 1106 Ellis Rd Melissa, TX | 3.0 | 2.0 | 1873 | $2,150 | $1.15 | 21d | 1 | 1.43mi |
| 308 Crescent Ave Melissa, TX | 4.0 | 2.0 | 2423 | $2,995 | $1.24 | 24d | 1 | 1.45mi |
| 5412 Troupe Rd McKinney, TX | 3.0 | 2.0 | 1743 | $2,300 | $1.32 | 21d | 1 | 1.46mi |
| 1908 Iris Rd Melissa, TX | 5.0 | 3.0 | 2467 | $2,495 | $1.01 | 24d | 1 | 1.47mi |
| 311 Lexington Ave Melissa, TX | 3.0 | 2.0 | 1937 | $2,295 | $1.18 | 5d | 1 | 1.47mi |
| 313 Crescent Ave Melissa, TX | 4.0 | 3.0 | 2340 | $2,700 | $1.15 | 43d | 1 | 1.49mi |
| 3105 Bedstraw Ln Melissa, TX | 5.0 | 3.0 | 2327 | $2,700 | $1.16 | 18d | 1 | 1.49mi |
| 1113 Haskell Dr Melissa, TX | 3.0 | 2.0 | 1873 | $2,200 | $1.17 | 5d | 1 | 1.49mi |
Listing history 22 events
-
2026-06-18days on market $389,000 Active 33 DOM
-
2026-06-17days on market $389,000 Active 32 DOM
-
2026-06-16days on market $389,000 Active 31 DOM
-
2026-06-15days on market $389,000 Active 30 DOM
-
2026-06-13days on market $389,000 Active 28 DOM
-
2026-06-13days on market $389,000 Active 27 DOM
-
2026-06-09days on market $389,000 Active 24 DOM
-
2026-06-08days on market $389,000 Active 23 DOM
-
2026-06-07days on market $389,000 Active 22 DOM
-
2026-06-04days on market $389,000 Active 19 DOM
-
2026-06-03days on market $389,000 Active 18 DOM
-
2026-06-02days on market $389,000 Active 17 DOM
-
2026-06-01days on market $389,000 Active 16 DOM
-
2026-05-31days on market $389,000 Active 15 DOM
-
2026-05-16$389,000 Active
-
2026-04-14historical
-
2026-03-28price $399,000
-
2025-11-16price $415,500
-
2025-09-11price $424,900
-
2025-07-26price $439,000
-
2025-06-21price $459,000
-
2025-05-24$479,000 Active
ⓘ Source: listings_history table (triggers on properties + properties_extension) + one-shot
backfill from property_details.listing_events for pre-trigger history.
Tax reassessment forecast TX · Resets to sale price
- Current annual tax
- $2,254 · $188/mo
- Projected year-2 tax
- $7,119 · $593/mo
- Expected delta
- +$4,865/yr (+$405/mo · 215.9%)
ⓘ Screening estimate from a state-policy table — verify with the county assessor before closing.
Climate risk First Street
- Flood 1/10 Low FEMA zone X (unshaded) · 0% chance over 30 yrs
- Wildfire 5/10 Major
- Heat 7/10 Severe 6 d/yr ≥110°F today · 19 d/yr by 30 yrs out
- Wind 5/10 Major 26% chance of damaging wind over 30 yrs
- Air quality 3/10 Moderate 3 unhealthy d/yr today · 3 by 30 yrs out
Nearby sold comps map
Loading sold comps map…
Walkable amenities ~0.75 mi
Loading nearby amenities…
Taxation est. · year 1
- Rental income
- $28,108
- − Mortgage interest
- −$21,790
- − Property taxes
- −$2,254
- − Insurance
- −$1,945
- − Repairs & maintenance
- −$2,249
- − Management
- −$2,249
- − Depreciation
- −$11,316
- Taxable loss
- −$13,695
- Est. tax savings @ 24.0%
- +$3,287
- After-tax cash flow
- $-3,186/yr
For passive investors: Depreciation is non-cash, so a rental often shows a tax loss while cash-flowing — sheltering income. Rental losses are passive: they offset passive income freely, and up to $25,000/yr can offset ordinary (W-2) income if you actively participate and your MAGI is under $100k (phasing out to $0 by $150k); unused losses carry forward. On sale, claimed depreciation is recaptured at up to 25%, and gains may owe capital-gains tax (a 1031 exchange can defer both). Figures are a year-1 estimate at your 24.0% rate — not tax advice; consult a CPA.
Schools (NCES district)
- District
- Melissa ISD
- NCES district ID
- 4830120
- Math proficiency
- 65% ▼ -8.00%
- Reading proficiency
- 65% ▼ -2.00%
- Median HH income
- $82,500
- Composite
- 58.34/100
- National rank
- #1012
- State rank
- #24 of 826 in TX
Livability — Melissa
- Score
- 68/100
- State rank
- #477
- US rank
- #9595
Category grades
Schools grade is shown separately in the Schools card above.
Census & demographics
- County
- Collin County · 1,159,394 people
- City population
- 22,990
- Metro
- Dallas-Fort Worth-Arlington, TX
- Population (ZIP)
- 22,990
- Household income
- $138,827
- Rent vs Own
- Severe rent burden
- 246.0
Population outlook (Collin County) Hauer SSP2
- Today (2025)
- 1,210,074 people
- By 2030
- 1,358,201 · +12.2%
- By 2040
- 1,654,061 · +36.7%
- By 2050
- 1,937,359 · +60.1%
- By 2075
- 2,567,039 · +112.1%
- By 2100
- 2,952,048 · +144.0%
Race, ethnicity, and origin ACS 2023
- Neighborhood character
- Diverse neighborhood (Simpson 0.60)
- Race & ethnicity
- White 59% Hispanic / Latino 16% Black 15% Two or more races 10% Asian 6%
- Hispanic origin (detail)
- Mexican 11%
- Common ancestry
- Italian 4% Slovak 3% Romanian 3%
- Foreign-born
- 13% · Canada, China
- Languages at home
- 78% English-only · Spanish 12% Other Indo-European 2% Other Asian/Pacific 2%
Political lean MEDSL · Collin
- 2024 margin
- R (+11.1) · D 43.1% · R 54.3% · Other 2.6%
- 2008→2024 swing
- +14.4pp toward D · 2008: -25.6pp · 2024: -11.1pp
- All cycles
- 2024: R+11.1 2020: R+4.3 2016: R+17.0 2012: R+31.6 2008: R+25.6
Not yet ingested
- Civics
- —
Market trends
- HPI YoY
- ▼ -4.66%
- Current HPI
- 235.2508
- Rent YoY
- ▼ -1.42%
- Metro
- Dallas-Fort Worth-Arlington, TX
- State GDP YoY
- ▲ 3.95%
- F500 in state
- 110
Industry mix (Fortune 500 HQ in TX)
| Industry | F500 HQs | Revenue |
|---|---|---|
| Energy | 16 | $1,198B |
|
||
| Technology | 5 | $198B |
|
||
| Engineering / Construction | 4 | $72B |
|
||
| Energy Services | 3 | $60B |
|
||
| Utilities | 3 | $41B |
|
||
| Healthcare | 2 | $330B |
|
||
Price history
-18.8% since first listed8 events — show timeline
- 2026-05-16 Listed $389,000 NTREIS
- 2026-04-14 Listing Removed — NTREIS
- 2026-03-28 Price Changed $399,000 NTREIS
- 2025-11-16 Price Changed $415,500 NTREIS
- 2025-09-11 Price Changed $424,900 NTREIS
- 2025-07-26 Price Changed $439,000 NTREIS
- 2025-06-21 Price Changed $459,000 NTREIS
- 2025-05-24 Listed $479,000 NTREIS
Property tax history
+3.4%/yrLatest (2025): $2,254 · +16.4% YoY. Source: county tax records.
Cash-flow waterfall
monthlySold comps — $/sqft
last 12 mo · ≤1 miLoading sold comps…