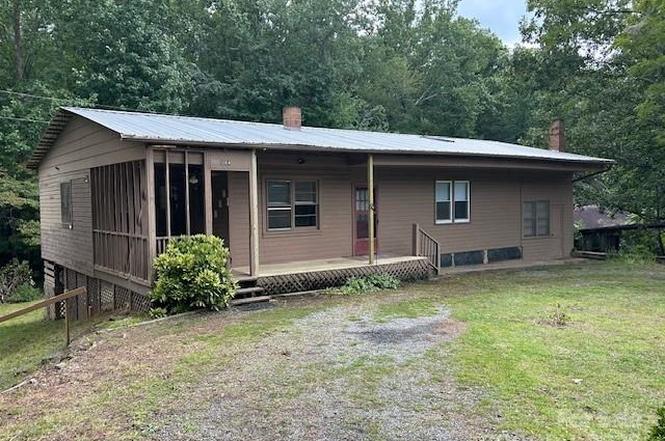
584 Groves Rd · Rutherfordton, NC
Flood risk 8/10 · Major
- FEMA flood zone
- X (unshaded)
- Chance of flooding over 30 yrs
- 0.99%
- Est. flood insurance / yr
- $507 – $1,088
Fire risk 4/10 · Minor
- Est. fire insurance / yr
- $906 – $1,684
Heat risk 5/10 · Moderate
- Hot days now (above 105°F)
- 7 days/yr
- Hot days in 30 yrs
- 17 days/yr
Wind risk 2/10 · Minimal
- Chance of severe wind over 30 yrs
- —
Air-quality risk 3/10 · Minor
- Unhealthy air days now
- 3 days/yr
- Unhealthy air days in 30 yrs
- 3 days/yr
Risk factors via First Street. Map © Google.
Why this score? — see what drove the D+ grade
The composite is a weighted blend of 9 inputs, each scored 0–100. Each bar is that input's sub-score; the figure is the points it added to the 100-point composite (weight × sub-score).
- Cash flow +10.8/30.0
- Appreciation +10.0/10.0
- ARV discount +7.5/15.0
- Livability +3.7/5.0
- Schools +3.6/10.0
- DSCR +3.1/10.0
- Rent growth +2.5/5.0
- Condition / age +2.5/5.0
- 1% rule +2.1/10.0
$172,000
🖨 Deal sheet 📄 Offer letter ✓ Due diligence
Listing remarks
Great rural property in Union Mills! This longstanding 3 bed 2 bath homestead is waiting to be reimagined! The home needs some updating but is move in ready. The 1.4 acres backs up to a beautiful, quick running stream. 10 minutes from restaurants and grocery in Rutherfordton, 15 minutes from Forest City, and 1 hour each from Charlotte, Asheville and Greenville. A great property with great potential!
Key facts
- 1.4 acres
- Quick running stream
- 1.41 acre lot
Tags
Property features AI
Finance
- HOA & community: No HOA
Exterior
- Parking: Detached carport; Circular driveway
- Security: Smoke detector(s)
- Utilities: Electricity connected; Septic system installed; Water: Other (see remarks)
- Home design: Single-family residence; Site-built construction; One story; Entry level: Main; Zoned residential
- Construction: Wood construction; Metal roof; Crawl space foundation with pillar/post/pier
- Exterior features: Front porch; Patio; Fire pit; Storage; Outbuilding / shed(s); Creek/stream frontage; Cleared and wooded areas; Sloped terrain; Publicly maintained road access; Gravel and paved road surfaces
Interior
- Kitchen: No appliances listed
- Bedrooms: 3 bedrooms on the main level
- Flooring: Laminate; Tile; Vinyl; Wood
- Bathrooms: 2 full bathrooms on the main level
- Heating & cooling: Floor furnace (natural gas); No cooling system
- Interior features: Ceiling fan(s); Insulated windows; Skylight(s); Window treatments; Smoke detector(s)
- Laundry & utility: Washer hookup; Gas dryer hookup; Mud room; Utility room; Laundry located inside on the main level
Neighborhood map
What this means for you Summary
Snapshot
- This is a 3-bed/1.5-bath single-family listed at $172k.
Deal economics
- At list price, monthly cash flow is $-145 ($-2k/yr) — negative.
- To cash-flow at today's rent, offer at most $146k (14.9% below list).
- To meet the 1% rule (rent ≥ 1% of price), the offer needs to be $122k (29.3% below list).
- Recommended offer: $122k (29.3% below list) — sets the bar for 1% rule.
- Cap rate 5.7% vs local median 3.0% in Rutherfordton — top-decile yield for the area; either an underpriced asset or a hidden risk that comps aren't pricing in. Stress-test before assuming the spread holds.
Location & tenants
- Location reads 73/100 on livability (#67 in NC) — a middle-class / working-renter tenant base. Strengths: cost of living A+, housing A+, health & safety A+; Watch: schools D, crime D, amenities F.
- Rutherford County Schools (rural): math 43% / reading 44% proficiency, ranked #98 of 178 in NC (top 55%) — families likely to look elsewhere, expect single-tenant / working-renter base with shorter leases; 60% free/reduced lunch — lower-income household profile, screen leases tightly.
- Market conditions: 80 active listings in the ZIP; 193 units permitted in Rutherford County in 2024 (0 in 5+ unit buildings).
Forward outlook
- In year one you build about $18k of equity ($1k loan paydown + $17k appreciation (10.0% local appreciation)).
- Rutherford County population projected at -17% by 2050 — secular population decline; favor cash flow + early exit over multi-decade hold.
- By year 3, paydown + projected appreciation supports a ~$47k cash-out refi (75% LTV) — recoverable capital for the next deal without selling this one.
Negotiation context
- It's been on market 315 days — a 12% lower offer ($151k) is reasonable based on typical stale-listing flexibility.
- 3 sale attempts with the ask held roughly flat each time — persistent listings suggest the price (not the market) is what's stuck; bring a comps-based counter.
Risks & watch-outs
- Watch-outs: flood insurance adds $66/mo.
- Climate carrying-cost: severe flood risk; extreme-heat days projected 7→17/yr by 2055 (HVAC capex compounding) — expect insurance premiums to compound above CPI over the hold.
Questions for the listing agent
- What do current leases actually rent for vs. the listed asking? Can we see a recent rent roll and the last 12 months of T-12 income?
- It's been on market 315 days. Have you received any prior offers? Is the seller open to a 29% concession, seller financing, or rate buy-down credit?
- Built in 1960 — when were the roof, HVAC, electrical panel, plumbing, and water heater last replaced?
- What's the actual annual flood-insurance premium (NFIP or private), and is the property in a SFHA with mandatory coverage?
- Why hasn't it sold? Are there any deal-killer items the seller is aware of (foundation, flood, title, zoning, code violations)?
- Is there a deadline driving the sale (1031 exchange, divorce, estate, relocation)? That informs how much negotiation room exists.
- Schools are D-rated, which usually means shorter tenancies and higher turnover. Who's the typical renter profile here, and what's been the actual vacancy rate?
- Crime grade is D in this area — have there been break-ins, vandalism, or insurance claims at this property in the last 3 years? What carrier currently insures it and at what premium?
- The area grade is low — what's the realistic commute time and amenity access for the typical tenant pool here? Any planned neighborhood developments (good or bad) we should know about?
- What's the average days-on-market for RENTAL listings here right now (not sales)? A rising rental-DOM trend means longer vacancies and softer asking-rent achievability than the comps imply.
- What's the recent tenant-quality profile in this submarket — average credit score on applications, eviction rate, late-payment / NSF rate, and stable-employment percentage? A property-management company in the area should have these aggregated.
- How much new for-sale + rental construction is in the pipeline within 1–3 miles? Heavy new supply typically softens prices + rents 12–24 months out; constrained supply supports both.
Investment metrics
- 1% rule
- 0.71% ✗
- Cap rate
- 5.75%
- Cash-on-cash
- -1.95%
- DSCR
- 0.91
- GRM
- 11.8
CMA / ARV
No comps found within radius.
Projected returns pro-forma
10.0% appreciation · 3.0% rent growth · sell at horizon
- IRR
- 21.7%
- Equity multiple
- 2.75×
- Total profit
- $84,423
- Equity at exit
- $154,951
- IRR
- 19.6%
- Equity multiple
- 6.31×
- Total profit
- $255,798
- Equity at exit
- $334,158
Cash invested: $48,160 (down + closing). Projections, not guarantees.
Landlord ↔ Tenant lean methodology
- Overall (STATE)
- 85 Strongly Landlord-Friendly
- State North Carolina
- 85 Strongly Landlord-Friendly · R+3
- County
- — inherits STATE
- City
- — inherits STATE
ZIP-level market 28167
- Home prices YoY
- 12.2%
- Active inventory
- 80
- Price-to-rent
- 11.8×
Monthly cashflow live
- Estimated rent
- $1,217 medium interval (Pro) →
- Mortgage (P&I)
- −$902
- Tax from tax record
- −$66 /mo · $789/yr
- Insurance
- −$72
- Flood insurance flood zone
- −$66 /mo · $798/yr
- HOA
- −$0
- Vacancy / Maint / Mgmt
- −$255
- Net cashflow
- $-145
Break-even live
UW: 25.0% down · 7.5% · 30yr · 1.5% tax · 5.0% vac · 8.0% maint · 8.0% mgmt
Financing live
Cash to close
- Down payment
- $43,000
- Closing costs
- $5,160
- Reserves months
- —
- Total cash needed
- —
Loan-product check · same deal, 3 products live
Conventional
25% down · 7.5% · 30yr
- Down + closing
- —
- Monthly P&I
- —
- Monthly cashflow
- —
- DSCR
- —
- Eligible?
- —
Personal DTI + credit; lowest rate.
DSCR
20% down · 8.5% · 30yr
- Down + closing
- —
- Monthly P&I
- —
- Monthly cashflow
- —
- DSCR
- —
- Eligible?
- —
No personal income docs; deal must DSCR.
Hard money
10% down · 12.0% · 12mo
- Down + closing
- —
- Monthly P&I
- —
- Monthly cashflow
- —
- DSCR
- —
- Eligible?
- —
Short-term bridge; refi at stabilization.
Listing history 21 events
-
2026-06-19days on market $172,000 Active 315 DOM
-
2026-06-18days on market $172,000 Active 314 DOM
-
2026-06-17days on market $172,000 Active 313 DOM
-
2026-06-16days on market $172,000 Active 312 DOM
-
2026-06-15days on market $172,000 Active 311 DOM
-
2026-06-14days on market $172,000 Active 309 DOM
-
2026-06-13days on market $172,000 Active 308 DOM
-
2026-06-10days on market $172,000 Active 306 DOM
-
2026-06-09days on market $172,000 Active 305 DOM
-
2026-06-08days on market $172,000 Active 304 DOM
-
2026-06-07days on market $172,000 Active 303 DOM
-
2026-06-02days on market $172,000 Active 298 DOM
-
2026-06-01days on market $172,000 Active 297 DOM
-
2026-05-31days on market $172,000 Active 296 DOM
-
2026-05-30days on market $172,000 Active 295 DOM
-
2026-04-20price $172,000
-
2025-11-10status Active
-
2025-10-30historical Active Under Contract
-
2025-10-12status Active
-
2025-09-02historical Active Under Contract
-
2025-08-08$174,900 Active
ⓘ Source: listings_history table (triggers on properties + properties_extension) + one-shot
backfill from property_details.listing_events for pre-trigger history.
Tax reassessment forecast NC · Resets to sale price
- Current annual tax
- $789 · $66/mo
- Projected year-2 tax
- $1,410 · $118/mo
- Expected delta
- +$621/yr (+$52/mo · 78.8%)
ⓘ Screening estimate from a state-policy table — verify with the county assessor before closing.
Climate risk First Street
- Flood 8/10 Severe FEMA zone X (unshaded) · 99% chance over 30 yrs
- Wildfire 4/10 Moderate
- Heat 5/10 Major 7 d/yr ≥105°F today · 17 d/yr by 30 yrs out
- Wind 2/10 Low
- Air quality 3/10 Moderate 3 unhealthy d/yr today · 3 by 30 yrs out
Nearby sold comps map
Loading sold comps map…
Walkable amenities ~0.75 mi
Loading nearby amenities…
Taxation est. · year 1
- Rental income
- $14,599
- − Mortgage interest
- −$9,635
- − Property taxes
- −$789
- − Insurance
- −$1,658
- − Repairs & maintenance
- −$1,168
- − Management
- −$1,168
- − Depreciation
- −$5,004
- Taxable loss
- −$4,822
- Est. tax savings @ 24.0%
- +$1,157
- After-tax cash flow
- $-580/yr
For passive investors: Depreciation is non-cash, so a rental often shows a tax loss while cash-flowing — sheltering income. Rental losses are passive: they offset passive income freely, and up to $25,000/yr can offset ordinary (W-2) income if you actively participate and your MAGI is under $100k (phasing out to $0 by $150k); unused losses carry forward. On sale, claimed depreciation is recaptured at up to 25%, and gains may owe capital-gains tax (a 1031 exchange can defer both). Figures are a year-1 estimate at your 24.0% rate — not tax advice; consult a CPA.
Schools (NCES district)
- District
- Rutherford County Schools
- NCES district ID
- 3704080
- Math proficiency
- 43% ▼ -1.00%
- Reading proficiency
- 44% ▼ -2.00%
- Median HH income
- $36,490
- Composite
- 36.11/100
- National rank
- #4753
- State rank
- #98 of 178 in NC
Livability — Rutherfordton
- Score
- 73/100
- State rank
- #67
- US rank
- #5114
Category grades
Schools grade is shown separately in the Schools card above.
Census & demographics
- Population (ZIP)
- 2,217
Population outlook (Rutherford County) Hauer SSP2
- Today (2025)
- 63,695 people
- By 2030
- 61,670 · -3.2%
- By 2040
- 57,212 · -10.2%
- By 2050
- 52,763 · -17.2%
- By 2075
- 44,493 · -30.1%
- By 2100
- 38,127 · -40.1%
Race, ethnicity, and origin ACS 2023
- Neighborhood character
- Predominantly White (94%)
- Race & ethnicity
- White 94% Black 3% Asian 2%
- Common ancestry
- Slovak 15% Iranian 1% Romanian 1%
- Foreign-born
- 2% · South Korea
- Languages at home
- 99% English-only · Korean 1% Spanish 1%
Political lean MEDSL · Rutherford
- 2024 margin
- Solid R (+47.8) · D 25.8% · R 73.6%
- 2008→2024 swing
- -16.0pp toward R · 2008: -31.8pp · 2024: -47.8pp
- All cycles
- 2024: R+47.8 2020: R+45.8 2016: R+47.9 2012: R+33.5 2008: R+31.8
Not yet ingested
- Civics
- —
Market trends
- HPI YoY
- ▲ 31.26%
- Current HPI
- 288.0867
- Rent YoY
- —
- Metro
- —
- State GDP YoY
- ▲ 3.28%
- F500 in state
- 26
Industry mix (Fortune 500 HQ in NC)
| Industry | F500 HQs | Revenue |
|---|---|---|
| Financial Services | 2 | $213B |
|
||
| Retail | 2 | $95B |
|
||
| Industrial Conglomerate | 1 | $38B |
|
||
| Metals / Steel | 1 | $35B |
|
||
| Utilities | 1 | $30B |
|
||
| Industrial Machinery | 1 | $19B |
|
||
Price history
-1.7% since first listed6 events — show timeline
- 2026-04-20 Price Changed $172,000 CANOPYMLS as Distributed by MLS Grid
- 2025-11-10 Relisted — CANOPYMLS as Distributed by MLS Grid
- 2025-10-30 Contingent — CANOPYMLS as Distributed by MLS Grid
- 2025-10-12 Relisted — CANOPYMLS as Distributed by MLS Grid
- 2025-09-02 Contingent — CANOPYMLS as Distributed by MLS Grid
- 2025-08-08 Listed $174,900 CANOPYMLS as Distributed by MLS Grid
Property tax history
+20.9%/yrLatest (2025): $789 · +8.5% YoY. Source: county tax records.
Cash-flow waterfall
monthlySold comps — $/sqft
last 12 mo · ≤1 miLoading sold comps…