422 Leaning Oak Ln · Lyons, TX
Flood risk 1/10 · Minimal
- FEMA flood zone
- X (unshaded)
- Chance of flooding over 30 yrs
- 0.0%
- Est. flood insurance / yr
- $507 – $1,088
Fire risk 4/10 · Minor
- Est. fire insurance / yr
- $1,222 – $2,270
Heat risk 8/10 · Major
- Hot days now (above 110°F)
- 7 days/yr
- Hot days in 30 yrs
- 24 days/yr
Wind risk 8/10 · Major
- Chance of severe wind over 30 yrs
- 98.0%
Air-quality risk 1/10 · Minimal
- Unhealthy air days now
- 0 days/yr
- Unhealthy air days in 30 yrs
- 0 days/yr
Risk factors via First Street. Map © Google.
Why this score? — see what drove the B grade
The composite is a weighted blend of 9 inputs, each scored 0–100. Each bar is that input's sub-score; the figure is the points it added to the 100-point composite (weight × sub-score).
- Cash flow +30.0/30.0
- DSCR +10.0/10.0
- 1% rule +9.1/10.0
- ARV discount +7.5/15.0
- Appreciation +5.6/10.0
- Schools +2.8/10.0
- Rent growth +2.5/5.0
- Livability +2.5/5.0
- Condition / age +2.5/5.0
$90,000
🖨 Deal sheet 📄 Offer letter ✓ Due diligence
Listing remarks MLS
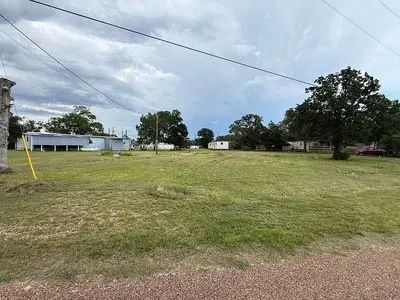
Opportunity to own in one of the most desired subdivisions by the lake. Older 3 bed/2 bath mobile home on three contiguous lots for . 37 acre with all utilities. In addition to the home, the property has a 18X20 carport, 12X16 storage shed and the septic was pumped in April of 2022. Whether it's fixing up the current home or pulling it out for something new, one thing won't change and that is - LOCATION! Birch Creek Forest is just moments away from the Birch Creek State Park. Subdivision amenities include: paved roads, streetlights, boat ramp, community swimming pool, trash site, Helipad and VFD. WOW!
Key facts
- Water
- Vacant lots
- Septic
Tags
Neighborhood map
What this means for you Summary
Snapshot
- This is a 3-bed/?-bath manufactured listed at $90k.
Deal economics
- At list price, monthly cash flow is $404 ($5k/yr) — positive.
- The deal already cash-flows at list — no discount required.
- Meets the 1% rule at list price ($1k rent vs $90k).
- Cap rate 11.7% vs local median 3.9% in Lyons — top-decile yield for the area; either an underpriced asset or a hidden risk that comps aren't pricing in. Stress-test before assuming the spread holds.
Location & tenants
- Location reads: area grade B — affects rentability + tenant quality, not the cash-flow math above.
- Somerville ISD (rural): math 36% / reading 29% proficiency, ranked #579 of 826 in TX (top 70%) — families likely to look elsewhere, expect single-tenant / working-renter base with shorter leases; 61% free/reduced lunch — lower-income household profile, screen leases tightly.
- Market conditions: 221 active listings in the ZIP; 44 units permitted in Burleson County in 2024 (0 in 5+ unit buildings).
Forward outlook
- In year one you build about $2k of equity ($622 loan paydown + $1k appreciation (1.2% local appreciation)).
- At projected returns (1.2% appreciation + 3.0% rent growth), your $25k cash investment doubles in ~4 years — after that, you're playing with house money.
Negotiation context
- Only 6 days on market — expect competitive offers; lowballing is unlikely to land.
- 4 sale attempts since 8y ago with the ask held roughly flat each time — persistent listings suggest the price (not the market) is what's stuck; bring a comps-based counter.
Risks & watch-outs
- Climate carrying-cost: severe wind risk, 98% chance of damaging wind over 30y; extreme-heat days projected 7→24/yr by 2055 (HVAC capex compounding) — expect insurance premiums to compound above CPI over the hold.
Questions for the listing agent
- Built in 1970 — when were the roof, HVAC, electrical panel, plumbing, and water heater last replaced?
- Is there a deadline driving the sale (1031 exchange, divorce, estate, relocation)? That informs how much negotiation room exists.
- What's the average days-on-market for RENTAL listings here right now (not sales)? A rising rental-DOM trend means longer vacancies and softer asking-rent achievability than the comps imply.
- What's the recent tenant-quality profile in this submarket — average credit score on applications, eviction rate, late-payment / NSF rate, and stable-employment percentage? A property-management company in the area should have these aggregated.
- How much new for-sale + rental construction is in the pipeline within 1–3 miles? Heavy new supply typically softens prices + rents 12–24 months out; constrained supply supports both.
Investment metrics
- 1% rule
- 1.41% ✓
- Cap rate
- 11.68%
- Cash-on-cash
- 19.22%
- DSCR
- 1.86
- GRM
- 5.9
CMA / ARV
- ARV (on-the-fly)
- $186,912
- Comps found
- 1
Show comp detail 1 sale within ~0.75 mi
| Address | Dist | Beds/Ba | Sqft | Sold | Price | $/sf | Match |
|---|---|---|---|---|---|---|---|
| 108 Browns Bnd | 0.23mi | 2/2.0 (-1) | 960 (-9%) | 8mo | $170,000 | $177 | 62 |
Match score weights: distance 35% · size 25% · config 20% · recency 20%. Top-matched comps best support the ARV.
Projected returns pro-forma
1.2% appreciation · 3.0% rent growth · sell at horizon
- IRR
- 21.7%
- Equity multiple
- 2.12×
- Total profit
- $28,305
- Equity at exit
- $31,685
- IRR
- 24.5%
- Equity multiple
- 4.01×
- Total profit
- $75,802
- Equity at exit
- $42,860
Cash invested: $25,200 (down + closing). Projections, not guarantees.
Landlord ↔ Tenant lean methodology
- Overall (STATE)
- 87 Strongly Landlord-Friendly
- State Texas
- 87 Strongly Landlord-Friendly · R+5
- County
- — inherits STATE
- City
- — inherits STATE
ZIP-level market 77879
- Home prices YoY
- 0.7%
- Active inventory
- 221
- Price-to-rent
- 5.9×
Monthly cashflow live
- Estimated rent
- $1,270 medium interval (Pro) →
- Mortgage (P&I)
- −$472
- Tax from tax record
- −$90 /mo · $1,085/yr
- Insurance
- −$38
- HOA
- −$0
- Vacancy / Maint / Mgmt
- −$267
- Net cashflow
- $404
Break-even live
UW: 25.0% down · 7.5% · 30yr · 1.5% tax · 5.0% vac · 8.0% maint · 8.0% mgmt
Financing live
Cash to close
- Down payment
- $22,500
- Closing costs
- $2,700
- Reserves months
- —
- Total cash needed
- —
Loan-product check · same deal, 3 products live
Conventional
25% down · 7.5% · 30yr
- Down + closing
- —
- Monthly P&I
- —
- Monthly cashflow
- —
- DSCR
- —
- Eligible?
- —
Personal DTI + credit; lowest rate.
DSCR
20% down · 8.5% · 30yr
- Down + closing
- —
- Monthly P&I
- —
- Monthly cashflow
- —
- DSCR
- —
- Eligible?
- —
No personal income docs; deal must DSCR.
Hard money
10% down · 12.0% · 12mo
- Down + closing
- —
- Monthly P&I
- —
- Monthly cashflow
- —
- DSCR
- —
- Eligible?
- —
Short-term bridge; refi at stabilization.
Listing history 7 events
-
2026-06-19days on market $90,000 Active 6 DOM
-
2026-06-18days on market $90,000 Active 5 DOM
-
2026-06-17days on market $90,000 Active 4 DOM
-
2026-06-16days on market $90,000 Active 3 DOM
-
2026-06-15days on market $90,000 Active 2 DOM
-
2026-06-14remarks 326-char remark
-
2026-06-14$90,000 Active 1 DOM
ⓘ Source: listings_history table (triggers on properties + properties_extension) + one-shot
backfill from property_details.listing_events for pre-trigger history.
Tax reassessment forecast TX · Resets to sale price
- Current annual tax
- $1,085 · $90/mo
- Projected year-2 tax
- $1,647 · $137/mo
- Expected delta
- +$562/yr (+$47/mo · 51.8%)
ⓘ Screening estimate from a state-policy table — verify with the county assessor before closing.
Climate risk First Street
- Flood 1/10 Low FEMA zone X (unshaded) · 0% chance over 30 yrs
- Wildfire 4/10 Moderate
- Heat 8/10 Severe 7 d/yr ≥110°F today · 24 d/yr by 30 yrs out
- Wind 8/10 Severe 98% chance of damaging wind over 30 yrs
- Air quality 1/10 Low 0 unhealthy d/yr today · 0 by 30 yrs out
Nearby sold comps map
Loading sold comps map…
Walkable amenities ~0.75 mi
Loading nearby amenities…
Taxation est. · year 1
- Rental income
- $15,244
- − Mortgage interest
- −$5,041
- − Property taxes
- −$1,085
- − Insurance
- −$450
- − Repairs & maintenance
- −$1,220
- − Management
- −$1,220
- − Depreciation
- −$2,618
- Taxable income
- $3,611
- Est. tax owed @ 24.0%
- −$867
- After-tax cash flow
- $3,978/yr
For passive investors: Depreciation is non-cash, so a rental often shows a tax loss while cash-flowing — sheltering income. Rental losses are passive: they offset passive income freely, and up to $25,000/yr can offset ordinary (W-2) income if you actively participate and your MAGI is under $100k (phasing out to $0 by $150k); unused losses carry forward. On sale, claimed depreciation is recaptured at up to 25%, and gains may owe capital-gains tax (a 1031 exchange can defer both). Figures are a year-1 estimate at your 24.0% rate — not tax advice; consult a CPA.
Schools (NCES district)
- District
- Somerville ISD
- NCES district ID
- 4840770
- Math proficiency
- 36% ▲ 10.00%
- Reading proficiency
- 29% ▬ 0.00%
- Median HH income
- $42,453
- Composite
- 27.59/100
- National rank
- #6936
- State rank
- #579 of 826 in TX
Livability — Lyons
No livability data for this city. (Only ~50 U.S. cities are tracked.)
Census & demographics
- City population
- 370
- Population (ZIP)
- 4,775
Population outlook (Burleson County) Hauer SSP2
- Today (2025)
- 18,066 people
- By 2030
- 18,174 · +0.6%
- By 2040
- 18,198 · +0.7%
- By 2050
- 18,110 · +0.2%
- By 2075
- 18,166 · +0.6%
- By 2100
- 16,949 · -6.2%
Race, ethnicity, and origin ACS 2023
- Neighborhood character
- Diverse neighborhood (Simpson 0.58)
- Race & ethnicity
- White 59% Hispanic / Latino 23% Two or more races 15% Black 14% Native American 2%
- Hispanic origin (detail)
- Mexican 20%
- Common ancestry
- Lithuanian 2% Slovak 2% Serbian 1%
- Foreign-born
- 8% · Canada, Vietnam
- Languages at home
- 84% English-only · Spanish 14% Vietnamese 1% Tagalog/Filipino 1%
Political lean MEDSL · Burleson
- 2024 margin
- Solid R (+62.8) · D 18.2% · R 81.0%
- 2008→2024 swing
- -25.4pp toward R · 2008: -37.4pp · 2024: -62.8pp
- All cycles
- 2024: R+62.8 2020: R+57.6 2016: R+55.1 2012: R+46.0 2008: R+37.4
Not yet ingested
- Civics
- —
Market trends
- HPI YoY
- ▲ 1.20%
- Current HPI
- 178.3416
- Rent YoY
- —
- Metro
- —
- State GDP YoY
- ▲ 3.95%
- F500 in state
- 110
Industry mix (Fortune 500 HQ in TX)
| Industry | F500 HQs | Revenue |
|---|---|---|
| Energy | 16 | $1,198B |
|
||
| Technology | 5 | $198B |
|
||
| Engineering / Construction | 4 | $72B |
|
||
| Energy Services | 3 | $60B |
|
||
| Utilities | 3 | $41B |
|
||
| Healthcare | 2 | $330B |
|
||
Price history
+38.5% since first listed11 events — show timeline
- 2026-06-14 Listed $90,000 FSBO.com
- 2023-06-02 Sold (Public Records) — Public Records
- 2023-06-02 Sold (Public Records) — Public Records
- 2023-05-26 Sold (MLS) — BCSRMLS
- 2023-05-02 Pending — BCSRMLS
- 2023-04-19 Price Changed $49,900 BCSRMLS
- 2023-03-06 Listed $55,000 BCSRMLS
- 2019-02-08 Listed $55,000 BCSRMLS
- 2018-01-31 Listed $65,000 BCSRMLS
- 2017-10-20 Sold (Public Records) — Public Records
- 2005-11-14 Sold (Public Records) — Public Records
Property tax history
+14.5%/yrLatest (2025): $1,085 · +42.1% YoY. Source: county tax records.
Cash-flow waterfall
monthlySold comps — $/sqft
last 12 mo · ≤1 miLoading sold comps…