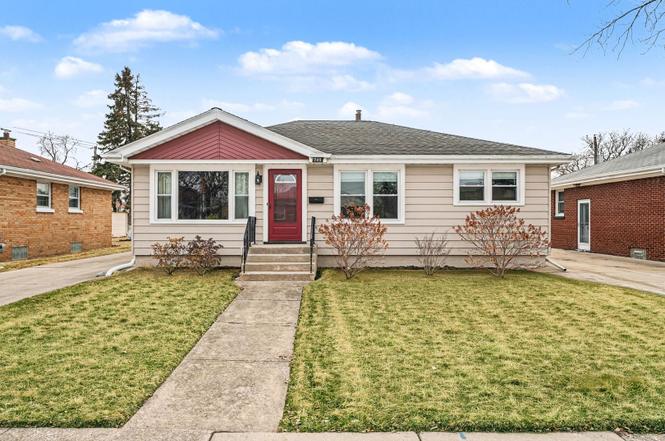
735 E 163rd St · South Holland, IL
Flood risk 1/10 · Minimal
- FEMA flood zone
- X (unshaded)
- Chance of flooding over 30 yrs
- 0.0%
- Est. flood insurance / yr
- $473 – $860
Fire risk 1/10 · Minimal
- Est. fire insurance / yr
- $804 – $1,492
Heat risk 3/10 · Minor
- Hot days now (above 103°F)
- 7 days/yr
- Hot days in 30 yrs
- 15 days/yr
Wind risk 2/10 · Minimal
- Chance of severe wind over 30 yrs
- —
Air-quality risk 4/10 · Minor
- Unhealthy air days now
- 4 days/yr
- Unhealthy air days in 30 yrs
- 5 days/yr
Risk factors via First Street. Map © Google.
Why this score? — see what drove the D+ grade
The composite is a weighted blend of 9 inputs, each scored 0–100. Each bar is that input's sub-score; the figure is the points it added to the 100-point composite (weight × sub-score).
- Cash flow +21.4/30.0
- 1% rule +7.9/10.0
- DSCR +6.8/10.0
- ARV discount +3.9/15.0
- Livability +3.9/5.0
- Rent growth +2.5/5.0
- Condition / age +2.5/5.0
- Schools +0.7/10.0
- Appreciation +0.0/10.0
$199,900
🖨 Deal sheet 📄 Offer letter ✓ Due diligence
Listing remarks
Well Maintained 3 Bedroom Ranch home with side Driveway to 2-1/2 Car Garage conveniently located near shopping and interstate. Main Floor has beautiful refinished (8 yr) Hardwood Floors in Living Room, Hallway and Bedrooms and an updated ( 5 yr) Kitchen with Granite Counters, Stainless appliances and laminate floors. Rooms include Living Room, Dine-in Kitchen, 3 Bedrooms and a full bath; there is also a finished 3 Season Room with views of the back yard. A Full Basement provides ample storage, laundry and potential for additional living space. Additional recent updates include New Electrical Panel (2024), new water lines throughout entire home (2025), new AC (2023) and new Strom Door (2025)
Key facts
- Stainless appliances
- Full basement
- New electrical panel
Tags
Property features AI
Finance
- Other: Basement: unfinished full basement (approx. 1,064); Total finished/unfinished area approx. 2,287
- HOA & community: No master association fee required
Exterior
- Parking: Detached garage with 2.5 garage spaces; Concrete driveway; Garage door opener
- Utilities: Lake Michigan and public water; Public sewer; Electric with circuit breakers
- Home design: Detached single-family home; One-story; Fee simple ownership; Estimated living area
- Construction: Built approximately 61-70 years ago; Aluminum siding; Asphalt roof; Concrete perimeter foundation
- Exterior features: 60 x 120 lot; Less than 0.25 acre lot
Interior
- Kitchen: Range; Dishwasher; Refrigerator
- Bedrooms: 3 bedrooms (all on main level): Master 13 x 11; Bedroom 2 12 x 11; Bedroom 3 13 x 11
- Flooring: Hardwood in living room and bedrooms; Laminate in kitchen; Carpet in enclosed porch
- Bathrooms: 1 full bathroom
- Heating & cooling: Natural gas forced air heating; Central air conditioning
- Interior features: 5 total rooms; Enclosed porch (main level, 15 x 10)
- Laundry & utility: Washer; Dryer; Unfinished full basement (utility space)
Neighborhood map
What this means for you Summary
Snapshot
- This is a 2-bed/1.0-bath single-family listed at $200k.
Deal economics
- At list price, monthly cash flow is $296 ($4k/yr) — positive.
- The deal already cash-flows at list — no discount required.
- Meets the 1% rule at list price ($3k rent vs $200k).
- Recommended offer: $182k (9.0% below list) — sets the bar for market timing.
Location & tenants
- Location reads 77/100 on livability (#167 in IL, #3,071 nationally) — a middle-class / working-renter tenant base. Strengths: commute A+, housing A+, cost of living A; Watch: crime C-, amenities C-, schools D+.
- Thornton Twp Hsd 205 (suburban): math 7% / reading 8% proficiency, ranked #594 of 620 in IL (top 96%) — low school quality limits family demand, transient renter base, plan for 1-2y turnover.
- Market conditions: 135 active listings in the ZIP; 5 comparable units currently listed for rent nearby; rentals leasing fast (median 10d on market — plan ~1-2 weeks tenant-placement turnaround); 6,272 units permitted in Cook County in 2024 (4,658 in 5+ unit buildings).
Forward outlook
- Local home prices are declining (-3.0%/yr); year-one equity from $1k of loan paydown is wiped out by about $6k of value loss. Plan a longer hold.
Negotiation context
- It's been on market 99 days — a 9% lower offer ($182k) is reasonable based on typical stale-listing flexibility.
- Current owner paid $101k; list at $200k implies a 98% gain — meaningful room to come down on a strong offer.
Risks & watch-outs
- Watch-outs: property tax is 3.7% of price; built in 1956 — expect roof / HVAC / electrical / plumbing capex.
Questions for the listing agent
- It's been on market 99 days. Have you received any prior offers? Is the seller open to a 9% concession, seller financing, or rate buy-down credit?
- Built in 1956 — when were the roof, HVAC, electrical panel, plumbing, and water heater last replaced?
- Property tax is high relative to price — has the assessment been appealed recently, and will the sale trigger a re-assessment?
- Why hasn't it sold? Are there any deal-killer items the seller is aware of (foundation, flood, title, zoning, code violations)?
- Is there a deadline driving the sale (1031 exchange, divorce, estate, relocation)? That informs how much negotiation room exists.
- Schools are D-rated, which usually means shorter tenancies and higher turnover. Who's the typical renter profile here, and what's been the actual vacancy rate?
- The area grade is low — what's the realistic commute time and amenity access for the typical tenant pool here? Any planned neighborhood developments (good or bad) we should know about?
- What's the average days-on-market for RENTAL listings here right now (not sales)? A rising rental-DOM trend means longer vacancies and softer asking-rent achievability than the comps imply.
- What's the recent tenant-quality profile in this submarket — average credit score on applications, eviction rate, late-payment / NSF rate, and stable-employment percentage? A property-management company in the area should have these aggregated.
- How much new for-sale + rental construction is in the pipeline within 1–3 miles? Heavy new supply typically softens prices + rents 12–24 months out; constrained supply supports both.
Investment metrics
- 1% rule
- 1.29% ✓
- Cap rate
- 8.07%
- Cash-on-cash
- 6.35%
- DSCR
- 1.28
- GRM
- 6.5
CMA / ARV
- ARV (on-the-fly)
- $185,136
- Comps found
- 12
Show comp detail 12 sales within ~0.75 mi
| Address | Dist | Beds/Ba | Sqft | Sold | Price | $/sf | Match |
|---|---|---|---|---|---|---|---|
| 823 E 163rd St | 0.14mi | 3/1.0 (+1) | 1,184 (+11%) | 1mo | $197,500 | $167 | 69 |
| 15944 School St | 0.42mi | 2/1.0 | 1,008 (-5%) | 4mo | $175,000 | $174 | 68 |
| 503 Marie Dr | 0.42mi | 3/2.0 (+1) | 1,056 (-1%) | 5mo | $216,900 | $205 | 66 |
| 519 E 161st St | 0.33mi | 3/2.0 (+1) | 1,024 (-4%) | 5mo | $210,000 | $205 | 65 |
| 16645 Cottage Grove Ave | 0.48mi | 3/2.0 (+1) | 1,120 (+5%) | 1mo | $211,894 | $189 | 59 |
| 509 E 161st Pl | 0.29mi | 3/2.0 (+1) | 1,176 (+10%) | 4mo | $182,000 | $155 | 56 |
| 16417 Claire Ln | 0.27mi | 3/2.5 (+1) | 1,209 (+14%) | 2mo | $254,995 | $211 | 52 |
| 944 E 163rd Pl | 0.31mi | 3/2.0 (+1) | 1,205 (+13%) | 2mo | $201,000 | $167 | 52 |
| 535 E 166th Pl | 0.50mi | 2/1.5 | 1,200 (+13%) | 2mo | $156,500 | $130 | 51 |
| 16728 School St | 0.56mi | 3/1.5 (+1) | 1,170 (+10%) | 2mo | $196,000 | $168 | 49 |
| 15726 Ingleside Ave | 0.73mi | 3/2.0 (+1) | 1,171 (+10%) | 4mo | $220,000 | $188 | 36 |
| 15760 Church Dr | 0.63mi | 3/2.0 (+1) | 1,201 (+13%) | 5mo | $165,000 | $137 | 36 |
Match score weights: distance 35% · size 25% · config 20% · recency 20%. Top-matched comps best support the ARV.
Projected returns pro-forma
-3.0% appreciation · 3.0% rent growth · sell at horizon
- IRR
- -6.4%
- Equity multiple
- 0.76×
- Total profit
- $-13,263
- Equity at exit
- $29,806
- IRR
- 3.4%
- Equity multiple
- 1.25×
- Total profit
- $13,805
- Equity at exit
- $17,284
Cash invested: $55,972 (down + closing). Projections, not guarantees.
Landlord ↔ Tenant lean methodology
- Overall (STATE)
- 43 Moderately Tenant-Leaning
- State Illinois
- 43 Moderately Tenant-Leaning · D+7
- County
- — inherits STATE
- City
- — inherits STATE
ZIP-level market 60473
- Active inventory
- 135
- Price-to-rent
- 6.5×
Monthly cashflow live
- Estimated rent
- $2,580 high interval (Pro) →
- Mortgage (P&I)
- −$1,048
- Tax from tax record
- −$610 /mo · $7,322/yr
- Insurance
- −$83
- HOA
- −$0
- Vacancy / Maint / Mgmt
- −$542
- Net cashflow
- $296
Break-even live
UW: 25.0% down · 7.5% · 30yr · 1.5% tax · 5.0% vac · 8.0% maint · 8.0% mgmt
Financing live
Cash to close
- Down payment
- $49,975
- Closing costs
- $5,997
- Reserves months
- —
- Total cash needed
- —
Loan-product check · same deal, 3 products live
Conventional
25% down · 7.5% · 30yr
- Down + closing
- —
- Monthly P&I
- —
- Monthly cashflow
- —
- DSCR
- —
- Eligible?
- —
Personal DTI + credit; lowest rate.
DSCR
20% down · 8.5% · 30yr
- Down + closing
- —
- Monthly P&I
- —
- Monthly cashflow
- —
- DSCR
- —
- Eligible?
- —
No personal income docs; deal must DSCR.
Hard money
10% down · 12.0% · 12mo
- Down + closing
- —
- Monthly P&I
- —
- Monthly cashflow
- —
- DSCR
- —
- Eligible?
- —
Short-term bridge; refi at stabilization.
Rent comps 5 comps
| Address | Beds | Baths | Sqft | Rent | $/sqft | DOM | Units | Dist |
|---|---|---|---|---|---|---|---|---|
| 16246 Dobson Ave South Holland, IL | 3.0 | 2.0 | 1250 | $3,170 | $2.54 | 1d | 1 | 0.39mi |
| 16001 Avalon Ave South Holland, IL | 3.0 | 2.0 | 1136 | $3,330 | $2.93 | 6d | 1 | 0.78mi |
| 15324 Doctor Martin Luther King Junior Dr Unit 1B Dolton, IL | 1.0 | 1.0 | 725 | $985 | $1.36 | 18d | 1 | 1.26mi |
| 15238 Doctor Martin Luther King Junior Dr Unit 2W Dolton, IL | 2.0 | 1.0 | 800 | $1,500 | $1.88 | 10d | 1 | 1.35mi |
| 1450 E 154th Pl Dolton, IL | 1.0 | 1.0 | 800 | $1,250 | $1.56 | 24d | 1 | 1.39mi |
Listing history 5 events
-
2026-05-08historical Contingent - Continue to Show
-
2026-03-11price $199,900
-
2026-02-16$204,900 Active
-
2000-08-29soldstatus $101,000
-
1994-06-16soldstatus $87,500
ⓘ Source: listings_history table (triggers on properties + properties_extension) + one-shot
backfill from property_details.listing_events for pre-trigger history.
Tax reassessment forecast IL · Partial reset (capped growth)
- Current annual tax
- $7,322 · $610/mo
- Projected year-2 tax
- $7,322 · $610/mo
- Expected delta
- $0/yr ($0/mo · 0.0%)
ⓘ Screening estimate from a state-policy table — verify with the county assessor before closing.
Climate risk First Street
- Flood 1/10 Low FEMA zone X (unshaded) · 0% chance over 30 yrs
- Wildfire 1/10 Low
- Heat 3/10 Moderate 7 d/yr ≥103°F today · 15 d/yr by 30 yrs out
- Wind 2/10 Low
- Air quality 4/10 Moderate 4 unhealthy d/yr today · 5 by 30 yrs out
Nearby sold comps map
Loading sold comps map…
Walkable amenities ~0.75 mi
Loading nearby amenities…
Taxation est. · year 1
- Rental income
- $30,957
- − Mortgage interest
- −$11,198
- − Property taxes
- −$7,322
- − Insurance
- −$1,000
- − Repairs & maintenance
- −$2,477
- − Management
- −$2,477
- − Depreciation
- −$5,815
- Taxable income
- $670
- Est. tax owed @ 24.0%
- −$161
- After-tax cash flow
- $3,394/yr
For passive investors: Depreciation is non-cash, so a rental often shows a tax loss while cash-flowing — sheltering income. Rental losses are passive: they offset passive income freely, and up to $25,000/yr can offset ordinary (W-2) income if you actively participate and your MAGI is under $100k (phasing out to $0 by $150k); unused losses carry forward. On sale, claimed depreciation is recaptured at up to 25%, and gains may owe capital-gains tax (a 1031 exchange can defer both). Figures are a year-1 estimate at your 24.0% rate — not tax advice; consult a CPA.
Schools (NCES district)
- District
- Thornton Twp Hsd 205
- NCES district ID
- 1738970
- Math proficiency
- 7% ▬ 0.00%
- Reading proficiency
- 8% ▼ -2.00%
- Median HH income
- $43,392
- Composite
- 6.92/100
- National rank
- #9976
- State rank
- #594 of 620 in IL
Livability — South Holland
- Score
- 77/100
- State rank
- #167
- US rank
- #3071
Category grades
Schools grade is shown separately in the Schools card above.
Census & demographics
- Census place
- South Holland, IL
- City population
- 21,407
- Population (ZIP)
- 21,407
Population outlook (Cook County) Hauer SSP2
- Today (2025)
- 5,347,519 people
- By 2030
- 5,357,703 · +0.2%
- By 2040
- 5,324,924 · -0.4%
- By 2050
- 5,230,762 · -2.2%
- By 2075
- 4,785,735 · -10.5%
- By 2100
- 4,188,836 · -21.7%
Race, ethnicity, and origin ACS 2023
- Neighborhood character
- Predominantly Black (75%)
- Race & ethnicity
- Black 75% White 10% Hispanic / Latino 10% Two or more races 3% Asian 1%
- Hispanic origin (detail)
- Mexican 9% Puerto Rican 1%
- Common ancestry
- Iranian 3% Romanian 2%
- Foreign-born
- 6% · Canada, China
- Languages at home
- 87% English-only · Spanish 8% Other Asian/Pacific 1% Russian/Polish/Slavic 1%
Political lean MEDSL · Cook
- 2024 margin
- Solid D (+42.0) · D 70.4% · R 28.4% · Other 1.2%
- 2008→2024 swing
- -11.4pp toward R · 2008: 53.4pp · 2024: 42.0pp
- All cycles
- 2024: D+42.0 2020: D+50.3 2016: D+53.0 2012: D+49.4 2008: D+53.4
Not yet ingested
- Civics
- —
Market trends
- HPI YoY
- ▼ -114.36%
- Current HPI
- 201.2479
- Rent YoY
- —
- Metro
- —
- State GDP YoY
- ▲ 1.59%
- F500 in state
- 60
Industry mix (Fortune 500 HQ in IL)
| Industry | F500 HQs | Revenue |
|---|---|---|
| Insurance | 4 | $201B |
|
||
| Consumer Goods | 4 | $87B |
|
||
| Industrial Machinery | 3 | $64B |
|
||
| Healthcare | 2 | $55B |
|
||
| Retail / Pharmacy | 1 | $148B |
|
||
| Agriculture / Food | 1 | $86B |
|
||
Price history
+128.5% since first listed5 events — show timeline
- 2026-05-08 Contingent — MRED as Distributed by MLS Grid
- 2026-03-11 Price Changed $199,900 MRED as Distributed by MLS Grid
- 2026-02-16 Listed $204,900 MRED as Distributed by MLS Grid
- 2000-08-29 Sold (Public Records) $101,000 Public Records
- 1994-06-16 Sold (Public Records) $87,500 Public Records
Property tax history
+5.0%/yrLatest (2023): $7,322 · +63.2% YoY. Source: county tax records.
Cash-flow waterfall
monthlySold comps — $/sqft
last 12 mo · ≤1 miLoading sold comps…