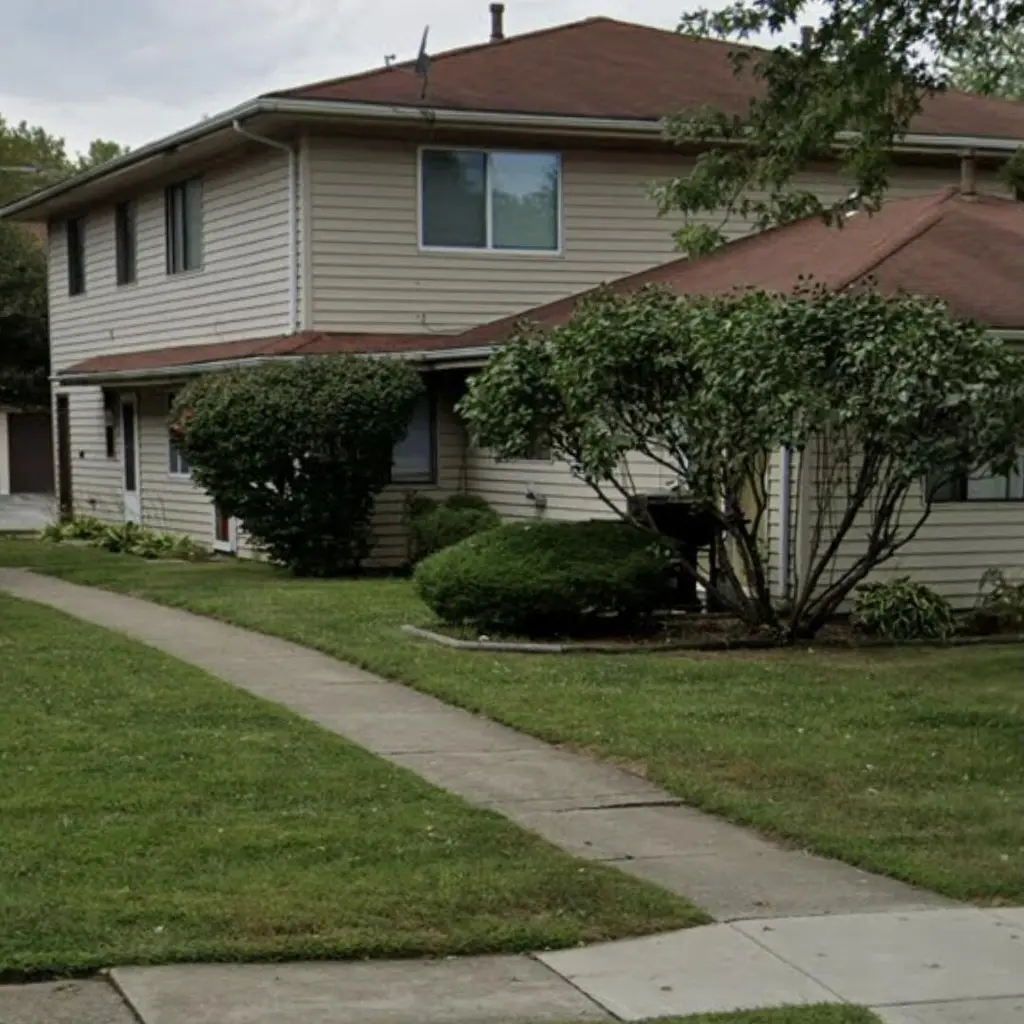
7005 Fillmore Dr · Merrillville, IN
Flood risk 1/10 · Minimal
- FEMA flood zone
- X (unshaded)
- Chance of flooding over 30 yrs
- 0.0%
- Est. flood insurance / yr
- $507 – $1,088
Fire risk 1/10 · Minimal
- Est. fire insurance / yr
- $717 – $1,331
Heat risk 3/10 · Minor
- Hot days now (above 101°F)
- 7 days/yr
- Hot days in 30 yrs
- 15 days/yr
Wind risk 2/10 · Minimal
- Chance of severe wind over 30 yrs
- 0.0%
Air-quality risk 3/10 · Minor
- Unhealthy air days now
- 2 days/yr
- Unhealthy air days in 30 yrs
- 3 days/yr
Risk factors via First Street. Map © Google.
Why this score? — see what drove the B- grade
The composite is a weighted blend of 9 inputs, each scored 0–100. Each bar is that input's sub-score; the figure is the points it added to the 100-point composite (weight × sub-score).
- Cash flow +30.0/30.0
- 1% rule +10.0/10.0
- DSCR +10.0/10.0
- ARV discount +7.5/15.0
- Livability +3.8/5.0
- Rent growth +3.5/5.0
- Schools +2.6/10.0
- Condition / age +2.5/5.0
- Appreciation +0.0/10.0
$109,900
🖨 Deal sheet 📄 Offer letter ✓ Due diligence
Listing remarks MLS
2 bedroom 2 Story Condo. Vinyl siding. Walk-in closet in main bedroom. 1 car attached garage. * * * This is a HUD Property - an Equal Housing Opportunity. Property #151-640993. All properties sold as is and buyers are encouraged to inspect homes prior to submitting bid. See agent remarks for bid procedures. For showing access, use Showing Assist to register. No confirmation required. GNIAR lockbox on property.
Key facts
- New bathroom tub
- Extra storage
- Attached garage unit
Tags
Property features AI
Finance
- Other: Vacant occupant status
- HOA & community: Homeowners association with annual fee; Annual association fee $1,500; Association covers landscaping, snow removal, and grounds/structure maintenance
Exterior
- Parking: Attached garage; 1 garage space; Driveway; Paved parking; Off-street parking; On-street parking; Alley access; Concrete and asphalt surfaces; Garage faces rear; Garage door opener; Additional parking
- Utilities: Public water; Public sewer
- Home design: Condominium unit in a multi-unit property; Two levels; Built in 1973
- Construction: Built in 1973
- Exterior features: Balcony; Storage; Neighborhood view
Interior
- Kitchen: Gas range; Dishwasher; Refrigerator
- Bedrooms: Primary bedroom; Second bedroom
- Flooring: Laminate
- Bathrooms: 1 full bathroom
- Heating & cooling: Forced air heating (natural gas); Central air conditioning
- Interior features: Eat-in kitchen; Balcony; Storage; Neighborhood view
- Laundry & utility: Washer; Dryer
Neighborhood map
What this means for you Summary
Snapshot
- This is a 2-bed/1.0-bath condo listed at $110k.
Deal economics
- At list price, monthly cash flow is $568 ($7k/yr) — positive.
- The deal already cash-flows at list — no discount required.
- Meets the 1% rule at list price ($2k rent vs $110k).
- Recommended offer: $100k (9.0% below list) — sets the bar for market timing.
- Cap rate 12.5% vs local median 4.7% in Merrillville — top-decile yield for the area; either an underpriced asset or a hidden risk that comps aren't pricing in. Stress-test before assuming the spread holds.
Location & tenants
- Location reads 76/100 on livability (#50 in IN, #3,393 nationally) — a middle-class / working-renter tenant base. Strengths: commute A+, cost of living A+, housing A+; Watch: schools D+, amenities F, health & safety D-.
- Merrillville Community School Corporation (suburban): math 22% / reading 36% proficiency, ranked #240 of 301 in IN (top 80%) — low school quality limits family demand, transient renter base, plan for 1-2y turnover.
- Market conditions: Rents rising fast (+4.1%/yr); 264 active listings in the ZIP; 1 comparable units currently listed for rent nearby; 1,642 units permitted in Lake County in 2024 (14 in 5+ unit buildings).
- This rent runs 33% of the median local income ($64k/yr) — at the standard rent-burdened threshold; future hikes will face affordability resistance.
Forward outlook
- Local home prices are declining (-3.0%/yr); year-one equity from $760 of loan paydown is wiped out by about $3k of value loss. Plan a longer hold.
- Lake County population projected to shrink 7% by 2050 — rents likely to lag national; underwrite the cash flow, not the appreciation.
- At projected returns (-3.0% appreciation + 4.1% rent growth), your $31k cash investment doubles in ~6 years — after that, you're playing with house money.
Negotiation context
- It's been on market 112 days — a 9% lower offer ($100k) is reasonable based on typical stale-listing flexibility.
- 6 sale attempts since 25y ago; this cycle's ask has dropped $10k (8%) from the opening price — seller is motivated, your offer sets the floor, not the list.
- Current owner paid $22k; list at $110k implies a 394% gain — meaningful room to come down on a strong offer.
Questions for the listing agent
- It's been on market 112 days. Have you received any prior offers? Is the seller open to a 9% concession, seller financing, or rate buy-down credit?
- Built in 1973 — when were the roof, HVAC, electrical panel, plumbing, and water heater last replaced?
- What does the HOA fee cover, when was the last increase, and are there any pending special assessments or reserve-fund shortfalls?
- Any open or pending special assessments — roof, HVAC, plumbing, elevator, façade? What's the per-unit balance and payoff schedule, and is the seller paying it off at close or rolling it to the buyer?
- Why hasn't it sold? Are there any deal-killer items the seller is aware of (foundation, flood, title, zoning, code violations)?
- Is there a deadline driving the sale (1031 exchange, divorce, estate, relocation)? That informs how much negotiation room exists.
- Schools are D-rated, which usually means shorter tenancies and higher turnover. Who's the typical renter profile here, and what's been the actual vacancy rate?
- What's the average days-on-market for RENTAL listings here right now (not sales)? A rising rental-DOM trend means longer vacancies and softer asking-rent achievability than the comps imply.
- What's the recent tenant-quality profile in this submarket — average credit score on applications, eviction rate, late-payment / NSF rate, and stable-employment percentage? A property-management company in the area should have these aggregated.
- How much new apartment / multifamily construction is in the pipeline within 1–3 miles? Heavy new supply (>2% of stock underway) typically softens rents 12–24 months out; light construction supports rent growth.
Investment metrics
- 1% rule
- 1.63% ✓
- Cap rate
- 12.49%
- Cash-on-cash
- 22.14%
- DSCR
- 1.99
- GRM
- 5.1
CMA / ARV
No comps found within radius.
Projected returns pro-forma
-3.0% appreciation · 4.1% rent growth · sell at horizon
- IRR
- 16.2%
- Equity multiple
- 1.66×
- Total profit
- $20,427
- Equity at exit
- $16,386
- IRR
- 25.7%
- Equity multiple
- 3.37×
- Total profit
- $73,056
- Equity at exit
- $9,502
Cash invested: $30,772 (down + closing). Projections, not guarantees.
Landlord ↔ Tenant lean methodology
- Overall (STATE)
- 90 Strongly Landlord-Friendly
- State Indiana
- 90 Strongly Landlord-Friendly · R+11
- County
- — inherits STATE
- City
- — inherits STATE
ZIP-level market 46410
- Rents YoY
- 4.1%
- Active inventory
- 264
- Price-to-rent
- 5.1×
Monthly cashflow live
- Estimated rent
- $1,787 medium interval (Pro) →
- Mortgage (P&I)
- −$576
- Tax from tax record
- −$97 /mo · $1,162/yr
- Insurance
- −$46
- HOA
- −$125
- Vacancy / Maint / Mgmt
- −$375
- Net cashflow
- $568
Break-even live
UW: 25.0% down · 7.5% · 30yr · 1.5% tax · 5.0% vac · 8.0% maint · 8.0% mgmt
Financing live
Cash to close
- Down payment
- $27,475
- Closing costs
- $3,297
- Reserves months
- —
- Total cash needed
- —
Loan-product check · same deal, 3 products live
Conventional
25% down · 7.5% · 30yr
- Down + closing
- —
- Monthly P&I
- —
- Monthly cashflow
- —
- DSCR
- —
- Eligible?
- —
Personal DTI + credit; lowest rate.
DSCR
20% down · 8.5% · 30yr
- Down + closing
- —
- Monthly P&I
- —
- Monthly cashflow
- —
- DSCR
- —
- Eligible?
- —
No personal income docs; deal must DSCR.
Hard money
10% down · 12.0% · 12mo
- Down + closing
- —
- Monthly P&I
- —
- Monthly cashflow
- —
- DSCR
- —
- Eligible?
- —
Short-term bridge; refi at stabilization.
Rent comps 1 comps
| Address | Beds | Baths | Sqft | Rent | $/sqft | DOM | Units | Dist |
|---|---|---|---|---|---|---|---|---|
| 6092 Cleveland St Merrillville, IN | 3.0 | 2.5 | 3136 | $3,000 | $0.96 | 43d | 1 | 1.13mi |
HOA detail condo
- Monthly dues
- $125 · $1,500/yr
- Assessments
- None detected in remarks — confirm with the listing agent.
Listing history 26 events
-
2026-06-18days on market $109,900 Active 112 DOM
-
2026-06-17days on market $109,900 Active 111 DOM
-
2026-06-16days on market $109,900 Active 110 DOM
-
2026-06-16price $109,900 Active 109 DOM
-
2026-06-15days on market $114,900 Active 109 DOM
-
2026-06-13days on market $114,900 Active 107 DOM
-
2026-06-13days on market $114,900 Active 106 DOM
-
2026-06-09days on market $114,900 Active 103 DOM
-
2026-06-08days on market $114,900 Active 102 DOM
-
2026-06-07days on market $114,900 Active 101 DOM
-
2026-06-04days on market $114,900 Active 98 DOM
-
2026-06-03days on market $114,900 Active 97 DOM
-
2026-06-02days on market $114,900 Active 96 DOM
-
2026-06-01days on market $114,900 Active 95 DOM
-
2026-05-31days on market $114,900 Active 94 DOM
-
2026-05-20status Active
-
2026-02-07status Pending
-
2026-01-10status Active
-
2026-01-06status Pending
-
2025-11-22price $114,900
-
2025-11-12$119,900 Active
-
2014-10-01historical
-
2013-08-22$29,400
-
2013-08-05soldstatus $22,250 416-char remark
Show marketing remark (416 chars)
2 bedroom 2 Story Condo. Vinyl siding. Walk-in closet in main bedroom. 1 car attached garage. * * * This is a HUD Property - an Equal Housing Opportunity. Property #151-640993. All properties sold as is and buyers are encouraged to inspect homes prior to submitting bid. See agent remarks for bid procedures. For showing access, use Showing Assist to register. No confirmation required. GNIAR lockbox on property.
-
2013-01-09$35,000 416-char remark
Show marketing remark (416 chars)
2 bedroom 2 Story Condo. Vinyl siding. Walk-in closet in main bedroom. 1 car attached garage. * * * This is a HUD Property - an Equal Housing Opportunity. Property #151-640993. All properties sold as is and buyers are encouraged to inspect homes prior to submitting bid. See agent remarks for bid procedures. For showing access, use Showing Assist to register. No confirmation required. GNIAR lockbox on property.
-
2001-02-10$55,000
ⓘ Source: listings_history table (triggers on properties + properties_extension) + one-shot
backfill from property_details.listing_events for pre-trigger history.
Tax reassessment forecast IN · Partial reset (capped growth)
- Current annual tax
- $1,162 · $97/mo
- Projected year-2 tax
- $1,162 · $97/mo
- Expected delta
- $0/yr ($0/mo · 0.0%)
ⓘ Screening estimate from a state-policy table — verify with the county assessor before closing.
Climate risk First Street
- Flood 1/10 Low FEMA zone X (unshaded) · 0% chance over 30 yrs
- Wildfire 1/10 Low
- Heat 3/10 Moderate 7 d/yr ≥101°F today · 15 d/yr by 30 yrs out
- Wind 2/10 Low 0% chance of damaging wind over 30 yrs
- Air quality 3/10 Moderate 2 unhealthy d/yr today · 3 by 30 yrs out
Nearby sold comps map
Loading sold comps map…
Walkable amenities ~0.75 mi
Loading nearby amenities…
Taxation est. · year 1
- Rental income
- $21,443
- − Mortgage interest
- −$6,156
- − Property taxes
- −$1,162
- − Insurance
- −$550
- − Repairs & maintenance
- −$1,715
- − Management
- −$1,715
- − HOA
- −$1,500
- − Depreciation
- −$3,197
- Taxable income
- $5,447
- Est. tax owed @ 24.0%
- −$1,307
- After-tax cash flow
- $5,505/yr
For passive investors: Depreciation is non-cash, so a rental often shows a tax loss while cash-flowing — sheltering income. Rental losses are passive: they offset passive income freely, and up to $25,000/yr can offset ordinary (W-2) income if you actively participate and your MAGI is under $100k (phasing out to $0 by $150k); unused losses carry forward. On sale, claimed depreciation is recaptured at up to 25%, and gains may owe capital-gains tax (a 1031 exchange can defer both). Figures are a year-1 estimate at your 24.0% rate — not tax advice; consult a CPA.
Schools (NCES district)
- District
- Merrillville Community School Corporation
- NCES district ID
- 1809690
- Math proficiency
- 22% ▼ -17.00%
- Reading proficiency
- 36% ▼ -8.00%
- Median HH income
- $54,401
- Composite
- 25.74/100
- National rank
- #7375
- State rank
- #240 of 301 in IN
Livability — Merrillville
- Score
- 76/100
- State rank
- #50
- US rank
- #3393
Category grades
Schools grade is shown separately in the Schools card above.
Census & demographics
- Census place
- Merrillville, IN
- County
- Lake County · 422,878 people
- City population
- 39,243
- Metro
- Chicago-Naperville-Elgin, IL-IN-WI
- Population (ZIP)
- 39,243
- Household income
- $64,127
- Rent vs Own
- Severe rent burden
- 1644.0
Population outlook (Lake County) Hauer SSP2
- Today (2025)
- 484,026 people
- By 2030
- 478,091 · -1.2%
- By 2040
- 462,974 · -4.3%
- By 2050
- 449,894 · -7.1%
- By 2075
- 436,169 · -9.9%
- By 2100
- 426,607 · -11.9%
Race, ethnicity, and origin ACS 2023
- Neighborhood character
- Diverse neighborhood (Simpson 0.66)
- Race & ethnicity
- Black 46% White 32% Hispanic / Latino 16% Two or more races 9% Asian 2%
- Hispanic origin (detail)
- Mexican 11% Puerto Rican 3%
- Common ancestry
- Romanian 4% Iranian 2% Italian 1%
- Foreign-born
- 7% · Canada
- Languages at home
- 88% English-only · Spanish 7% Other Indo-European 2%
Political lean MEDSL · Lake
- 2024 margin
- Lean D (+5.6) · D 52.1% · R 46.5% · Other 1.5%
- 2008→2024 swing
- -28.6pp toward R · 2008: 34.3pp · 2024: 5.6pp
- All cycles
- 2024: D+5.6 2020: D+15.1 2016: D+20.6 2012: D+31.0 2008: D+34.3
Not yet ingested
- Civics
- —
Market trends
- HPI YoY
- ▼ -180.11%
- Current HPI
- 240.8833
- Rent YoY
- ▲ 4.10%
- Metro
- Chicago-Naperville-Elgin, IL-IN-WI
- State GDP YoY
- ▲ 2.90%
- F500 in state
- 18
Industry mix (Fortune 500 HQ in IN)
| Industry | F500 HQs | Revenue |
|---|---|---|
| Industrial Machinery | 2 | $37B |
|
||
| Healthcare | 1 | $177B |
|
||
| Pharmaceuticals | 1 | $45B |
|
||
| Metals / Steel | 1 | $18B |
|
||
| Agriculture | 1 | $17B |
|
||
| Packaging | 1 | $12B |
|
||
Price history
+108.9% since first listed11 events — show timeline
- 2026-05-20 Relisted — NIRA MLS as Distributed by MLS Grid
- 2026-02-07 Pending — NIRA MLS as Distributed by MLS Grid
- 2026-01-10 Relisted — NIRA MLS as Distributed by MLS Grid
- 2026-01-06 Pending — NIRA MLS as Distributed by MLS Grid
- 2025-11-22 Price Changed $114,900 NIRA MLS as Distributed by MLS Grid
- 2025-11-12 Listed $119,900 NIRA MLS as Distributed by MLS Grid
- 2014-10-01 Listing Removed — NIRA MLS as Distributed by MLS Grid
- 2013-08-22 Listed $29,400 NIRA MLS as Distributed by MLS Grid
- 2013-08-05 Sold (MLS) $22,250 NIRA MLS as Distributed by MLS Grid
- 2013-01-09 Listed $35,000 NIRA MLS as Distributed by MLS Grid
- 2001-02-10 Listed $55,000 NIRA MLS as Distributed by MLS Grid
Property tax history
-1.1%/yrLatest (2024): $1,162 · +2.1% YoY. Source: county tax records.
Cash-flow waterfall
monthlySold comps — $/sqft
last 12 mo · ≤1 miLoading sold comps…