 🏗️ New Construction
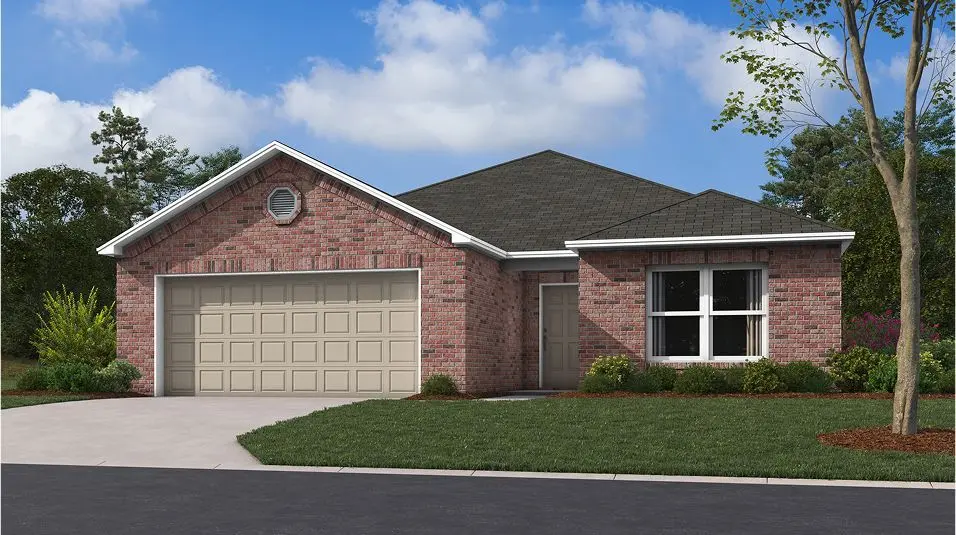
RC Roselyn Plan · Edmond, OK
Flood risk 1/10 · Minimal
- FEMA flood zone
- X (unshaded)
- Chance of flooding over 30 yrs
- 0.0%
- Est. flood insurance / yr
- $507 – $1,088
Fire risk 4/10 · Minor
- Est. fire insurance / yr
- $2,463 – $4,575
Heat risk 5/10 · Moderate
- Hot days now (above 108°F)
- 7 days/yr
- Hot days in 30 yrs
- 19 days/yr
Wind risk 3/10 · Minor
- Chance of severe wind over 30 yrs
- 5.0%
Air-quality risk 2/10 · Minimal
- Unhealthy air days now
- 2 days/yr
- Unhealthy air days in 30 yrs
- 2 days/yr
Risk factors via First Street. Map © Google.
Why this score? — see what drove the D- grade
The composite is a weighted blend of 9 inputs, each scored 0–100. Each bar is that input's sub-score; the figure is the points it added to the 100-point composite (weight × sub-score).
- Cash flow +9.7/30.0
- ARV discount +7.5/15.0
- Condition / age +4.0/5.0
- Livability +3.9/5.0
- Schools +3.6/10.0
- Rent growth +3.1/5.0
- 1% rule +2.9/10.0
- DSCR +2.7/10.0
- Appreciation +0.0/10.0
$297,900
🖨 Deal sheet 📄 Offer letter ✓ Due diligence
Listing remarks
This new single-story home features three bedrooms near the front off the entry. An open-concept floorplan combining the kitchen, living and dining areas makes it easy to entertain and relax throughout the week. Nestled into a private rear corner is the luxurious owner's suite, complete with a full bathroom and walk-in closet.
Key facts
- Private rear corner
- Full bathroom
- Walk-in closet
Tags
Property features AI
Finance
- Financial info: List price $297,900
Exterior
- Parking: 2 total parking spaces; 2-car garage
- Home design: New construction plan named RC Roselyn; Active listing
Interior
- Bedrooms: 4 bedrooms
- Bathrooms: 2 full bathrooms
- Interior features: Living area approximately 1840
Neighborhood map
What this means for you Summary
Snapshot
- This is a 4-bed/2.0-bath single-family listed at $298k. Condition is rated good.
Deal economics
- At list price, monthly cash flow is $-218 ($-3k/yr) — negative.
- To cash-flow at today's rent, offer at most $296k (0.6% below list).
- To meet the 1% rule (rent ≥ 1% of price), the offer needs to be $259k (13.1% below list).
- Recommended offer: $259k (13.1% below list) — sets the bar for 1% rule.
- Cap rate 5.5% vs local median 3.4% in Edmond — top-decile yield for the area; either an underpriced asset or a hidden risk that comps aren't pricing in. Stress-test before assuming the spread holds.
Location & tenants
- Location reads 78/100 on livability (#6 in OK, #2,383 nationally) — a middle-class / working-renter tenant base. Strengths: employment A+, housing A+, schools A-; Watch: health & safety C-, commute F.
- Edmond (suburban): math 38% / reading 40% proficiency, ranked #11 of 270 in OK (top 4%) — families likely to look elsewhere, expect single-tenant / working-renter base with shorter leases.
- Market conditions: Rents rising (+2.5%/yr); 763 active listings in the ZIP; 6 comparable units currently listed for rent nearby; rentals leasing fast (median 2d on market — plan ~1-2 weeks tenant-placement turnaround); solid renter incomes; 5,365 units permitted in Oklahoma County in 2024 (569 in 5+ unit buildings).
Forward outlook
- Local home prices are declining (-3.0%/yr); year-one equity from $2k of loan paydown is wiped out by about $10k of value loss. Plan a longer hold.
- Oklahoma County population projected at +41% by 2050 — long-run rental-demand tailwind backs the buy-and-hold thesis.
Negotiation context
- It's been on market 71 days — a 6% lower offer ($280k) is reasonable based on typical stale-listing flexibility.
Risks & watch-outs
- Climate carrying-cost: extreme-heat days projected 7→19/yr by 2055 (HVAC capex compounding) — expect insurance premiums to compound above CPI over the hold.
Questions for the listing agent
- What do current leases actually rent for vs. the listed asking? Can we see a recent rent roll and the last 12 months of T-12 income?
- It's been on market 71 days. Have you received any prior offers? Is the seller open to a 13% concession, seller financing, or rate buy-down credit?
- Why hasn't it sold? Are there any deal-killer items the seller is aware of (foundation, flood, title, zoning, code violations)?
- Is there a deadline driving the sale (1031 exchange, divorce, estate, relocation)? That informs how much negotiation room exists.
- Schools are A-rated — typically a magnet for longer-tenancy family renters. What's the average tenant stay here, and is there a school-zone premium baked into asking?
- The area grade is low — what's the realistic commute time and amenity access for the typical tenant pool here? Any planned neighborhood developments (good or bad) we should know about?
- What's the average days-on-market for RENTAL listings here right now (not sales)? A rising rental-DOM trend means longer vacancies and softer asking-rent achievability than the comps imply.
- What's the recent tenant-quality profile in this submarket — average credit score on applications, eviction rate, late-payment / NSF rate, and stable-employment percentage? A property-management company in the area should have these aggregated.
- How much new for-sale + rental construction is in the pipeline within 1–3 miles? Heavy new supply typically softens prices + rents 12–24 months out; constrained supply supports both.
Investment metrics
- 1% rule
- 0.79% ✗
- Cap rate
- 5.49%
- Cash-on-cash
- -2.85%
- DSCR
- 0.87
- GRM
- 10.5
CMA / ARV
- ARV (on-the-fly)
- $327,520
- Comps found
- 12
Show comp detail 12 sales within ~0.75 mi
| Address | Dist | Beds/Ba | Sqft | Sold | Price | $/sf | Match |
|---|---|---|---|---|---|---|---|
| 6116 Western Redbud Trl | 0.28mi | 4/2.0 | 1,840 (0%) | 2mo | $299,660 | $163 | 86 |
| 6133 Western Redbud Trl | 0.29mi | 4/2.0 | 1,840 (0%) | 2mo | $289,799 | $157 | 85 |
| 6140 Western Redbud Trl | 0.30mi | 4/2.0 | 1,840 (0%) | 3mo | $296,400 | $161 | 84 |
| 6201 Western Redbud Trl | 0.36mi | 4/2.0 | 1,840 (0%) | 2mo | $297,799 | $162 | 82 |
| 2224 Los Angeles Ave | 0.45mi | 4/2.0 | 1,862 (+1%) | 0mo | $355,000 | $191 | 77 |
| 6024 Frankie Lynn Ln | 0.33mi | 4/2.0 | 1,918 (+4%) | 1mo | $399,900 | $208 | 76 |
| 1841 Black Poplar Way | 0.11mi | 4/2.0 | 1,613 (-12%) | 2mo | $284,750 | $177 | 73 |
| 6133 Frankie Lynn Ln | 0.39mi | 3/2.0 (-1) | 1,747 (-5%) | 1mo | $379,900 | $217 | 67 |
| 6109 Western Redbud Trl | 0.27mi | 4/2.0 | 1,613 (-12%) | 1mo | $287,402 | $178 | 66 |
| 6148 Western Redbud Trl | 0.31mi | 4/2.0 | 1,613 (-12%) | 2mo | $287,200 | $178 | 63 |
| 2316 Los Angeles Ave | 0.49mi | 3/2.0 (-1) | 1,923 (+4%) | 3mo | $350,000 | $182 | 63 |
| 1808 Big Tooth Aspen Trl | 0.39mi | 4/2.0 | 1,613 (-12%) | 3mo | $287,600 | $178 | 59 |
Match score weights: distance 35% · size 25% · config 20% · recency 20%. Top-matched comps best support the ARV.
Projected returns pro-forma
-3.0% appreciation · 2.49% rent growth · sell at horizon
- IRR
- -21.6%
- Equity multiple
- 0.26×
- Total profit
- $-68,234
- Equity at exit
- $48,834
- IRR
- -16.5%
- Equity multiple
- 0.10×
- Total profit
- $-82,499
- Equity at exit
- $28,318
Cash invested: $91,706 (down + closing). Projections, not guarantees.
Landlord ↔ Tenant lean methodology
- Overall (STATE)
- 83 Strongly Landlord-Friendly
- State Oklahoma
- 83 Strongly Landlord-Friendly · R+20
- County
- — inherits STATE
- City
- — inherits STATE
ZIP-level market 73034
- Rents YoY
- 2.5%
- Active inventory
- 763
- Price-to-rent
- 9.6×
Monthly cashflow live
- Estimated rent
- $2,589 high interval (Pro) →
- Mortgage (P&I)
- −$1,718
- Tax est. 1.5%
- −$409 /mo · $4,913/yr
- Insurance
- −$136
- HOA
- −$0
- Vacancy / Maint / Mgmt
- −$544
- Net cashflow
- $-218
Break-even live
UW: 25.0% down · 7.5% · 30yr · 1.5% tax · 5.0% vac · 8.0% maint · 8.0% mgmt
Financing live
Cash to close
- Down payment
- $81,880
- Closing costs
- $9,826
- Reserves months
- —
- Total cash needed
- —
Loan-product check · same deal, 3 products live
Conventional
25% down · 7.5% · 30yr
- Down + closing
- —
- Monthly P&I
- —
- Monthly cashflow
- —
- DSCR
- —
- Eligible?
- —
Personal DTI + credit; lowest rate.
DSCR
20% down · 8.5% · 30yr
- Down + closing
- —
- Monthly P&I
- —
- Monthly cashflow
- —
- DSCR
- —
- Eligible?
- —
No personal income docs; deal must DSCR.
Hard money
10% down · 12.0% · 12mo
- Down + closing
- —
- Monthly P&I
- —
- Monthly cashflow
- —
- DSCR
- —
- Eligible?
- —
Short-term bridge; refi at stabilization.
Rent comps 6 comps
| Address | Beds | Baths | Sqft | Rent | $/sqft | DOM | Units | Dist |
|---|---|---|---|---|---|---|---|---|
| 6024 Frankie Lynn Ln Edmond, OK | 4.0 | 2.0 | 1918 | $2,800 | $1.46 | 23d | 1 | 0.31mi |
| 6016 Kinnick Dr Edmond, OK | 4.0 | 2.0 | 2003 | $2,900 | $1.45 | 11d | 1 | 0.31mi |
| 6309 Frankie Lynn Ln Edmond, OK | 3.0 | 2.0 | 1690 | $2,450 | $1.45 | 1d | 1 | 0.45mi |
| 6133 Oxnard St Edmond, OK | 3.0 | 2.0 | 1809 | $2,595 | $1.43 | 1d | 1 | 0.58mi |
| 4909 October Dr Edmond, OK | 4.0 | 3.0 | 2203 | $2,600 | $1.18 | 1d | 1 | 0.88mi |
| 3100 N Sooner Rd Edmond, OK | 2.0–3.0 | 2.0–3.0 | 1348 | $3,375 | $2.50 | 1d | 38 | 1.20mi |
Listing history 12 events
-
2026-06-18days on market $297,900 Active 71 DOM
-
2026-06-17days on market $297,900 Active 70 DOM
-
2026-06-16days on market $297,900 Active 69 DOM
-
2026-06-15days on market $297,900 Active 68 DOM
-
2026-06-13days on market $297,900 Active 66 DOM
-
2026-06-09days on market $297,900 Active 62 DOM
-
2026-06-08days on market $297,900 Active 61 DOM
-
2026-06-07days on market $297,900 Active 60 DOM
-
2026-06-03days on market $297,900 Active 56 DOM
-
2026-06-02days on market $297,900 Active 55 DOM
-
2026-06-01days on market $297,900 Active 54 DOM
-
2026-05-31days on market $297,900 Active 53 DOM
ⓘ Source: listings_history table (triggers on properties + properties_extension) + one-shot
backfill from property_details.listing_events for pre-trigger history.
Climate risk First Street
- Flood 1/10 Low FEMA zone X (unshaded) · 0% chance over 30 yrs
- Wildfire 4/10 Moderate
- Heat 5/10 Major 7 d/yr ≥108°F today · 19 d/yr by 30 yrs out
- Wind 3/10 Moderate 5% chance of damaging wind over 30 yrs
- Air quality 2/10 Low 2 unhealthy d/yr today · 2 by 30 yrs out
Nearby sold comps map
Loading sold comps map…
Walkable amenities ~0.75 mi
Loading nearby amenities…
Taxation est. · year 1
- Rental income
- $31,071
- − Mortgage interest
- −$18,346
- − Property taxes
- −$4,913
- − Insurance
- −$1,638
- − Repairs & maintenance
- −$2,486
- − Management
- −$2,486
- − Depreciation
- −$9,528
- Taxable loss
- −$8,325
- Est. tax savings @ 24.0%
- +$1,998
- After-tax cash flow
- $-617/yr
For passive investors: Depreciation is non-cash, so a rental often shows a tax loss while cash-flowing — sheltering income. Rental losses are passive: they offset passive income freely, and up to $25,000/yr can offset ordinary (W-2) income if you actively participate and your MAGI is under $100k (phasing out to $0 by $150k); unused losses carry forward. On sale, claimed depreciation is recaptured at up to 25%, and gains may owe capital-gains tax (a 1031 exchange can defer both). Figures are a year-1 estimate at your 24.0% rate — not tax advice; consult a CPA.
Condition & rehab AI · 12 photos
This single-story home is in good condition with a modern and well-maintained interior and exterior. It features an open-concept floor plan and a luxurious owner's suite. The property is move-in ready with minor maintenance items to address.
Value-add opportunities
- Resale Paint exterior trim — Enhances curb appeal
- Resale Replace light fixtures — Modernizes and improves lighting
- Both Install smart home devices — Improves convenience and energy efficiency
Renovation cost estimate screening
Value-add ROI direction
- Resale Paint exterior trim — Enhances curb appeal ↑
- Resale Replace light fixtures — Modernizes and improves lighting ↑
- Both Install smart home devices — Improves convenience and energy efficiency ↑
ⓘ Cost ranges are severity-bucket heuristics (US national rule-of-thumb). Get contractor quotes + a written scope before underwriting a rehab budget.
Schools (NCES district)
- District
- Edmond
- NCES district ID
- 4010590
- Math proficiency
- 38% ▼ -12.00%
- Reading proficiency
- 40% ▼ -12.00%
- Median HH income
- $73,212
- Composite
- 35.88/100
- National rank
- #4814
- State rank
- #11 of 270 in OK
Livability — Edmond
- Score
- 78/100
- State rank
- #6
- US rank
- #2383
Category grades
Schools grade is shown separately in the Schools card above.
Census & demographics
- Census place
- Edmond, OK
- County
- Oklahoma County · 771,644 people
- City population
- 177,083
- Metro
- Oklahoma City, OK
- Population (ZIP)
- 48,831
- Household income
- $109,700
- Rent vs Own
- Severe rent burden
- 1198.0
Population outlook (Oklahoma County) Hauer SSP2
- Today (2025)
- 911,875 people
- By 2030
- 982,413 · +7.7%
- By 2040
- 1,130,468 · +24.0%
- By 2050
- 1,288,422 · +41.3%
- By 2075
- 1,711,482 · +87.7%
- By 2100
- 2,088,448 · +129.0%
Race, ethnicity, and origin ACS 2023
- Neighborhood character
- Predominantly White (76%)
- Race & ethnicity
- White 76% Two or more races 10% Hispanic / Latino 8% Asian 4% Black 3% Native American 3%
- Hispanic origin (detail)
- Mexican 4%
- Common ancestry
- Italian 4% Slovak 3% Lithuanian 3%
- Foreign-born
- 6% · Canada, China, Vietnam
- Languages at home
- 92% English-only · Spanish 4% Other Indo-European 1% Chinese 1%
Political lean MEDSL · Oklahoma
- 2024 margin
- Toss-up / Even · D 48.0% · R 49.7% · Other 2.3%
- 2008→2024 swing
- +15.1pp toward D · 2008: -16.8pp · 2024: -1.7pp
- All cycles
- 2024: R+1.7 2020: R+1.1 2016: R+10.5 2012: R+16.7 2008: R+16.8
Not yet ingested
- Civics
- —
Market trends
- HPI YoY
- ▼ -164.67%
- Current HPI
- 223.1391
- Rent YoY
- ▲ 2.49%
- Metro
- Oklahoma City, OK
- State GDP YoY
- ▲ 1.55%
- F500 in state
- 6
Industry mix (Fortune 500 HQ in OK)
| Industry | F500 HQs | Revenue |
|---|---|---|
| Energy | 3 | $48B |
|
||
Cash-flow waterfall
monthlySold comps — $/sqft
last 12 mo · ≤1 miLoading sold comps…