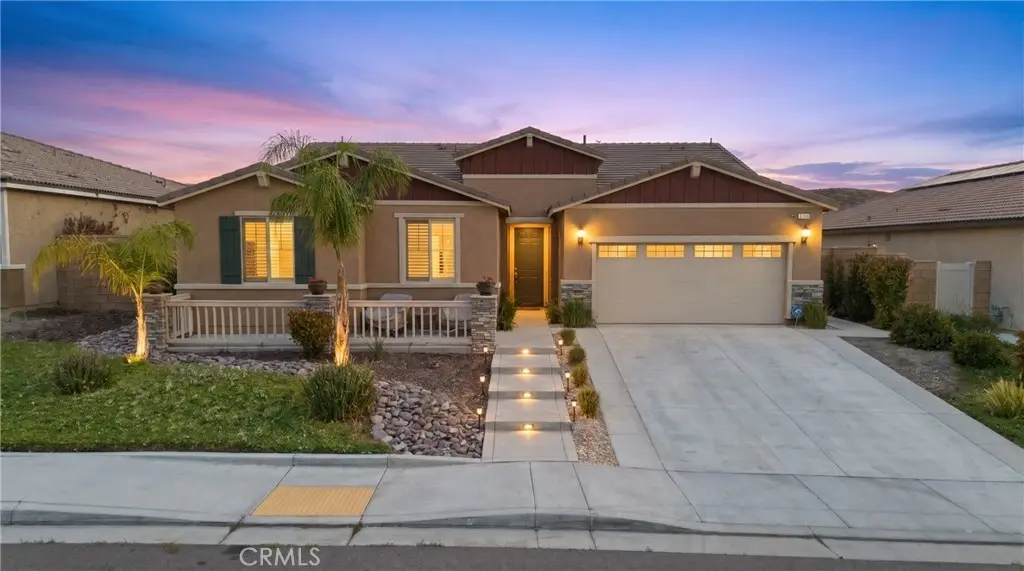
35111 Tavel · French Valley, CA
Flood risk 1/10 · Minimal
- FEMA flood zone
- D
- Chance of flooding over 30 yrs
- 0.0%
- Est. flood insurance / yr
- $544 – $1,084
Fire risk 5/10 · Moderate
- Est. fire insurance / yr
- $659 – $1,223
Heat risk 7/10 · Major
- Hot days now (above 104°F)
- 7 days/yr
- Hot days in 30 yrs
- 22 days/yr
Wind risk 1/10 · Minimal
- Chance of severe wind over 30 yrs
- —
Air-quality risk 4/10 · Minor
- Unhealthy air days now
- 6 days/yr
- Unhealthy air days in 30 yrs
- 7 days/yr
Risk factors via First Street. Map © Google.
Why this score? — see what drove the D- grade
The composite is a weighted blend of 9 inputs, each scored 0–100. Each bar is that input's sub-score; the figure is the points it added to the 100-point composite (weight × sub-score).
- Appreciation +10.0/10.0
- ARV discount +6.0/15.0
- Cash flow +5.8/30.0
- Schools +5.7/10.0
- Livability +3.0/5.0
- Condition / age +2.5/5.0
- Rent growth +2.3/5.0
- 1% rule +1.1/10.0
- DSCR +0.2/10.0
$749,999
🖨 Deal sheet (PDF) 📄 Offer letter ✓ Due diligence
Listing remarks
NEXT GEN DREAM HOME! Rarely do homes offer the flexibility, privacy, and income potential of this stunning single-story Next Gen residence in the highly sought-after community of Winchester. Featuring a private attached casita with its own separate entrance, this home is perfect for multi-generational living, parents, adult children, guests, or potential rental income opportunities. Boasting approximately 2,641 square feet of beautifully upgraded living space, this exceptional home offers 5 bedrooms, 3 bathrooms, and a versatile den/home office that can easily function as a 6th bedroom. The open-concept design is centered around a chef-inspired kitchen featuring luxury countertops, upgraded
Key facts
- Separate entrance
- Covered patio
- 7,405 sq ft lot
Tags
Property features AI
Exterior
- Parking: Attached garage with 3 garage spaces (3 total parking spaces)
- Utilities: Public sewer; District/public water
- Home design: Single-story house; Entry at main level
- Construction: Year built per builder source
- Exterior features: House with attached guest house (guest house attached); No pool; Lot in 0-1 unit per acre density; Has view; Curbs and biking-friendly community
Interior
- Kitchen: Walk-in pantry
- Bedrooms: Six bedrooms (including main-floor primary and additional primary suite options)
- Bathrooms: Three full bathrooms
- Heating & cooling: Central heating (central furnace); Central cooling
- Interior features: One-level home; Main-level primary bedroom; Multiple primary suites (two primaries); Main-level bedrooms (all bedrooms down); Formal entry; Great room / separate family room; Living room and family room; Walk-in pantry; Walk-in closet; Loft; Bonus room; Den / office; Media / game room; Gym; Art studio; Guest/maid's quarters; Entry; Primary suite and primary bathroom
- Laundry & utility: Laundry room inside the home
Neighborhood map
What this means for you Summary
Snapshot
- This is a 5-bed/3.0-bath single-family listed at $750k.
Deal economics
- At list price, monthly cash flow is $-1k ($-18k/yr) — negative.
- To cash-flow at today's rent, offer at most $488k (35.0% below list).
- To meet the 1% rule (rent ≥ 1% of price), the offer needs to be $457k (39.1% below list).
- Recommended offer: $457k (39.1% below list) — sets the bar for 1% rule.
Location & tenants
- Location reads 59/100 on livability (#655 in CA) — a working-class tenant base; expect higher turnover. Strengths: employment A+, housing A+; Watch: crime D-, amenities F, commute F.
- Temecula Valley Unified (urban): math 55% / reading 69% proficiency, ranked #173 of 1,400 in CA (top 12%) — acceptable for families but not a draw, mixed tenant base, ~2y average lease; only 17% free/reduced lunch — higher-income household profile.
- Zoned schools: French Valley Elementary (880 students, 24% FRL); Bella Vista Middle (1,396 students, 26% FRL); Chaparral High (3,030 students, 27% FRL).
- Market conditions: Rents soft (-0.8%/yr); 353 active listings in the ZIP; 5 comparable units currently listed for rent nearby; rentals lingering (median 46d on market — plan ~5-8 weeks vacancy on turnover, expect pricing pressure); 80% of comp listings sitting > 30 days — soft ceiling on asking rent; high-income renter base; 9,195 units permitted in Riverside County in 2024 (1,512 in 5+ unit buildings).
- This rent runs 41% of the median local income ($133k/yr) — at the standard rent-burdened threshold; future hikes will face affordability resistance.
Forward outlook
- In year one you build about $80k of equity ($5k loan paydown + $75k appreciation (10.0% local appreciation)).
- Riverside County population projected at +22% by 2050 — long-run rental-demand tailwind backs the buy-and-hold thesis.
- By year 2, paydown + projected appreciation supports a ~$129k cash-out refi (75% LTV) — recoverable capital for the next deal without selling this one.
Negotiation context
- Only 3 days on market — expect competitive offers; lowballing is unlikely to land.
Risks & watch-outs
- Climate carrying-cost: moderate wildfire risk; extreme-heat days projected 7→22/yr by 2055 (HVAC capex compounding) — expect insurance premiums to compound above CPI over the hold.
Questions for the listing agent
- What do current leases actually rent for vs. the listed asking? Can we see a recent rent roll and the last 12 months of T-12 income?
- Is there a deadline driving the sale (1031 exchange, divorce, estate, relocation)? That informs how much negotiation room exists.
- Schools are D-rated, which usually means shorter tenancies and higher turnover. Who's the typical renter profile here, and what's been the actual vacancy rate?
- Crime grade is D in this area — have there been break-ins, vandalism, or insurance claims at this property in the last 3 years? What carrier currently insures it and at what premium?
- The area grade is low — what's the realistic commute time and amenity access for the typical tenant pool here? Any planned neighborhood developments (good or bad) we should know about?
- What's the average days-on-market for RENTAL listings here right now (not sales)? A rising rental-DOM trend means longer vacancies and softer asking-rent achievability than the comps imply.
- What's the recent tenant-quality profile in this submarket — average credit score on applications, eviction rate, late-payment / NSF rate, and stable-employment percentage? A property-management company in the area should have these aggregated.
- How much new for-sale + rental construction is in the pipeline within 1–3 miles? Heavy new supply typically softens prices + rents 12–24 months out; constrained supply supports both.
Investment metrics
- 1% rule
- 0.61% ✗
- Cap rate
- 3.92%
- Cash-on-cash
- -8.49%
- DSCR
- 0.62
- GRM
- 13.7
CMA / ARV
- ARV (on-the-fly)
- $726,275
- Comps found
- 12
Show comp detail 12 sales within ~0.75 mi
| Address | Dist | Beds/Ba | Sqft | Sold | Price | $/sf | Match |
|---|---|---|---|---|---|---|---|
| 33041 Cuvee Ct | 0.09mi | 4/4.0 (-1) | 2,641 (0%) | 3mo | $826,000 | $313 | 84 |
| 33413 Rusty Ct | 0.52mi | 5/3.0 | 2,709 (+3%) | 1mo | $731,135 | $270 | 70 |
| 33436 Rusty Ct | 0.56mi | 5/3.0 | 2,709 (+3%) | 1mo | $771,420 | $285 | 69 |
| 33305 Rusty Ct | 0.51mi | 4/3.0 (-1) | 2,429 (-8%) | 2mo | $659,000 | $271 | 56 |
| 33315 Celadon Ave | 0.56mi | 4/3.0 (-1) | 2,429 (-8%) | 3mo | $685,000 | $282 | 53 |
| 34609 Clementine St | 0.61mi | 4/3.0 (-1) | 2,421 (-8%) | 0mo | $629,990 | $260 | 52 |
| 33425 Rusty Ct | 0.51mi | 5/3.0 | 3,008 (+14%) | 1mo | $826,640 | $275 | 52 |
| 33185 Rusty Ct | 0.59mi | 4/3.0 (-1) | 2,421 (-8%) | 3mo | $610,000 | $252 | 51 |
| 34438 Coconut Cir | 0.70mi | 4/3.0 (-1) | 2,466 (-7%) | 1mo | $690,000 | $280 | 50 |
| 33238 Damask Ln | 0.74mi | 4/3.0 (-1) | 2,466 (-7%) | 2mo | $643,230 | $261 | 48 |
| 32743 Cherokee Rose | 0.60mi | 4/2.5 (-1) | 2,909 (+10%) | 0mo | $910,000 | $313 | 48 |
| 35211 Lantern Lgt | 0.71mi | 4/2.5 (-1) | 2,909 (+10%) | 4mo | $774,999 | $266 | 40 |
Match score weights: distance 35% · size 25% · config 20% · recency 20%. Top-matched comps best support the ARV.
Projected returns pro-forma
10.0% appreciation · 0.0% rent growth · sell at horizon
- IRR
- 17.6%
- Equity multiple
- 2.43×
- Total profit
- $300,501
- Equity at exit
- $675,659
- IRR
- 16.1%
- Equity multiple
- 5.45×
- Total profit
- $935,390
- Equity at exit
- $1,457,083
Cash invested: $210,000 (down + closing). Projections, not guarantees.
Landlord ↔ Tenant lean methodology
- Overall (STATE)
- 18 Strongly Tenant-Friendly
- State California
- 18 Strongly Tenant-Friendly · D+13
- County
- — inherits STATE
- City
- — inherits STATE
ZIP-level market 92596
- Home prices YoY
- 3.9%
- Rents YoY
- -0.8%
- Active inventory
- 353
- Price-to-rent
- 13.7×
Monthly cashflow live
- Estimated rent
- $4,565 high interval (Pro) →
- Mortgage (P&I)
- −$3,933
- Tax from tax record
- −$846 /mo · $10,155/yr
- Insurance
- −$312
- HOA
- −$0
- Vacancy / Maint / Mgmt
- −$959
- Net cashflow
- $-1,485
Break-even live
Sensitivity live
| Price | -10% $-1,061 | -5% $-1,273 | +0% $-1,485 | +5% $-1,698 | +10% $-1,910 |
|---|---|---|---|---|---|
| Rent | -10% $-1,846 | -5% $-1,666 | +0% $-1,485 | +5% $-1,305 | +10% $-1,125 |
| Rate | -1.0pp $-1,108 | -0.5pp $-1,295 | base $-1,485 | +0.5pp $-1,680 | +1.0pp $-1,877 |
UW: 25.0% down · 7.5% · 30yr · 1.5% tax · 5.0% vac · 8.0% maint · 8.0% mgmt
Financing live
Cash to close
- Down payment
- $187,500
- Closing costs
- $22,500
- Reserves months
- —
- Total cash needed
- —
Loan-product check · same deal, 3 products live
Conventional
25% down · 7.5% · 30yr
- Down + closing
- —
- Monthly P&I
- —
- Monthly cashflow
- —
- DSCR
- —
- Eligible?
- —
Personal DTI + credit; lowest rate.
DSCR
20% down · 8.5% · 30yr
- Down + closing
- —
- Monthly P&I
- —
- Monthly cashflow
- —
- DSCR
- —
- Eligible?
- —
No personal income docs; deal must DSCR.
Hard money
10% down · 12.0% · 12mo
- Down + closing
- —
- Monthly P&I
- —
- Monthly cashflow
- —
- DSCR
- —
- Eligible?
- —
Short-term bridge; refi at stabilization.
Rent comps 5 comps
| Address | Beds | Baths | Sqft | Rent | $/sqft | DOM | Units | Dist |
|---|---|---|---|---|---|---|---|---|
| 33014 Marin Fields Rd Winchester, CA | 4.0 | 2.0 | 1779 | $3,795 | $2.13 | 45d | 1 | 0.60mi |
| 32689 Cottonwood Rd Winchester, CA | 4.0 | 2.5 | 3157 | $4,100 | $1.30 | 45d | 1 | 0.62mi |
| 34580 Sourwood Way Winchester, CA | 4.0 | 3.0 | 2800 | $3,200 | $1.14 | 45d | 1 | 0.93mi |
| 36173 Saint Claire Ct Winchester, CA | 6.0 | 3.5 | 2905 | $6,000 | $2.07 | 45d | 1 | 1.01mi |
| 32907 Cambury Pl Winchester, CA | 5.0 | 4.0 | 2641 | $3,795 | $1.44 | 0d | 1 | 1.02mi |
Listing history 3 events
-
2026-06-21days on market $749,999 Active 3 DOM
-
2026-06-18remarks 699-char remark
-
2026-06-18$749,999 Active 1 DOM
ⓘ Source: listings_history table (triggers on properties + properties_extension) + one-shot
backfill from property_details.listing_events for pre-trigger history.
Tax reassessment forecast CA · Resets to sale price
- Current annual tax
- $10,155 · $846/mo
- Projected year-2 tax
- $10,155 · $846/mo
- Expected delta
- $0/yr ($0/mo · 0.0%)
ⓘ Screening estimate from a state-policy table — verify with the county assessor before closing.
Climate risk First Street
- Flood 1/10 Low FEMA zone D · 0% chance over 30 yrs
- Wildfire 5/10 Major
- Heat 7/10 Severe 7 d/yr ≥104°F today · 22 d/yr by 30 yrs out
- Wind 1/10 Low
- Air quality 4/10 Moderate 6 unhealthy d/yr today · 7 by 30 yrs out
Nearby sold comps map
Loading sold comps map…
Walkable amenities ~0.75 mi
Loading nearby amenities…
Taxation est. · year 1
- Rental income
- $54,782
- − Mortgage interest
- −$42,012
- − Property taxes
- −$10,155
- − Insurance
- −$3,750
- − Repairs & maintenance
- −$4,383
- − Management
- −$4,383
- − Depreciation
- −$21,818
- Taxable loss
- −$31,718
- Est. tax savings @ 24.0%
- +$7,612
- After-tax cash flow
- $-10,212/yr
For passive investors: Depreciation is non-cash, so a rental often shows a tax loss while cash-flowing — sheltering income. Rental losses are passive: they offset passive income freely, and up to $25,000/yr can offset ordinary (W-2) income if you actively participate and your MAGI is under $100k (phasing out to $0 by $150k); unused losses carry forward. On sale, claimed depreciation is recaptured at up to 25%, and gains may owe capital-gains tax (a 1031 exchange can defer both). Figures are a year-1 estimate at your 24.0% rate — not tax advice; consult a CPA.
Schools (NCES district)
- District
- Temecula Valley Unified
- NCES district ID
- 0600028
- Math proficiency
- 55% ▲ 1.00%
- Reading proficiency
- 69% ▲ 1.00%
- Median HH income
- $84,032
- Composite
- 57.48/100
- National rank
- #2264
- State rank
- #173 of 1400 in CA
Livability — French Valley
- Score
- 59/100
- State rank
- #655
- US rank
- #20351
Category grades
Schools grade is shown separately in the Schools card above.
Census & demographics
- Census place
- French Valley, CA
- County
- Riverside County · 2,287,001 people
- Metro
- Riverside-San Bernardino-Ontario, CA
- Population (ZIP)
- 38,981
- Household income
- $132,538
- Rent vs Own
- Severe rent burden
- 591.0
Population outlook (Riverside County) Hauer SSP2
- Today (2025)
- 2,664,475 people
- By 2030
- 2,802,692 · +5.2%
- By 2040
- 3,050,904 · +14.5%
- By 2050
- 3,256,783 · +22.2%
- By 2075
- 3,655,058 · +37.2%
- By 2100
- 3,766,594 · +41.4%
Race, ethnicity, and origin ACS 2023
- Neighborhood character
- Highly diverse neighborhood (Simpson 0.72)
- Race & ethnicity
- White 38% Hispanic / Latino 34% Two or more races 16% Asian 12% Black 6% Pacific Islander 2%
- Hispanic origin (detail)
- Mexican 29%
- Common ancestry
- Slovak 3% Italian 2% Portuguese 1%
- Foreign-born
- 14% · Canada, Vietnam
- Languages at home
- 76% English-only · Spanish 16% Tagalog/Filipino 4% Vietnamese 1%
Political lean MEDSL · Riverside
- 2024 margin
- Toss-up / Even · D 48.0% · R 49.3% · Other 2.6%
- 2008→2024 swing
- -3.6pp toward R · 2008: 2.3pp · 2024: -1.3pp
- All cycles
- 2024: R+1.3 2020: D+8.0 2016: D+4.3 2012: R+0.4 2008: D+2.3
Not yet ingested
- Civics
- —
Market trends
- HPI YoY
- ▲ 12.43%
- Current HPI
- 332.169
- Rent YoY
- ▼ -0.79%
- Metro
- Riverside-San Bernardino-Ontario, CA
- State GDP YoY
- ▲ 3.21%
- F500 in state
- 116
Industry mix (Fortune 500 HQ in CA)
| Industry | F500 HQs | Revenue |
|---|---|---|
| Technology | 27 | $1,492B |
|
||
| Financial Services | 3 | $174B |
|
||
| Retail | 3 | $44B |
|
||
| Insurance | 3 | $26B |
|
||
| Media / Entertainment | 2 | $115B |
|
||
| Pharmaceuticals / Biotech | 2 | $62B |
|
||
Price history
1 event — show timeline
- 2026-06-18 Listed $749,999 CRMLS
Property tax history
+67.0%/yrLatest (2025): $10,155 · +1.0% YoY. Source: county tax records.
Cash-flow waterfall
monthlySold comps — $/sqft
last 12 mo · ≤1 miLoading sold comps…