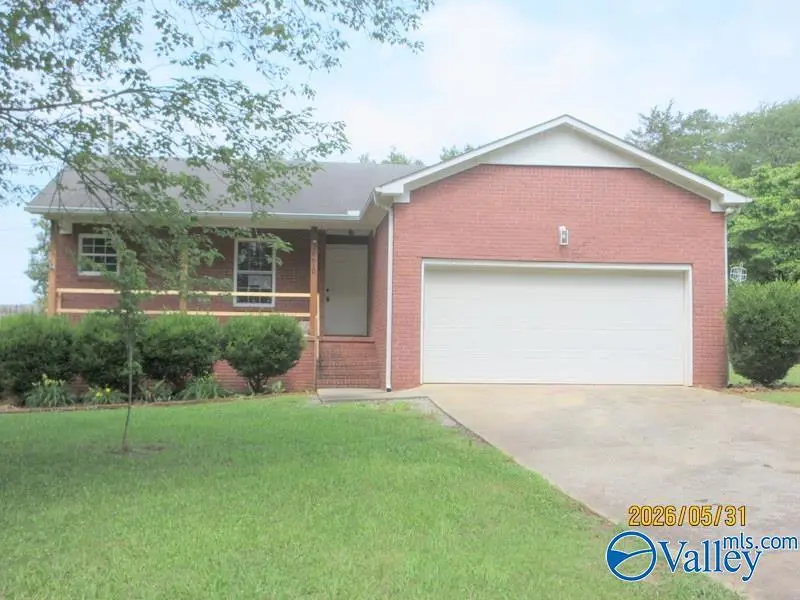
26619 Cedar Break Trl · Huntsville, AL
Flood risk 1/10 · Minimal
- FEMA flood zone
- X (unshaded)
- Chance of flooding over 30 yrs
- 0.0%
- Est. flood insurance / yr
- $507 – $1,088
Fire risk 3/10 · Minor
- Est. fire insurance / yr
- $916 – $1,700
Heat risk 5/10 · Moderate
- Hot days now (above 105°F)
- 7 days/yr
- Hot days in 30 yrs
- 19 days/yr
Wind risk 4/10 · Minor
- Chance of severe wind over 30 yrs
- 19.0%
Air-quality risk 2/10 · Minimal
- Unhealthy air days now
- 1 days/yr
- Unhealthy air days in 30 yrs
- 1 days/yr
Risk factors via First Street. Map © Google.
Why this score? — see what drove the B grade
The composite is a weighted blend of 9 inputs, each scored 0–100. Each bar is that input's sub-score; the figure is the points it added to the 100-point composite (weight × sub-score).
- Cash flow +30.0/30.0
- ARV discount +15.0/15.0
- DSCR +10.0/10.0
- 1% rule +7.6/10.0
- Livability +4.1/5.0
- Rent growth +2.8/5.0
- Schools +2.8/10.0
- Condition / age +2.5/5.0
- Appreciation +0.0/10.0
$144,000
🖨 Deal sheet 📄 Offer letter ✓ Due diligence
Listing remarks MLS
You'll appreciate the feeling of rural living with the convenience of a suburb. This beautiful 3 bed, 2 bath, full brick home sits on .5 acres. The open floor plan is perfect for entertaining with space for everyone. Enjoy the privacy-fenced back yard with outdoor fire pit and swing. Attached 2 car garage boasts tall ceilings with plenty of room for storage on the wooden garage shelves. This home is a must see and won't last long! Don't miss your opportunity.
Key facts
- Tall ceilings
- Outdoor fire pit
- Room for gardening
Tags
Property features AI
Finance
- HOA & community: No homeowners association; Subdivision: Redstone Acres
Exterior
- Parking: Attached two-car garage that faces the front
- Utilities: Public water; Public sewer
- Home design: Single-family residence; One story; Built in 1999; Residential property; Brick construction
- Construction: Brick exterior; Built in 1999
- Exterior features: Covered porch
Interior
- Kitchen: Range; Dishwasher
- Bathrooms: Two full bathrooms
- Heating & cooling: Central air conditioning; Central heating with wall furnace (natural gas)
- Interior features: Six total rooms; Crawl space foundation
Neighborhood map
What this means for you Summary
Snapshot
- This is a 3-bed/1.0-bath single-family listed at $144k.
Deal economics
- At list price, monthly cash flow is $538 ($6k/yr) — positive.
- The deal already cash-flows at list — no discount required.
- Meets the 1% rule at list price ($2k rent vs $144k).
- Cap rate 10.8% vs local median 3.8% in Huntsville — top-decile yield for the area; either an underpriced asset or a hidden risk that comps aren't pricing in. Stress-test before assuming the spread holds.
Location & tenants
- Location reads 82/100 on livability (#3 in AL, #1,082 nationally) — a professional / high-income tenant draw. Strengths: commute A+, cost of living A+, housing A+; Watch: crime F.
- Limestone County (rural): math 21% / reading 44% proficiency, ranked #52 of 129 in AL (top 40%) — families likely to look elsewhere, expect single-tenant / working-renter base with shorter leases.
- Zoned schools: Creekside Elementary School (math 42% / reading 66%, grade C, #96 of 627 statewide, top 16%, 560 students, 41% FRL); East Limestone High School (math 21% / reading 43%, grade F, #59 of 305 statewide, top 21%, 1,282 students, 40% FRL) — zoned schools at 40% FRL track the district average.
- Market conditions: Rents rising (+1.1%/yr); 823 active listings in the ZIP; 1 comparable units currently listed for rent nearby; high-income renter base; 494 units permitted in Limestone County in 2024 (0 in 5+ unit buildings).
- This rent is only 17% of the median local income ($130k/yr) — well below the 30% rent-burden line; pricing power to push rent on renewal without tenant pushback.
Forward outlook
- Local home prices are declining (-3.0%/yr); year-one equity from $996 of loan paydown is wiped out by about $4k of value loss. Plan a longer hold.
- Limestone County population projected at +43% by 2050 — long-run rental-demand tailwind backs the buy-and-hold thesis.
- At projected returns (-3.0% appreciation + 1.1% rent growth), your $40k cash investment doubles in ~9 years — after that, you're playing with house money.
Negotiation context
- Only 14 days on market — expect competitive offers; lowballing is unlikely to land.
- 2 sale attempts since 4y ago with the ask held roughly flat each time — persistent listings suggest the price (not the market) is what's stuck; bring a comps-based counter.
Risks & watch-outs
- Climate carrying-cost: extreme-heat days projected 7→19/yr by 2055 (HVAC capex compounding) — expect insurance premiums to compound above CPI over the hold.
Questions for the listing agent
- Is there a deadline driving the sale (1031 exchange, divorce, estate, relocation)? That informs how much negotiation room exists.
- Crime grade is F in this area — have there been break-ins, vandalism, or insurance claims at this property in the last 3 years? What carrier currently insures it and at what premium?
- What's the average days-on-market for RENTAL listings here right now (not sales)? A rising rental-DOM trend means longer vacancies and softer asking-rent achievability than the comps imply.
- What's the recent tenant-quality profile in this submarket — average credit score on applications, eviction rate, late-payment / NSF rate, and stable-employment percentage? A property-management company in the area should have these aggregated.
- How much new for-sale + rental construction is in the pipeline within 1–3 miles? Heavy new supply typically softens prices + rents 12–24 months out; constrained supply supports both.
Investment metrics
- 1% rule
- 1.26% ✓
- Cap rate
- 10.77%
- Cash-on-cash
- 16.01%
- DSCR
- 1.71
- GRM
- 6.6
CMA / ARV
- ARV (on-the-fly)
- $249,054
- Comps found
- 1
Show comp detail 1 sale within ~0.75 mi
| Address | Dist | Beds/Ba | Sqft | Sold | Price | $/sf | Match |
|---|---|---|---|---|---|---|---|
| 26705 Martin Branch Rd | 0.16mi | 3/2.0 | 1,261 (+4%) | 23mo | $260,000 | $206 | 62 |
Match score weights: distance 35% · size 25% · config 20% · recency 20%. Top-matched comps best support the ARV.
Projected returns pro-forma
-3.0% appreciation · 1.15% rent growth · sell at horizon
- IRR
- 4.9%
- Equity multiple
- 1.19×
- Total profit
- $7,570
- Equity at exit
- $21,471
- IRR
- 12.7%
- Equity multiple
- 1.93×
- Total profit
- $37,459
- Equity at exit
- $12,450
Cash invested: $40,320 (down + closing). Projections, not guarantees.
Landlord ↔ Tenant lean methodology
- Overall (STATE)
- 90 Strongly Landlord-Friendly
- State Alabama
- 90 Strongly Landlord-Friendly · R+15
- County
- — inherits STATE
- City
- — inherits STATE
ZIP-level market 35756
- Home prices YoY
- -21.7%
- Rents YoY
- 1.1%
- Active inventory
- 823
- Price-to-rent
- 6.6×
Monthly cashflow live
- Estimated rent
- $1,812 medium interval (Pro) →
- Mortgage (P&I)
- −$755
- Tax from tax record
- −$79 /mo · $945/yr
- Insurance
- −$60
- HOA
- −$0
- Vacancy / Maint / Mgmt
- −$381
- Net cashflow
- $538
Break-even live
UW: 25.0% down · 7.5% · 30yr · 1.5% tax · 5.0% vac · 8.0% maint · 8.0% mgmt
Financing live
Cash to close
- Down payment
- $36,000
- Closing costs
- $4,320
- Reserves months
- —
- Total cash needed
- —
Loan-product check · same deal, 3 products live
Conventional
25% down · 7.5% · 30yr
- Down + closing
- —
- Monthly P&I
- —
- Monthly cashflow
- —
- DSCR
- —
- Eligible?
- —
Personal DTI + credit; lowest rate.
DSCR
20% down · 8.5% · 30yr
- Down + closing
- —
- Monthly P&I
- —
- Monthly cashflow
- —
- DSCR
- —
- Eligible?
- —
No personal income docs; deal must DSCR.
Hard money
10% down · 12.0% · 12mo
- Down + closing
- —
- Monthly P&I
- —
- Monthly cashflow
- —
- DSCR
- —
- Eligible?
- —
Short-term bridge; refi at stabilization.
Rent comps 1 comps
| Address | Beds | Baths | Sqft | Rent | $/sqft | DOM | Units | Dist |
|---|---|---|---|---|---|---|---|---|
| 26760 Newby Rd Unit 3A Athens, AL | 2.0 | 2.0 | 1050 | $1,350 | $1.29 | 13d | 1 | 0.57mi |
Listing history 11 events
-
2026-06-15status $144,000 Pending 14 DOM
-
2026-06-15days on market $144,000 Active 14 DOM
-
2026-06-14days on market $144,000 Active 12 DOM
-
2026-06-10days on market $144,000 Active 9 DOM
-
2026-06-09days on market $144,000 Active 8 DOM
-
2026-06-08days on market $144,000 Active 7 DOM
-
2026-06-07days on market $144,000 Active 6 DOM
-
2026-06-05days on market $144,000 Active 3 DOM
-
2026-06-03days on market $144,000 Active 2 DOM
-
2026-06-02remarks 488-char remark
-
2026-06-02$144,000 Active 1 DOM
ⓘ Source: listings_history table (triggers on properties + properties_extension) + one-shot
backfill from property_details.listing_events for pre-trigger history.
Tax reassessment forecast AL · Resets to sale price
- Current annual tax
- $945 · $79/mo
- Projected year-2 tax
- $945 · $79/mo
- Expected delta
- $0/yr ($0/mo · 0.0%)
ⓘ Screening estimate from a state-policy table — verify with the county assessor before closing.
Climate risk First Street
- Flood 1/10 Low FEMA zone X (unshaded) · 0% chance over 30 yrs
- Wildfire 3/10 Moderate
- Heat 5/10 Major 7 d/yr ≥105°F today · 19 d/yr by 30 yrs out
- Wind 4/10 Moderate 19% chance of damaging wind over 30 yrs
- Air quality 2/10 Low 1 unhealthy d/yr today · 1 by 30 yrs out
Nearby sold comps map
Loading sold comps map…
Walkable amenities ~0.75 mi
Loading nearby amenities…
Taxation est. · year 1
- Rental income
- $21,747
- − Mortgage interest
- −$8,066
- − Property taxes
- −$945
- − Insurance
- −$720
- − Repairs & maintenance
- −$1,740
- − Management
- −$1,740
- − Depreciation
- −$4,189
- Taxable income
- $4,347
- Est. tax owed @ 24.0%
- −$1,043
- After-tax cash flow
- $5,410/yr
For passive investors: Depreciation is non-cash, so a rental often shows a tax loss while cash-flowing — sheltering income. Rental losses are passive: they offset passive income freely, and up to $25,000/yr can offset ordinary (W-2) income if you actively participate and your MAGI is under $100k (phasing out to $0 by $150k); unused losses carry forward. On sale, claimed depreciation is recaptured at up to 25%, and gains may owe capital-gains tax (a 1031 exchange can defer both). Figures are a year-1 estimate at your 24.0% rate — not tax advice; consult a CPA.
Schools (NCES district)
- District
- Limestone County
- NCES district ID
- 0102100
- Math proficiency
- 21% ▼ -23.00%
- Reading proficiency
- 44% ▼ -3.00%
- Median HH income
- $48,972
- Composite
- 28.09/100
- National rank
- #6829
- State rank
- #52 of 129 in AL
Livability — Huntsville
- Score
- 82/100
- State rank
- #3
- US rank
- #1082
Category grades
Schools grade is shown separately in the Schools card above.
Census & demographics
- County
- Limestone County · 80,439 people
- City population
- 220,435
- Metro
- Huntsville, AL
- Population (ZIP)
- 24,947
- Household income
- $129,852
- Rent vs Own
- Severe rent burden
- 286.0
Population outlook (Limestone County) Hauer SSP2
- Today (2025)
- 111,441 people
- By 2030
- 121,272 · +8.8%
- By 2040
- 140,705 · +26.3%
- By 2050
- 159,069 · +42.7%
- By 2075
- 202,231 · +81.5%
- By 2100
- 230,608 · +106.9%
Race, ethnicity, and origin ACS 2023
- Neighborhood character
- Diverse neighborhood (Simpson 0.59)
- Race & ethnicity
- White 59% Black 21% Two or more races 9% Hispanic / Latino 7% Asian 6% Native American 1%
- Hispanic origin (detail)
- Mexican 1% Puerto Rican 2%
- Common ancestry
- Italian 3% Serbian 3% Slovak 3%
- Foreign-born
- 8% · China, South Korea, Canada
- Languages at home
- 90% English-only · Spanish 3% Korean 2% Other Indo-European 2%
Political lean MEDSL · Limestone
- 2024 margin
- Solid R (+43.9) · D 27.5% · R 71.4% · Other 1.2%
- 2008→2024 swing
- -2.0pp toward R · 2008: -41.9pp · 2024: -43.9pp
- All cycles
- 2024: R+43.9 2020: R+42.6 2016: R+49.5 2012: R+43.6 2008: R+41.9
Not yet ingested
- Civics
- —
Market trends
- HPI YoY
- ▼ -50.15%
- Current HPI
- 180.5285
- Rent YoY
- ▲ 1.15%
- Metro
- Huntsville, AL
- State GDP YoY
- ▲ 2.94%
- F500 in state
- 4
Industry mix (Fortune 500 HQ in AL)
| Industry | F500 HQs | Revenue |
|---|---|---|
| Financial Services | 1 | $8B |
|
||
| Healthcare | 1 | $5B |
|
||
Price history
+39.6% since first listed6 events — show timeline
- 2026-06-01 Listed $144,000 VMLS
- 2022-04-22 Sold (Public Records) $220,000 Public Records
- 2022-04-14 Sold (MLS) $220,000 VMLS
- 2022-03-13 Pending — VMLS
- 2022-03-10 Listed $189,000 VMLS
- 2017-08-30 Sold (Public Records) $103,134 Public Records
Property tax history
+10.7%/yrLatest (2025): $945 · +1.7% YoY. Source: county tax records.
Cash-flow waterfall
monthlySold comps — $/sqft
last 12 mo · ≤1 miLoading sold comps…