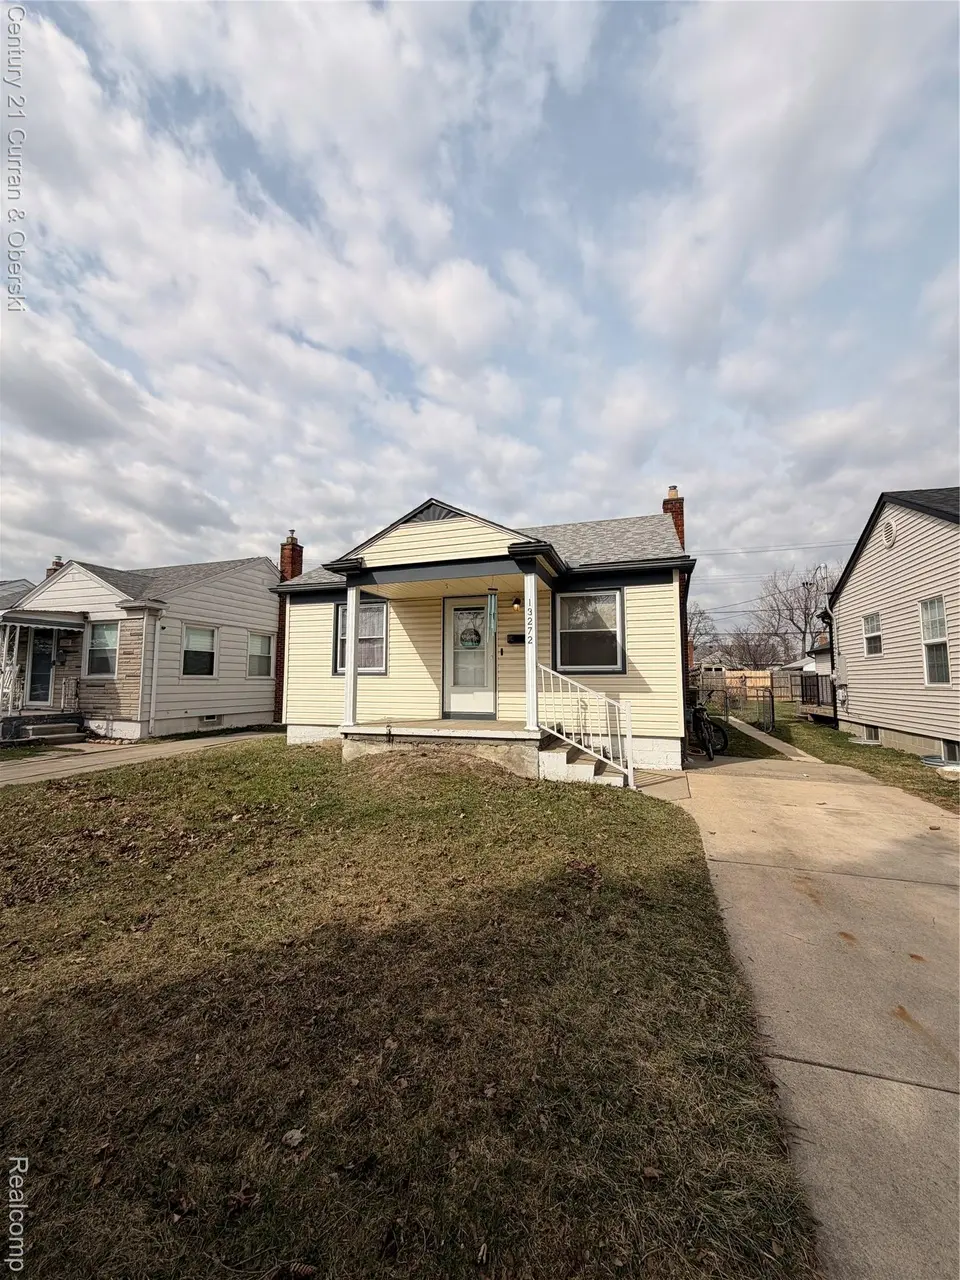
13272 Pullman St · Southgate, MI
Flood risk 1/10 · Minimal
- FEMA flood zone
- X (unshaded)
- Chance of flooding over 30 yrs
- 0.0%
- Est. flood insurance / yr
- $473 – $860
Fire risk 1/10 · Minimal
- Est. fire insurance / yr
- $784 – $1,456
Heat risk 3/10 · Minor
- Hot days now (above 96°F)
- 7 days/yr
- Hot days in 30 yrs
- 15 days/yr
Wind risk 2/10 · Minimal
- Chance of severe wind over 30 yrs
- —
Air-quality risk 3/10 · Minor
- Unhealthy air days now
- 3 days/yr
- Unhealthy air days in 30 yrs
- 5 days/yr
Risk factors via First Street. Map © Google.
Why this score? — see what drove the D+ grade
The composite is a weighted blend of 9 inputs, each scored 0–100. Each bar is that input's sub-score; the figure is the points it added to the 100-point composite (weight × sub-score).
- Cash flow +15.3/30.0
- ARV discount +10.7/15.0
- 1% rule +5.1/10.0
- DSCR +4.7/10.0
- Livability +4.2/5.0
- Rent growth +3.5/5.0
- Schools +2.5/10.0
- Condition / age +2.5/5.0
- Appreciation +0.0/10.0
$145,000
🖨 Deal sheet 📄 Offer letter ✓ Due diligence
Key facts
- 4,356 sq ft lot
- Built 1947
- Listed 52 days
Neighborhood map
What this means for you Summary
Snapshot
- This is a 3-bed/1.0-bath single-family listed at $145k.
Deal economics
- At list price, monthly cash flow is $52 ($625/yr) — positive.
- The deal already cash-flows at list — no discount required.
- Meets the 1% rule at list price ($1k rent vs $145k).
- Recommended offer: $141k (3.0% below list) — sets the bar for market timing.
- Cap rate 6.7% vs local median 5.2% in Southgate — meaningfully above typical; check what's discounted (condition, days-on-market, listing class) to confirm the premium yield is real.
Location & tenants
- Location reads 85/100 on livability (#29 in MI, #582 nationally) — a professional / high-income tenant draw. Strengths: amenities A+, commute A+, cost of living A+; Watch: schools D, crime D-.
- Southgate Community School District (suburban): math 21% / reading 36% proficiency, ranked #379 of 540 in MI (top 70%) — low school quality limits family demand, transient renter base, plan for 1-2y turnover.
- Market conditions: Rents rising fast (+4.0%/yr); 115 active listings in the ZIP; 5 comparable units currently listed for rent nearby; rentals leasing fast (median 2d on market — plan ~1-2 weeks tenant-placement turnaround); 2,639 units permitted in Wayne County in 2024 (1,216 in 5+ unit buildings).
Forward outlook
- Local home prices are declining (-3.0%/yr); year-one equity from $1k of loan paydown is wiped out by about $4k of value loss. Plan a longer hold.
- Wayne County population projected at -17% by 2050 — secular population decline; favor cash flow + early exit over multi-decade hold.
Negotiation context
- It's been on market 52 days — a 3% lower offer ($141k) is reasonable based on typical stale-listing flexibility.
- 20 sale attempts since 28y ago with the ask held roughly flat each time — persistent listings suggest the price (not the market) is what's stuck; bring a comps-based counter.
- Current owner paid $123k; 18% above their basis — modest negotiation headroom, anchor on the comps not their cost.
Risks & watch-outs
- Watch-outs: built in 1947 — expect roof / HVAC / electrical / plumbing capex.
Questions for the listing agent
- It's been on market 52 days. Have you received any prior offers? Is the seller open to a 3% concession, seller financing, or rate buy-down credit?
- Built in 1947 — when were the roof, HVAC, electrical panel, plumbing, and water heater last replaced?
- Is there a deadline driving the sale (1031 exchange, divorce, estate, relocation)? That informs how much negotiation room exists.
- Schools are D-rated, which usually means shorter tenancies and higher turnover. Who's the typical renter profile here, and what's been the actual vacancy rate?
- Crime grade is D in this area — have there been break-ins, vandalism, or insurance claims at this property in the last 3 years? What carrier currently insures it and at what premium?
- The area grade is low — what's the realistic commute time and amenity access for the typical tenant pool here? Any planned neighborhood developments (good or bad) we should know about?
- What's the average days-on-market for RENTAL listings here right now (not sales)? A rising rental-DOM trend means longer vacancies and softer asking-rent achievability than the comps imply.
- What's the recent tenant-quality profile in this submarket — average credit score on applications, eviction rate, late-payment / NSF rate, and stable-employment percentage? A property-management company in the area should have these aggregated.
- How much new for-sale + rental construction is in the pipeline within 1–3 miles? Heavy new supply typically softens prices + rents 12–24 months out; constrained supply supports both.
Investment metrics
- 1% rule
- 1.01% ✓
- Cap rate
- 6.72%
- Cash-on-cash
- 1.54%
- DSCR
- 1.07
- GRM
- 8.2
CMA / ARV
- ARV (median comp)
- $156,127
- List price
- $145,000
- Delta
- -7.13%
- Verdict
- FAIR
- Comps
- 20 within 1.0 mi
Show comp detail 12 sales within ~0.75 mi
| Address | Dist | Beds/Ba | Sqft | Sold | Price | $/sf | Match |
|---|---|---|---|---|---|---|---|
| 13044 Cunningham St | 0.14mi | 2/1.0 (-1) | 708 (0%) | 9mo | $155,000 | $219 | 81 |
| 13741 Callender St | 0.32mi | 2/1.0 (-1) | 708 (0%) | 2mo | $188,700 | $267 | 78 |
| 13261 Ward St | 0.25mi | 2/1.0 (-1) | 729 (+3%) | 1mo | $165,000 | $226 | 77 |
| 13020 Castle St | 0.19mi | 2/1.0 (-1) | 708 (0%) | 12mo | $150,000 | $212 | 76 |
| 12783 Jobin St | 0.36mi | 2/1.0 (-1) | 700 (-1%) | 5mo | $164,900 | $236 | 72 |
| 13680 Agnes St | 0.57mi | 2/1.0 (-1) | 725 (+2%) | 3mo | $140,000 | $193 | 62 |
| 12173 Pearl St | 0.73mi | 2/1.0 (-1) | 708 (0%) | 4mo | $153,000 | $216 | 58 |
| 13632 Pearl St | 0.60mi | 2/1.0 (-1) | 725 (+2%) | 7mo | $135,000 | $186 | 57 |
| 13084 Fordline St | 0.72mi | 2/1.0 (-1) | 740 (+4%) | 6mo | $180,000 | $243 | 49 |
| 13199 Irene St | 0.58mi | 2/1.0 (-1) | 772 (+9%) | 8mo | $99,000 | $128 | 46 |
| 14056 Irene St | 0.74mi | 2/1.0 (-1) | 768 (+8%) | 2mo | $120,000 | $156 | 45 |
| 13186 Irene St | 0.60mi | 2/1.0 (-1) | 772 (+9%) | 12mo | $90,000 | $117 | 42 |
Match score weights: distance 35% · size 25% · config 20% · recency 20%. Top-matched comps best support the ARV.
Projected returns pro-forma
-3.0% appreciation · 4.04% rent growth · sell at horizon
- IRR
- -12.5%
- Equity multiple
- 0.54×
- Total profit
- $-18,538
- Equity at exit
- $21,620
- IRR
- -1.7%
- Equity multiple
- 0.88×
- Total profit
- $-5,005
- Equity at exit
- $12,537
Cash invested: $40,600 (down + closing). Projections, not guarantees.
Landlord ↔ Tenant lean methodology
- Overall (STATE)
- 62 Landlord-Friendly
- State Michigan
- 62 Landlord-Friendly · EVEN
- County
- — inherits STATE
- City
- — inherits STATE
ZIP-level market 48195
- Rents YoY
- 4.0%
- Active inventory
- 115
- Price-to-rent
- 8.2×
Monthly cashflow live
- Estimated rent
- $1,469 high interval (Pro) →
- Mortgage (P&I)
- −$760
- Tax from tax record
- −$288 /mo · $3,453/yr
- Insurance
- −$60
- HOA
- −$0
- Vacancy / Maint / Mgmt
- −$309
- Net cashflow
- $52
Break-even live
UW: 25.0% down · 7.5% · 30yr · 1.5% tax · 5.0% vac · 8.0% maint · 8.0% mgmt
Financing live
Cash to close
- Down payment
- $36,250
- Closing costs
- $4,350
- Reserves months
- —
- Total cash needed
- —
Loan-product check · same deal, 3 products live
Conventional
25% down · 7.5% · 30yr
- Down + closing
- —
- Monthly P&I
- —
- Monthly cashflow
- —
- DSCR
- —
- Eligible?
- —
Personal DTI + credit; lowest rate.
DSCR
20% down · 8.5% · 30yr
- Down + closing
- —
- Monthly P&I
- —
- Monthly cashflow
- —
- DSCR
- —
- Eligible?
- —
No personal income docs; deal must DSCR.
Hard money
10% down · 12.0% · 12mo
- Down + closing
- —
- Monthly P&I
- —
- Monthly cashflow
- —
- DSCR
- —
- Eligible?
- —
Short-term bridge; refi at stabilization.
Rent comps 5 comps
| Address | Beds | Baths | Sqft | Rent | $/sqft | DOM | Units | Dist |
|---|---|---|---|---|---|---|---|---|
| 1750 Saint Johns Blvd Unit 17 Lincoln Park, MI | 2.0 | 1.0 | 750 | $1,025 | $1.37 | 24d | 1 | 0.95mi |
| 1760 Saint Johns Blvd Apt 14 Lincoln Park, MI | 2.0 | 1.0 | 750 | $995 | $1.33 | 24d | 1 | 0.96mi |
| 13750 Village Green Blvd Southgate, MI | 1.0–2.0 | 1.0 | 862 | $1,625 | $1.88 | 1d | 9 | 1.26mi |
| 13210 Village Park Dr Southgate, MI | 2.0 | 1.0 | 630 | $1,125 | $1.78 | 1d | 9 | 1.33mi |
| 13861 Strathcona St Southgate, MI | 1.0–2.0 | 1.0–1.5 | 797 | $1,140 | $1.43 | 1d | 5 | 1.47mi |
Listing history 45 events
-
2026-05-13status Pending
-
2026-05-13status Pending
-
2026-04-28status Active
-
2026-04-27historical
-
2026-03-21$145,000 Active
-
2026-03-21$145,000 Active
-
2021-06-28soldstatus $123,000
-
2021-06-24soldstatus $123,000 Sold
-
2021-06-24soldstatus $123,000 Closed
-
2021-05-09status Pending
-
2021-05-09status Pending
-
2021-05-04status Active
-
2021-05-04status Active
-
2021-04-27status Pending
-
2021-04-27status Pending
-
2021-04-25price $125,000
-
2021-04-25price $125,000
-
2021-04-16$135,000 Active
-
2021-04-16$135,000 Active
-
2009-02-27soldstatus $19,950
-
2008-01-31$29,000
-
2006-08-01historical
-
2006-08-01historical
-
2006-08-01soldstatus $925
-
2006-05-01$124,900
-
2006-05-01$124,900
-
2006-04-28$850
-
2005-06-28historical
-
2005-06-28historical
-
2005-05-02$129,900
-
2005-05-02$129,900
-
2005-04-19soldstatus $78,000
-
2005-01-07$81,900
-
2004-06-30historical
-
2004-01-12$104,000
-
2004-01-12$104,000
-
2002-05-20historical
-
2002-02-21$106,500
-
2002-02-21$106,500
-
1999-02-05soldstatus $89,900
-
1998-09-25soldstatus $89,900
-
1998-09-25soldstatus $89,900
-
1998-08-22$89,900
-
1998-08-22$89,900
-
1995-10-27soldstatus $21,000
ⓘ Source: listings_history table (triggers on properties + properties_extension) + one-shot
backfill from property_details.listing_events for pre-trigger history.
Tax reassessment forecast MI · Partial reset (capped growth)
- Current annual tax
- $3,453 · $288/mo
- Projected year-2 tax
- $3,453 · $288/mo
- Expected delta
- $0/yr ($0/mo · 0.0%)
ⓘ Screening estimate from a state-policy table — verify with the county assessor before closing.
Climate risk First Street
- Flood 1/10 Low FEMA zone X (unshaded) · 0% chance over 30 yrs
- Wildfire 1/10 Low
- Heat 3/10 Moderate 7 d/yr ≥96°F today · 15 d/yr by 30 yrs out
- Wind 2/10 Low
- Air quality 3/10 Moderate 3 unhealthy d/yr today · 5 by 30 yrs out
Nearby sold comps map
Loading sold comps map…
Walkable amenities ~0.75 mi
Loading nearby amenities…
Taxation est. · year 1
- Rental income
- $17,630
- − Mortgage interest
- −$8,122
- − Property taxes
- −$3,453
- − Insurance
- −$725
- − Repairs & maintenance
- −$1,410
- − Management
- −$1,410
- − Depreciation
- −$4,218
- Taxable loss
- −$1,709
- Est. tax savings @ 24.0%
- +$410
- After-tax cash flow
- $1,035/yr
For passive investors: Depreciation is non-cash, so a rental often shows a tax loss while cash-flowing — sheltering income. Rental losses are passive: they offset passive income freely, and up to $25,000/yr can offset ordinary (W-2) income if you actively participate and your MAGI is under $100k (phasing out to $0 by $150k); unused losses carry forward. On sale, claimed depreciation is recaptured at up to 25%, and gains may owe capital-gains tax (a 1031 exchange can defer both). Figures are a year-1 estimate at your 24.0% rate — not tax advice; consult a CPA.
Schools (NCES district)
- District
- Southgate Community School District
- NCES district ID
- 2632340
- Math proficiency
- 21% ▼ -8.00%
- Reading proficiency
- 36% ▬ 0.00%
- Median HH income
- $49,234
- Composite
- 24.83/100
- National rank
- #7591
- State rank
- #379 of 540 in MI
Livability — Southgate
- Score
- 85/100
- State rank
- #29
- US rank
- #582
Category grades
Schools grade is shown separately in the Schools card above.
Census & demographics
- Census place
- Southgate, MI
- County
- Wayne County · 1,562,939 people
- City population
- 29,366
- Metro
- Detroit-Warren-Dearborn, MI
- Population (ZIP)
- 29,366
- Household income
- $66,118
- Rent vs Own
- Severe rent burden
- 727.0
Population outlook (Wayne County) Hauer SSP2
- Today (2025)
- 1,675,273 people
- By 2030
- 1,620,300 · -3.3%
- By 2040
- 1,502,341 · -10.3%
- By 2050
- 1,384,039 · -17.4%
- By 2075
- 1,124,592 · -32.9%
- By 2100
- 881,193 · -47.4%
Race, ethnicity, and origin ACS 2023
- Neighborhood character
- Predominantly White (75%)
- Race & ethnicity
- White 75% Hispanic / Latino 11% Black 8% Two or more races 8% Asian 3%
- Hispanic origin (detail)
- Mexican 8% Puerto Rican 1%
- Common ancestry
- Romanian 9% Lithuanian 3% Slovak 3%
- Foreign-born
- 6% · Canada, China
- Languages at home
- 90% English-only · Other Indo-European 4% Spanish 3% Other Asian/Pacific 1%
Political lean MEDSL · Wayne
- 2024 margin
- Strong D (+29.0) · D 62.7% · R 33.7% · Other 3.6%
- 2008→2024 swing
- -20.5pp toward R · 2008: 49.5pp · 2024: 29.0pp
- All cycles
- 2024: D+29.0 2020: D+38.1 2016: D+37.3 2012: D+46.9 2008: D+49.5
Not yet ingested
- Civics
- —
Market trends
- HPI YoY
- ▼ -187.28%
- Current HPI
- 207.9776
- Rent YoY
- ▲ 4.04%
- Metro
- Detroit-Warren-Dearborn, MI
- State GDP YoY
- ▲ 1.37%
- F500 in state
- 28
Industry mix (Fortune 500 HQ in MI)
| Industry | F500 HQs | Revenue |
|---|---|---|
| Automotive Parts | 3 | $48B |
|
||
| Automotive | 2 | $372B |
|
||
| Chemicals | 1 | $45B |
|
||
| Automotive Retail | 1 | $29B |
|
||
| Healthcare / Medical Devices | 1 | $23B |
|
||
| Automotive Technology | 1 | $20B |
|
||
Price history
+590.5% since first listed45 events — show timeline
- 2026-05-13 Pending — MiRealSource-MiMLS
- 2026-05-13 Pending — REALCOMP
- 2026-04-28 Relisted — REALCOMP
- 2026-04-27 Listing Removed — REALCOMP
- 2026-03-21 Listed $145,000 REALCOMP
- 2026-03-21 Listed $145,000 MiRealSource-MiMLS
- 2021-06-28 Sold (Public Records) $123,000 Public Records
- 2021-06-24 Sold (MLS) $123,000 MiRealSource-MiMLS
- 2021-06-24 Sold (MLS) $123,000 REALCOMP
- 2021-05-09 Pending — MiRealSource-MiMLS
- 2021-05-09 Pending — REALCOMP
- 2021-05-04 Relisted — MiRealSource-MiMLS
- 2021-05-04 Relisted — REALCOMP
- 2021-04-27 Pending — MiRealSource-MiMLS
- 2021-04-27 Pending — REALCOMP
- 2021-04-25 Price Changed $125,000 MiRealSource-MiMLS
- 2021-04-25 Price Changed $125,000 REALCOMP
- 2021-04-16 Listed $135,000 MiRealSource-MiMLS
- 2021-04-16 Listed $135,000 REALCOMP
- 2009-02-27 Sold (MLS) $19,950 REALCOMP
- 2008-01-31 Listed $29,000 REALCOMP
- 2006-08-01 Sold (MLS) $925 REALCOMP
- 2006-08-01 Listing Removed — MiRealSource-MiMLS
- 2006-08-01 Listing Removed — REALCOMP
- 2006-05-01 Listed $124,900 MiRealSource-MiMLS
- 2006-05-01 Listed $124,900 REALCOMP
- 2006-04-28 Listed $850 REALCOMP
- 2005-06-28 Listing Removed — REALCOMP
- 2005-06-28 Listing Removed — MiRealSource-MiMLS
- 2005-05-02 Listed $129,900 REALCOMP
- 2005-05-02 Listed $129,900 MiRealSource-MiMLS
- 2005-04-19 Sold (MLS) $78,000 REALCOMP
- 2005-01-07 Listed $81,900 REALCOMP
- 2004-06-30 Listing Removed — MiRealSource-MiMLS
- 2004-01-12 Listed $104,000 REALCOMP
- 2004-01-12 Listed $104,000 MiRealSource-MiMLS
- 2002-05-20 Listing Removed — MiRealSource-MiMLS
- 2002-02-21 Listed $106,500 REALCOMP
- 2002-02-21 Listed $106,500 MiRealSource-MiMLS
- 1999-02-05 Sold (Public Records) $89,900 Public Records
- 1998-09-25 Sold (MLS) $89,900 REALCOMP
- 1998-09-25 Sold (MLS) $89,900 MiRealSource-MiMLS
- 1998-08-22 Listed $89,900 REALCOMP
- 1998-08-22 Listed $89,900 MiRealSource-MiMLS
- 1995-10-27 Sold (Public Records) $21,000 Public Records
Property tax history
+7.3%/yrLatest (2025): $3,453 · -1.9% YoY. Source: county tax records.
Cash-flow waterfall
monthlySold comps — $/sqft
last 12 mo · ≤1 miLoading sold comps…