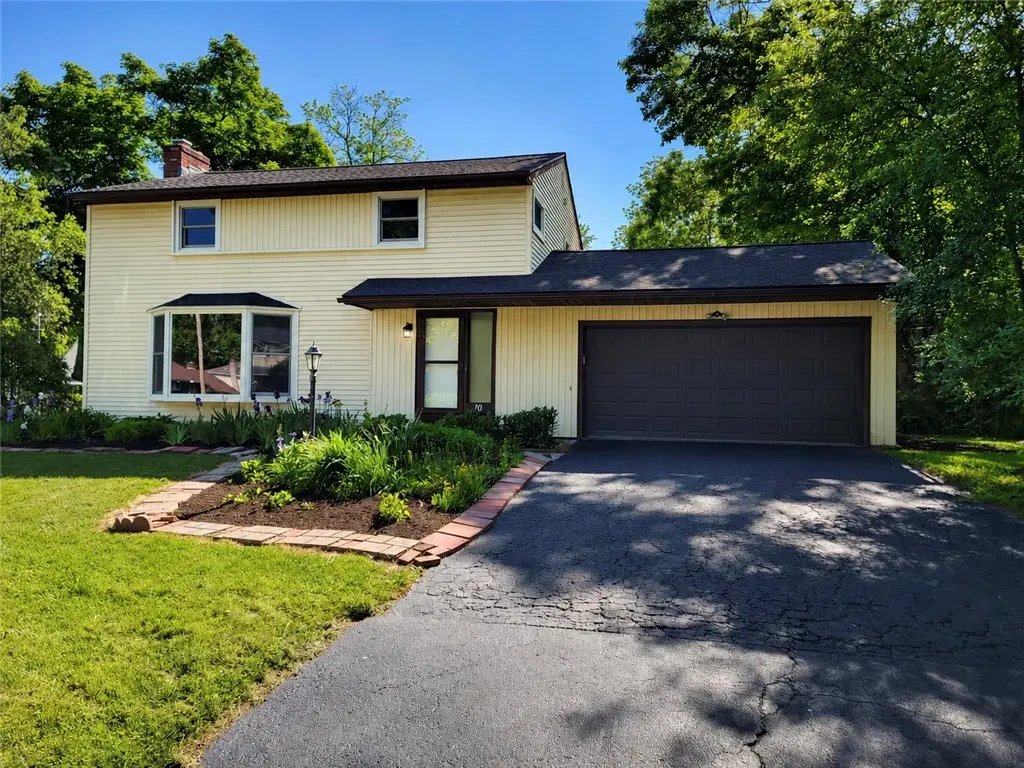
10 Blossom Cir W · Brighton, NY
Flood risk 1/10 · Minimal
- FEMA flood zone
- X (unshaded)
- Chance of flooding over 30 yrs
- 0.0%
- Est. flood insurance / yr
- $473 – $860
Fire risk 2/10 · Minimal
- Est. fire insurance / yr
- $691 – $1,283
Heat risk 2/10 · Minimal
- Hot days now (above 95°F)
- 7 days/yr
- Hot days in 30 yrs
- 16 days/yr
Wind risk 1/10 · Minimal
- Chance of severe wind over 30 yrs
- —
Air-quality risk 2/10 · Minimal
- Unhealthy air days now
- 1 days/yr
- Unhealthy air days in 30 yrs
- 2 days/yr
Risk factors via First Street. Map © Google.
Why this score? — see what drove the C grade
The composite is a weighted blend of 9 inputs, each scored 0–100. Each bar is that input's sub-score; the figure is the points it added to the 100-point composite (weight × sub-score).
- Cash flow +15.4/30.0
- ARV discount +15.0/15.0
- Schools +6.8/10.0
- 1% rule +5.3/10.0
- DSCR +4.7/10.0
- Livability +4.0/5.0
- Rent growth +3.2/5.0
- Condition / age +2.5/5.0
- Appreciation +0.0/10.0
$249,900
🖨 Deal sheet 📄 Offer letter ✓ Due diligence
Listing remarks
Welcome home to this beautiful move-in ready 3 bed 1.5 bath home! This home boasts a freshly painted interior and hardwood floors throughout. Huge light filled living room with gorgeous bay window looks out on the mature front gardens. Generous sized bedrooms and updated main bath make this an easy choice. Spacious freshly painted basement with glass block windows leaves room to expand! Many mechanical updates to include new tear off roof in 2020, new furnace and a/c in 2017. This location is truly amazing and convenient. Close to expressways, but far enough away that you don't hear them. Walkable to Mercy High School in one direction and Ellison Park in the other direction. Don't let this
Key facts
- Gorgeous bay window
- New tear off roof
- Updated main bath
Tags
Property features AI
Finance
- HOA & community: Trails/paths in the community
Exterior
- Parking: Attached garage with automatic garage door opener; Driveway; Approximately 2.5 garage spaces
- Utilities: Public water connected; Sewer connected; High-speed internet available; Cable available; Circuit breaker electrical
- Home design: Two-story existing home; Block foundation; Asphalt architectural shingle roof; Vinyl siding; Copper plumbing
- Construction: Built (existing); Block foundation; Vinyl siding construction; Asphalt architectural shingle roof
- Exterior features: Covered porch; Blacktop driveway; Rectangular residential lot (approx. 49 x 125)
Interior
- Kitchen: Electric cooktop; Dishwasher; Refrigerator; Pantry
- Bedrooms: Total of 6 rooms including living and family areas
- Flooring: Hardwood; Ceramic tile; Laminate; Tile
- Bathrooms: 1 full bathroom; 1 half bathroom; One main-level bathroom
- Heating & cooling: Gas forced air heating; Central air conditioning
- Interior features: Separate formal dining room; Separate formal living room; Combined living/dining area; Pantry; Thermal windows; Full basement with sump pump; One fireplace
- Laundry & utility: Washer and dryer located in the basement; Gas water heater
Neighborhood map
What this means for you Summary
Snapshot
- This is a 3-bed/1.5-bath single-family listed at $250k.
Deal economics
- At list price, monthly cash flow is $94 ($1k/yr) — positive.
- The deal already cash-flows at list — no discount required.
- Meets the 1% rule at list price ($3k rent vs $250k).
- Cap rate 6.7% vs local median 3.9% in Brighton — top-decile yield for the area; either an underpriced asset or a hidden risk that comps aren't pricing in. Stress-test before assuming the spread holds.
Location & tenants
- Location reads 81/100 on livability (#89 in NY, #1,379 nationally) — a professional / high-income tenant draw. Strengths: housing A+, health & safety A+, schools B+; Watch: crime D+, amenities D-.
- Penfield Central School District (suburban): math 77% / reading 79% proficiency, ranked #67 of 590 in NY (top 11%) — strong family-tenant draw, lease renewals of 3-5y typical; only 11% free/reduced lunch — higher-income household profile.
- Market conditions: Rents rising (+2.7%/yr); 85 active listings in the ZIP; 4 comparable units currently listed for rent nearby; rentals leasing fast (median 3d on market — plan ~1-2 weeks tenant-placement turnaround); solid renter incomes; 1,169 units permitted in Monroe County in 2024 (591 in 5+ unit buildings).
- This rent runs 36% of the median local income ($86k/yr) — at the standard rent-burdened threshold; future hikes will face affordability resistance.
Forward outlook
- Local home prices are declining (-3.0%/yr); year-one equity from $2k of loan paydown is wiped out by about $7k of value loss. Plan a longer hold.
- Monroe County population projected to shrink 6% by 2050 — rents likely to lag national; underwrite the cash flow, not the appreciation.
Negotiation context
- Only 9 days on market — expect competitive offers; lowballing is unlikely to land.
- Current owner paid $87k; list at $250k implies a 187% gain — meaningful room to come down on a strong offer.
Risks & watch-outs
- Watch-outs: property tax is 2.5% of price; built in 1955 — expect roof / HVAC / electrical / plumbing capex.
Questions for the listing agent
- Built in 1955 — when were the roof, HVAC, electrical panel, plumbing, and water heater last replaced?
- Property tax is high relative to price — has the assessment been appealed recently, and will the sale trigger a re-assessment?
- Is there a deadline driving the sale (1031 exchange, divorce, estate, relocation)? That informs how much negotiation room exists.
- Schools are B-rated — typically a magnet for longer-tenancy family renters. What's the average tenant stay here, and is there a school-zone premium baked into asking?
- Crime grade is D in this area — have there been break-ins, vandalism, or insurance claims at this property in the last 3 years? What carrier currently insures it and at what premium?
- What's the average days-on-market for RENTAL listings here right now (not sales)? A rising rental-DOM trend means longer vacancies and softer asking-rent achievability than the comps imply.
- What's the recent tenant-quality profile in this submarket — average credit score on applications, eviction rate, late-payment / NSF rate, and stable-employment percentage? A property-management company in the area should have these aggregated.
- How much new for-sale + rental construction is in the pipeline within 1–3 miles? Heavy new supply typically softens prices + rents 12–24 months out; constrained supply supports both.
Investment metrics
- 1% rule
- 1.03% ✓
- Cap rate
- 6.74%
- Cash-on-cash
- 1.61%
- DSCR
- 1.07
- GRM
- 8.1
CMA / ARV
- ARV (on-the-fly)
- $305,664
- Comps found
- 12
Show comp detail 12 sales within ~0.75 mi
| Address | Dist | Beds/Ba | Sqft | Sold | Price | $/sf | Match |
|---|---|---|---|---|---|---|---|
| 1712 Blossom Rd | 0.10mi | 2/2.0 (-1) | 1,521 (-1%) | 0mo | $320,000 | $210 | 86 |
| 437 Landing Rd N | 0.13mi | 3/1.0 | 1,498 (-2%) | 2mo | $315,000 | $210 | 86 |
| 1736 Blossom Rd | 0.13mi | 3/1.5 | 1,484 (-3%) | 6mo | $225,000 | $152 | 83 |
| 39 Wendover Rd | 0.10mi | 3/2.0 | 1,660 (+8%) | 4mo | $330,000 | $199 | 77 |
| 30 Klink Rd Rd | 0.34mi | 3/2.0 | 1,479 (-4%) | 2mo | $363,303 | $246 | 74 |
| 44 Dorking Rd | 0.49mi | 3/1.0 | 1,516 (-1%) | 4mo | $300,000 | $198 | 70 |
| 290 Clover St | 0.28mi | 3/3.0 | 1,456 (-5%) | 5mo | $325,000 | $223 | 68 |
| 222 Shaftsbury Rd | 0.35mi | 3/2.0 | 1,448 (-6%) | 8mo | $315,000 | $218 | 65 |
| 112 Dorking Rd | 0.47mi | 3/1.5 | 1,676 (+9%) | 5mo | $270,000 | $161 | 59 |
| 140 Dorking Rd | 0.47mi | 3/2.0 | 1,434 (-7%) | 8mo | $285,000 | $199 | 58 |
| 19 Campden Way | 0.53mi | 3/2.0 | 1,650 (+7%) | 5mo | $270,000 | $164 | 57 |
| 153 Fairhaven Rd | 0.49mi | 4/1.5 (+1) | 1,676 (+9%) | 6mo | $240,000 | $143 | 52 |
Match score weights: distance 35% · size 25% · config 20% · recency 20%. Top-matched comps best support the ARV.
Projected returns pro-forma
-3.0% appreciation · 2.72% rent growth · sell at horizon
- IRR
- -14.0%
- Equity multiple
- 0.50×
- Total profit
- $-35,072
- Equity at exit
- $37,261
- IRR
- -5.6%
- Equity multiple
- 0.64×
- Total profit
- $-25,103
- Equity at exit
- $21,607
Cash invested: $69,972 (down + closing). Projections, not guarantees.
Landlord ↔ Tenant lean methodology
- Overall (STATE)
- 15 Strongly Tenant-Friendly
- State New York
- 15 Strongly Tenant-Friendly · D+10
- County
- — inherits STATE
- City
- — inherits STATE
ZIP-level market 14610
- Home prices YoY
- -23.6%
- Rents YoY
- 2.7%
- Active inventory
- 85
- Price-to-rent
- 8.1×
Monthly cashflow live
- Estimated rent
- $2,581 medium interval (Pro) →
- Mortgage (P&I)
- −$1,311
- Tax from tax record
- −$531 /mo · $6,367/yr
- Insurance
- −$104
- HOA
- −$0
- Vacancy / Maint / Mgmt
- −$542
- Net cashflow
- $94
Break-even live
UW: 25.0% down · 7.5% · 30yr · 1.5% tax · 5.0% vac · 8.0% maint · 8.0% mgmt
Financing live
Cash to close
- Down payment
- $62,475
- Closing costs
- $7,497
- Reserves months
- —
- Total cash needed
- —
Loan-product check · same deal, 3 products live
Conventional
25% down · 7.5% · 30yr
- Down + closing
- —
- Monthly P&I
- —
- Monthly cashflow
- —
- DSCR
- —
- Eligible?
- —
Personal DTI + credit; lowest rate.
DSCR
20% down · 8.5% · 30yr
- Down + closing
- —
- Monthly P&I
- —
- Monthly cashflow
- —
- DSCR
- —
- Eligible?
- —
No personal income docs; deal must DSCR.
Hard money
10% down · 12.0% · 12mo
- Down + closing
- —
- Monthly P&I
- —
- Monthly cashflow
- —
- DSCR
- —
- Eligible?
- —
Short-term bridge; refi at stabilization.
Rent comps 4 comps
| Address | Beds | Baths | Sqft | Rent | $/sqft | DOM | Units | Dist |
|---|---|---|---|---|---|---|---|---|
| 2500 East Ave Rochester, NY | 3.0 | 1.0–3.0 | 1171 | $2,520 | $2.15 | 2d | 17 | 0.82mi |
| 27 Hoyt Pl Rochester, NY | 2.0 | 2.0 | 1354 | $2,995 | $2.21 | 2d | 1 | 1.22mi |
| 176 Merwin Ave Rochester, NY | 4.0 | 1.5 | 1750 | $2,200 | $1.26 | 43d | 1 | 1.23mi |
| 1600 East Ave Rochester, NY | 3.0 | 1.0–2.0 | 944 | $2,875 | $3.04 | 2d | 1 | 1.45mi |
Listing history 7 events
-
2026-06-13statusdays on market $249,900 Pending 9 DOM
-
2026-06-10days on market $249,900 Active 8 DOM
-
2026-06-09days on market $249,900 Active 7 DOM
-
2026-06-09days on market $249,900 Active 6 DOM
-
2026-06-07days on market $249,900 Active 5 DOM
-
2026-06-03remarks 699-char remark
-
2026-06-03$249,900 Active 1 DOM
ⓘ Source: listings_history table (triggers on properties + properties_extension) + one-shot
backfill from property_details.listing_events for pre-trigger history.
Tax reassessment forecast NY · Partial reset (capped growth)
- Current annual tax
- $6,367 · $531/mo
- Projected year-2 tax
- $6,367 · $531/mo
- Expected delta
- $0/yr ($0/mo · 0.0%)
ⓘ Screening estimate from a state-policy table — verify with the county assessor before closing.
Climate risk First Street
- Flood 1/10 Low FEMA zone X (unshaded) · 0% chance over 30 yrs
- Wildfire 2/10 Low
- Heat 2/10 Low 7 d/yr ≥95°F today · 16 d/yr by 30 yrs out
- Wind 1/10 Low
- Air quality 2/10 Low 1 unhealthy d/yr today · 2 by 30 yrs out
Nearby sold comps map
Loading sold comps map…
Walkable amenities ~0.75 mi
Loading nearby amenities…
Taxation est. · year 1
- Rental income
- $30,972
- − Mortgage interest
- −$13,998
- − Property taxes
- −$6,367
- − Insurance
- −$1,250
- − Repairs & maintenance
- −$2,478
- − Management
- −$2,478
- − Depreciation
- −$7,270
- Taxable loss
- −$2,868
- Est. tax savings @ 24.0%
- +$688
- After-tax cash flow
- $1,814/yr
For passive investors: Depreciation is non-cash, so a rental often shows a tax loss while cash-flowing — sheltering income. Rental losses are passive: they offset passive income freely, and up to $25,000/yr can offset ordinary (W-2) income if you actively participate and your MAGI is under $100k (phasing out to $0 by $150k); unused losses carry forward. On sale, claimed depreciation is recaptured at up to 25%, and gains may owe capital-gains tax (a 1031 exchange can defer both). Figures are a year-1 estimate at your 24.0% rate — not tax advice; consult a CPA.
Schools (NCES district)
- District
- Penfield Central School District
- NCES district ID
- 3622710
- Math proficiency
- 77% ▼ -3.00%
- Reading proficiency
- 79% ▲ 10.00%
- Median HH income
- $74,802
- Composite
- 68.37/100
- National rank
- #347
- State rank
- #67 of 590 in NY
Livability — Brighton
- Score
- 81/100
- State rank
- #89
- US rank
- #1379
Category grades
Schools grade is shown separately in the Schools card above.
Census & demographics
- Census place
- Brighton, NY
- County
- Monroe County · 674,131 people
- City population
- 38,703
- Metro
- Rochester, NY
- Population (ZIP)
- 14,311
- Household income
- $85,961
- Rent vs Own
- Severe rent burden
- 923.0
Population outlook (Monroe County) Hauer SSP2
- Today (2025)
- 759,460 people
- By 2030
- 757,154 · -0.3%
- By 2040
- 740,644 · -2.5%
- By 2050
- 714,443 · -5.9%
- By 2075
- 645,883 · -15.0%
- By 2100
- 547,084 · -28.0%
Race, ethnicity, and origin ACS 2023
- Neighborhood character
- Predominantly White (81%)
- Race & ethnicity
- White 81% Black 6% Hispanic / Latino 6% Two or more races 6% Asian 3%
- Hispanic origin (detail)
- Puerto Rican 2%
- Common ancestry
- Romanian 6% Iranian 4% Scotch-Irish 2%
- Foreign-born
- 7% · Canada, South Korea
- Languages at home
- 92% English-only · Spanish 2% Russian/Polish/Slavic 1% Other Indo-European 1%
Political lean MEDSL · Monroe
- 2024 margin
- D (+19.1) · D 59.5% · R 40.5%
- 2008→2024 swing
- +1.4pp toward D · 2008: 17.7pp · 2024: 19.1pp
- All cycles
- 2024: D+19.1 2020: D+21.0 2016: D+14.1 2012: D+17.4 2008: D+17.7
Not yet ingested
- Civics
- —
Market trends
- HPI YoY
- ▼ -86.64%
- Current HPI
- 280.8593
- Rent YoY
- ▲ 2.72%
- Metro
- Rochester, NY
- State GDP YoY
- ▲ 2.60%
- F500 in state
- 92
Industry mix (Fortune 500 HQ in NY)
| Industry | F500 HQs | Revenue |
|---|---|---|
| Financial Services | 10 | $950B |
|
||
| Consumer Goods | 9 | $162B |
|
||
| Insurance | 4 | $225B |
|
||
| Telecommunications | 2 | $144B |
|
||
| Pharmaceuticals | 2 | $112B |
|
||
| Media / Entertainment | 2 | $69B |
|
||
Price history
+187.2% since first listed2 events — show timeline
- 2026-06-02 Listed $249,900 UNYREIS
- 1996-07-31 Sold (Public Records) $87,000 Public Records
Property tax history
+3.1%/yrLatest (2025): $6,367 · +10.4% YoY. Source: county tax records.
Cash-flow waterfall
monthlySold comps — $/sqft
last 12 mo · ≤1 miLoading sold comps…