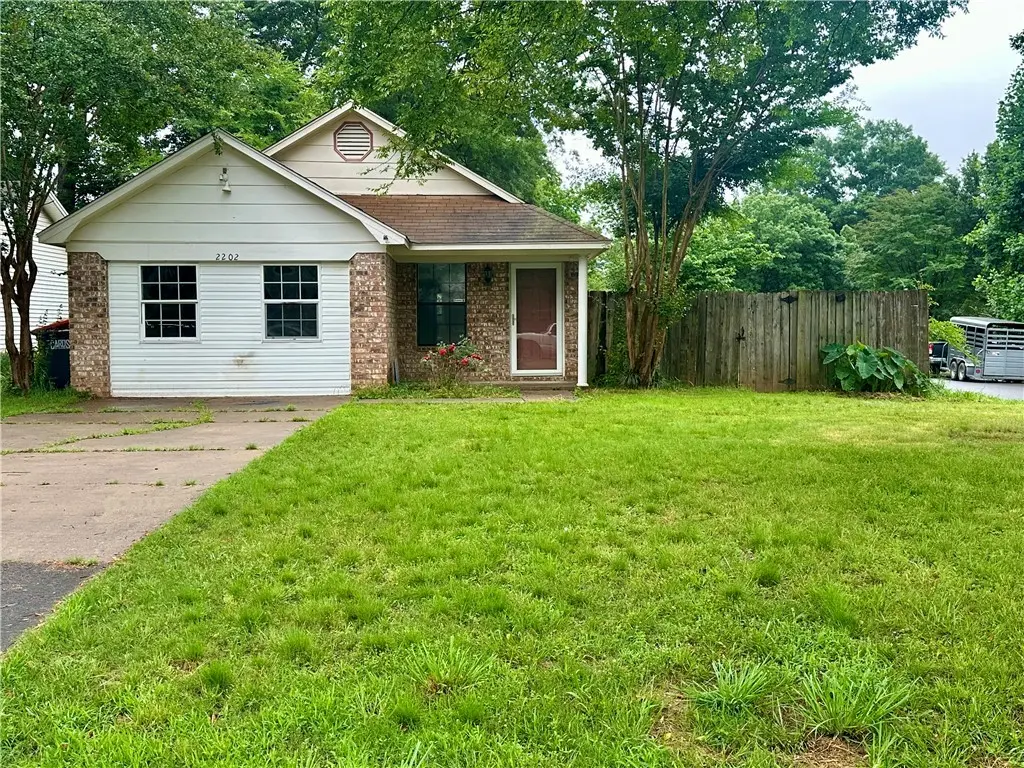
2202 S Jackson Cv · Russellville, AR
Flood risk 1/10 · Minimal
- FEMA flood zone
- X (unshaded)
- Chance of flooding over 30 yrs
- 0.0%
- Est. flood insurance / yr
- $507 – $1,088
Fire risk 4/10 · Minor
- Est. fire insurance / yr
- $1,499 – $2,785
Heat risk 7/10 · Major
- Hot days now (above 113°F)
- 7 days/yr
- Hot days in 30 yrs
- 19 days/yr
Wind risk 2/10 · Minimal
- Chance of severe wind over 30 yrs
- 4.0%
Air-quality risk 1/10 · Minimal
- Unhealthy air days now
- 0 days/yr
- Unhealthy air days in 30 yrs
- 0 days/yr
Risk factors via First Street. Map © Google.
Why this score? — see what drove the D- grade
The composite is a weighted blend of 9 inputs, each scored 0–100. Each bar is that input's sub-score; the figure is the points it added to the 100-point composite (weight × sub-score).
- Cash flow +13.3/30.0
- DSCR +4.0/10.0
- Livability +3.9/5.0
- Schools +3.8/10.0
- ARV discount +3.5/15.0
- Rent growth +2.5/5.0
- Condition / age +2.5/5.0
- 1% rule +2.4/10.0
- Appreciation +0.0/10.0
$172,000
🖨 Deal sheet 📄 Offer letter ✓ Due diligence
Listing remarks
2202 S. Jackson Cove is ready for its new owners! On top of having 3 bedrooms and 2 full bathrooms, this home also offers an additional space that can be used as an additional bedroom, office, or flex space This property features fresh paint, new appliances, a professional clean, and so much more! The fenced in backyard gives you privacy and space for gatherings! Make this your home. Schedule your showing today!
Key facts
- Fenced in backyard
- 6,499 sq ft lot
- Built 1990
Tags
Property features AI
Finance
- HOA & community: Monthly association fee; Community near fire station, hospital, schools, and park
Exterior
- Parking: Concrete driveway
- Security: Fire alarm
- Utilities: Electricity available; Public water; Public sewer
- Home design: Single-story; Brick construction; Slab foundation; Asphalt shingle roof
- Construction: Brick construction; Asphalt shingle roof; Slab foundation
- Exterior features: Concrete driveway; Cul-de-sac lot; City lot; Near park; Subdivision
Interior
- Kitchen: Dishwasher; Electric cooktop; Range hood
- Flooring: Carpet; Tile
- Bathrooms: 2 full bathrooms
- Heating & cooling: Central heating; Central air
- Interior features: Ceiling fan(s); Granite counters; Pantry
- Laundry & utility: Washer hookup; Dryer hookup; Electric water heater
Neighborhood map
What this means for you Summary
Snapshot
- This is a 3-bed/1.5-bath single-family listed at $172k.
Deal economics
- At list price, monthly cash flow is $2 ($18/yr) — positive.
- The deal already cash-flows at list — no discount required.
- To meet the 1% rule (rent ≥ 1% of price), the offer needs to be $127k (26.1% below list).
- Recommended offer: $127k (26.1% below list) — sets the bar for 1% rule.
- Cap rate 6.3% vs local median 3.5% in Russellville — top-decile yield for the area; either an underpriced asset or a hidden risk that comps aren't pricing in. Stress-test before assuming the spread holds.
Location & tenants
- Location reads 77/100 on livability (#10 in AR, #3,049 nationally) — a middle-class / working-renter tenant base. Strengths: amenities A+, cost of living A+, health & safety A+; Watch: commute F, employment F.
- Russellville School District (town): math 46% / reading 45% proficiency, ranked #38 of 238 in AR (top 16%) — families likely to look elsewhere, expect single-tenant / working-renter base with shorter leases.
- Market conditions: 218 active listings in the ZIP; 55 units permitted in Pope County in 2024 (0 in 5+ unit buildings).
Forward outlook
- Local home prices are declining (-3.0%/yr); year-one equity from $1k of loan paydown is wiped out by about $5k of value loss. Plan a longer hold.
- Pope County population projected at +9% by 2050 — modest demand growth; plan on rents tracking national, not racing it.
Negotiation context
- It's been on market 30 days — a 2% lower offer ($169k) is reasonable based on typical stale-listing flexibility.
- Current owner paid $90k; list at $172k implies a 91% gain — meaningful room to come down on a strong offer.
Risks & watch-outs
- Climate carrying-cost: extreme-heat days projected 7→19/yr by 2055 (HVAC capex compounding) — expect insurance premiums to compound above CPI over the hold.
Questions for the listing agent
- Is there a deadline driving the sale (1031 exchange, divorce, estate, relocation)? That informs how much negotiation room exists.
- Schools are B-rated — typically a magnet for longer-tenancy family renters. What's the average tenant stay here, and is there a school-zone premium baked into asking?
- The area grade is low — what's the realistic commute time and amenity access for the typical tenant pool here? Any planned neighborhood developments (good or bad) we should know about?
- What's the average days-on-market for RENTAL listings here right now (not sales)? A rising rental-DOM trend means longer vacancies and softer asking-rent achievability than the comps imply.
- What's the recent tenant-quality profile in this submarket — average credit score on applications, eviction rate, late-payment / NSF rate, and stable-employment percentage? A property-management company in the area should have these aggregated.
- How much new for-sale + rental construction is in the pipeline within 1–3 miles? Heavy new supply typically softens prices + rents 12–24 months out; constrained supply supports both.
Investment metrics
- 1% rule
- 0.74% ✗
- Cap rate
- 6.30%
- Cash-on-cash
- 0.04%
- DSCR
- 1.00
- GRM
- 11.3
CMA / ARV
- ARV (on-the-fly)
- $158,000
- Comps found
- 12
Show comp detail 12 sales within ~0.75 mi
| Address | Dist | Beds/Ba | Sqft | Sold | Price | $/sf | Match |
|---|---|---|---|---|---|---|---|
| 2207 Timberwood Ln | 0.05mi | 3/2.0 | 1,368 (+8%) | 0mo | $140,000 | $102 | 82 |
| 2210 Timberwood Ln | 0.02mi | 3/2.0 | 1,106 (-12%) | 6mo | $169,000 | $153 | 71 |
| 1301 S Greenwich Ave | 0.64mi | 3/1.0 | 1,248 (-1%) | 2mo | $162,000 | $130 | 65 |
| 1908 S Knoxville Ave | 0.19mi | 2/1.5 (-1) | 1,400 (+11%) | 7mo | $125,000 | $89 | 62 |
| 401 E 14th St | 0.71mi | 3/2.0 | 1,267 (+0%) | 6mo | $87,000 | $69 | 59 |
| 1307 S Ithaca Ave | 0.60mi | 3/2.0 | 1,350 (+7%) | 3mo | $168,291 | $125 | 57 |
| 1708 S Detroit Ave | 0.51mi | 3/1.5 | 1,108 (-12%) | 1mo | $150,000 | $135 | 55 |
| 1204 S Ithaca Ave | 0.68mi | 3/1.5 | 1,157 (-8%) | 1mo | $139,900 | $121 | 53 |
| 1505 S Boston Pl | 0.68mi | 4/1.5 (+1) | 1,365 (+8%) | 1mo | $164,500 | $121 | 49 |
| 1209 S Hartford Ave | 0.65mi | 3/2.0 | 1,377 (+9%) | 8mo | $157,000 | $114 | 46 |
| 1306 S Oswego Pl | 0.74mi | 3/2.0 | 1,370 (+8%) | 8mo | $199,500 | $146 | 43 |
| 2004 S Boulder Pl | 0.74mi | 3/1.5 | 1,422 (+12%) | 7mo | $180,000 | $127 | 39 |
Match score weights: distance 35% · size 25% · config 20% · recency 20%. Top-matched comps best support the ARV.
Projected returns pro-forma
-3.0% appreciation · 3.0% rent growth · sell at horizon
- IRR
- -16.3%
- Equity multiple
- 0.42×
- Total profit
- $-27,871
- Equity at exit
- $25,646
- IRR
- -8.1%
- Equity multiple
- 0.49×
- Total profit
- $-24,533
- Equity at exit
- $14,871
Cash invested: $48,160 (down + closing). Projections, not guarantees.
Landlord ↔ Tenant lean methodology
- Overall (STATE)
- 92 Strongly Landlord-Friendly
- State Arkansas
- 92 Strongly Landlord-Friendly · R+14
- County
- — inherits STATE
- City
- — inherits STATE
ZIP-level market 72802
- Home prices YoY
- -14.1%
- Active inventory
- 218
- Price-to-rent
- 11.3×
Monthly cashflow live
- Estimated rent
- $1,271 medium interval (Pro) →
- Mortgage (P&I)
- −$902
- Tax from tax record
- −$29 /mo · $346/yr
- Insurance
- −$72
- HOA
- −$0
- Vacancy / Maint / Mgmt
- −$267
- Net cashflow
- $2
Break-even live
UW: 25.0% down · 7.5% · 30yr · 1.5% tax · 5.0% vac · 8.0% maint · 8.0% mgmt
Financing live
Cash to close
- Down payment
- $43,000
- Closing costs
- $5,160
- Reserves months
- —
- Total cash needed
- —
Loan-product check · same deal, 3 products live
Conventional
25% down · 7.5% · 30yr
- Down + closing
- —
- Monthly P&I
- —
- Monthly cashflow
- —
- DSCR
- —
- Eligible?
- —
Personal DTI + credit; lowest rate.
DSCR
20% down · 8.5% · 30yr
- Down + closing
- —
- Monthly P&I
- —
- Monthly cashflow
- —
- DSCR
- —
- Eligible?
- —
No personal income docs; deal must DSCR.
Hard money
10% down · 12.0% · 12mo
- Down + closing
- —
- Monthly P&I
- —
- Monthly cashflow
- —
- DSCR
- —
- Eligible?
- —
Short-term bridge; refi at stabilization.
Listing history 19 events
-
2026-06-19days on market $172,000 Active 30 DOM
-
2026-06-18days on market $172,000 Active 29 DOM
-
2026-06-17days on market $172,000 Active 28 DOM
-
2026-06-16days on market $172,000 Active 27 DOM
-
2026-06-15days on market $172,000 Active 26 DOM
-
2026-06-14days on market $172,000 Active 24 DOM
-
2026-06-12days on market $172,000 Active 23 DOM
-
2026-06-09days on market $172,000 Active 20 DOM
-
2026-06-08days on market $172,000 Active 19 DOM
-
2026-06-07pricedays on market $172,000 Active 18 DOM
-
2026-06-05days on market $177,000 Active 15 DOM
-
2026-06-02days on market $177,000 Active 13 DOM
-
2026-06-01days on market $177,000 Active 12 DOM
-
2026-05-31days on market $177,000 Active 11 DOM
-
2026-05-30days on market $177,000 Active 10 DOM
-
2026-05-20$177,000 Active
-
2023-03-06soldstatus $90,000
-
2007-09-18soldstatus $76,000
-
2005-01-13soldstatus $64,000
ⓘ Source: listings_history table (triggers on properties + properties_extension) + one-shot
backfill from property_details.listing_events for pre-trigger history.
Tax reassessment forecast AR · Resets to sale price
- Current annual tax
- $346 · $29/mo
- Projected year-2 tax
- $1,101 · $92/mo
- Expected delta
- +$755/yr (+$63/mo · 218.0%)
ⓘ Screening estimate from a state-policy table — verify with the county assessor before closing.
Climate risk First Street
- Flood 1/10 Low FEMA zone X (unshaded) · 0% chance over 30 yrs
- Wildfire 4/10 Moderate
- Heat 7/10 Severe 7 d/yr ≥113°F today · 19 d/yr by 30 yrs out
- Wind 2/10 Low 4% chance of damaging wind over 30 yrs
- Air quality 1/10 Low 0 unhealthy d/yr today · 0 by 30 yrs out
Nearby sold comps map
Loading sold comps map…
Walkable amenities ~0.75 mi
Loading nearby amenities…
Taxation est. · year 1
- Rental income
- $15,251
- − Mortgage interest
- −$9,635
- − Property taxes
- −$346
- − Insurance
- −$860
- − Repairs & maintenance
- −$1,220
- − Management
- −$1,220
- − Depreciation
- −$5,004
- Taxable loss
- −$3,034
- Est. tax savings @ 24.0%
- +$728
- After-tax cash flow
- $746/yr
For passive investors: Depreciation is non-cash, so a rental often shows a tax loss while cash-flowing — sheltering income. Rental losses are passive: they offset passive income freely, and up to $25,000/yr can offset ordinary (W-2) income if you actively participate and your MAGI is under $100k (phasing out to $0 by $150k); unused losses carry forward. On sale, claimed depreciation is recaptured at up to 25%, and gains may owe capital-gains tax (a 1031 exchange can defer both). Figures are a year-1 estimate at your 24.0% rate — not tax advice; consult a CPA.
Schools (NCES district)
- District
- Russellville School District
- NCES district ID
- 0512060
- Math proficiency
- 46% ▼ -10.00%
- Reading proficiency
- 45% ▼ -9.00%
- Median HH income
- $38,619
- Composite
- 37.98/100
- National rank
- #4293
- State rank
- #38 of 238 in AR
Livability — Russellville
- Score
- 77/100
- State rank
- #10
- US rank
- #3049
Category grades
Schools grade is shown separately in the Schools card above.
Census & demographics
- Census place
- Russellville, AR
- County
- Pope County · 42,302 people
- City population
- 42,302
- Metro
- Russellville, AR
- Population (ZIP)
- 23,283
- Household income
- $64,110
- Rent vs Own
- Severe rent burden
- 404.0
Population outlook (Pope County) Hauer SSP2
- Today (2025)
- 66,303 people
- By 2030
- 67,635 · +2.0%
- By 2040
- 70,046 · +5.6%
- By 2050
- 72,107 · +8.8%
- By 2075
- 78,042 · +17.7%
- By 2100
- 82,343 · +24.2%
Race, ethnicity, and origin ACS 2023
- Neighborhood character
- Predominantly White (82%)
- Race & ethnicity
- White 82% Hispanic / Latino 11% Two or more races 7% Black 2%
- Hispanic origin (detail)
- Mexican 6%
- Common ancestry
- Serbian 2% Lithuanian 2% Slovak 2%
- Foreign-born
- 6% · Canada
- Languages at home
- 91% English-only · Spanish 8% French/Haitian/Cajun 1%
Political lean MEDSL · Pope
- 2024 margin
- Solid R (+52.2) · D 22.7% · R 74.9% · Other 2.4%
- 2008→2024 swing
- -8.9pp toward R · 2008: -43.3pp · 2024: -52.2pp
- All cycles
- 2024: R+52.2 2020: R+50.4 2016: R+50.5 2012: R+47.2 2008: R+43.3
Not yet ingested
- Civics
- —
Market trends
- HPI YoY
- ▼ -37.02%
- Current HPI
- 225.2177
- Rent YoY
- —
- Metro
- Russellville, AR
- State GDP YoY
- ▲ 3.80%
- F500 in state
- 10
Industry mix (Fortune 500 HQ in AR)
| Industry | F500 HQs | Revenue |
|---|---|---|
| Retail | 1 | $681B |
|
||
| Food / Agriculture | 1 | $53B |
|
||
| Retail / Energy | 1 | $22B |
|
||
| Transportation / Logistics | 1 | $12B |
|
||
| Energy | 1 | $4B |
|
||
Price history
+176.6% since first listed4 events — show timeline
- 2026-05-20 Listed $177,000 NWARMLS
- 2023-03-06 Sold (Public Records) $90,000 Public Records
- 2007-09-18 Sold (Public Records) $76,000 Public Records
- 2005-01-13 Sold (Public Records) $64,000 Public Records
Property tax history
+3.1%/yrLatest (2025): $346 · +38.9% YoY. Source: county tax records.
Cash-flow waterfall
monthlySold comps — $/sqft
last 12 mo · ≤1 miLoading sold comps…