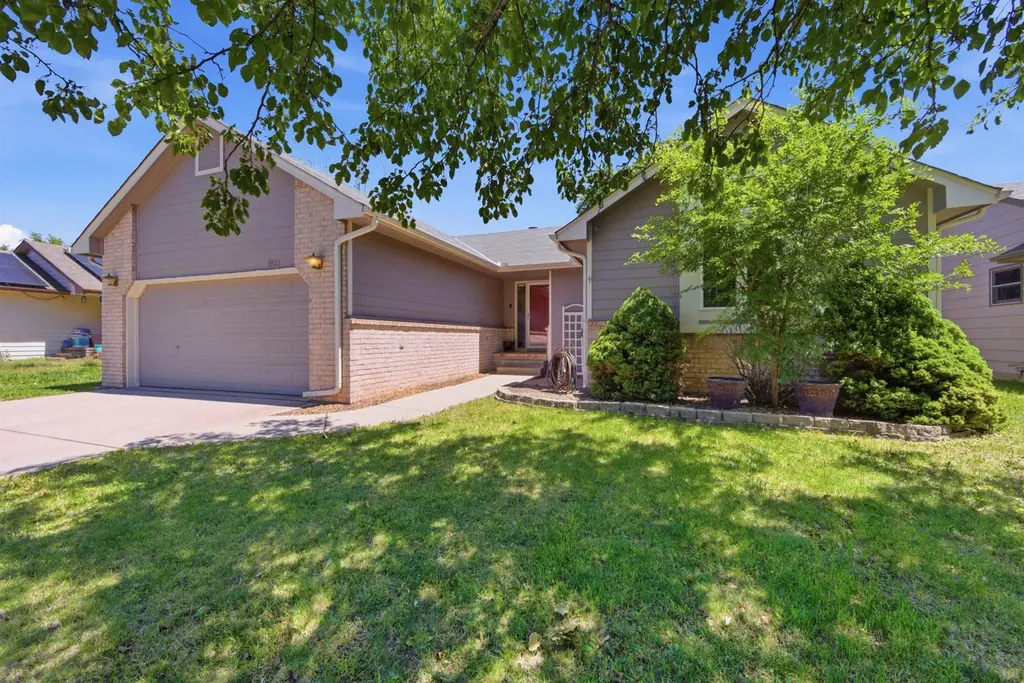
1918 N Stoney Pt · Wichita, KS
Flood risk 1/10 · Minimal
- FEMA flood zone
- X (unshaded)
- Chance of flooding over 30 yrs
- 0.0%
- Est. flood insurance / yr
- $473 – $860
Fire risk 1/10 · Minimal
- Est. fire insurance / yr
- $1,154 – $2,142
Heat risk 5/10 · Moderate
- Hot days now (above 105°F)
- 7 days/yr
- Hot days in 30 yrs
- 18 days/yr
Wind risk 2/10 · Minimal
- Chance of severe wind over 30 yrs
- —
Air-quality risk 2/10 · Minimal
- Unhealthy air days now
- 0 days/yr
- Unhealthy air days in 30 yrs
- 2 days/yr
Risk factors via First Street. Map © Google.
Why this score? — see what drove the D grade
The composite is a weighted blend of 9 inputs, each scored 0–100. Each bar is that input's sub-score; the figure is the points it added to the 100-point composite (weight × sub-score).
- Cash flow +10.2/30.0
- ARV discount +7.5/15.0
- Appreciation +5.0/10.0
- Schools +3.8/10.0
- Livability +3.6/5.0
- DSCR +2.9/10.0
- 1% rule +2.7/10.0
- Rent growth +2.5/5.0
- Condition / age +2.5/5.0
$292,000
🖨 Deal sheet (PDF) 📄 Offer letter ✓ Due diligence
Key facts
- Walk-in closet
- Finished basement
- Bright dining area
Tags
Property features AI
Finance
- HOA & community: Community association with a $200 periodic fee and a $100 initiation fee; Association fee covers general upkeep for common areas
Exterior
- Parking: 2-car garage
- Security: Smoke detector(s)
- Utilities: Sewer available; Natural gas available; Private water source
- Home design: Single-family onsite-built home; One level
- Construction: Composition roof; Full daylight foundation
- Exterior features: Deck; Wood fencing
Interior
- Kitchen: Dishwasher; Disposal; Microwave; Refrigerator; Range
- Flooring: Laminate
- Bathrooms: Three full bathrooms
- Heating & cooling: Forced air heating (natural gas); Central electric air conditioning
- Interior features: Finished daylight basement; Humidifier; Wood-burning fireplace with gas starter and glass doors in the living room; Storm doors and storm windows; Smoke detectors
- Laundry & utility: Laundry in basement in a separate room with 220V equipment
Neighborhood map
What this means for you Summary
Snapshot
- This is a 4-bed/3.0-bath single-family listed at $292k.
Deal economics
- At list price, monthly cash flow is $-164 ($-2k/yr) — negative.
- To cash-flow at today's rent, offer at most $263k (9.9% below list).
- To meet the 1% rule (rent ≥ 1% of price), the offer needs to be $225k (22.9% below list).
- Recommended offer: $225k (22.9% below list) — sets the bar for 1% rule.
Location & tenants
- Location reads 72/100 on livability (#100 in KS) — a middle-class / working-renter tenant base. Strengths: amenities A+, cost of living A+, housing A+; Watch: employment D+, crime F, commute F.
- Maize (rural): math 36% / reading 45% proficiency, ranked #20 of 169 in KS (top 12%) — families likely to look elsewhere, expect single-tenant / working-renter base with shorter leases; only 14% free/reduced lunch — higher-income household profile.
- Zoned schools: Vermillion Elementary School (math 40% / reading 43%, grade F, #306 of 684 statewide, top 45%, 835 students, 25% FRL); Maize Middle School (math 25% / reading 37%, grade F, #62 of 219 statewide, top 28%, 734 students, 29% FRL); Maize Sr High (math 25% / reading 26%, grade F, #98 of 327 statewide, top 30%, 1,289 students, 26% FRL).
- Market conditions: 1 active listings in the ZIP; 1 comparable units currently listed for rent nearby; 2,613 units permitted in Sedgwick County in 2024 (258 in 5+ unit buildings).
Forward outlook
- In year one you build about $11k of equity ($2k loan paydown + $9k appreciation (3.0% local appreciation)).
- Sedgwick County population projected at +5% by 2050 — modest demand growth; plan on rents tracking national, not racing it.
- By year 4, paydown + projected appreciation supports a ~$37k cash-out refi (75% LTV) — recoverable capital for the next deal without selling this one.
Negotiation context
- Only 13 days on market — expect competitive offers; lowballing is unlikely to land.
- 6 sale attempts since 24y ago with the ask held roughly flat each time — persistent listings suggest the price (not the market) is what's stuck; bring a comps-based counter.
Risks & watch-outs
- Climate carrying-cost: extreme-heat days projected 7→18/yr by 2055 (HVAC capex compounding) — expect insurance premiums to compound above CPI over the hold.
Questions for the listing agent
- What do current leases actually rent for vs. the listed asking? Can we see a recent rent roll and the last 12 months of T-12 income?
- What does the HOA fee cover, when was the last increase, and are there any pending special assessments or reserve-fund shortfalls?
- Is there a deadline driving the sale (1031 exchange, divorce, estate, relocation)? That informs how much negotiation room exists.
- Schools are F-rated, which usually means shorter tenancies and higher turnover. Who's the typical renter profile here, and what's been the actual vacancy rate?
- Crime grade is F in this area — have there been break-ins, vandalism, or insurance claims at this property in the last 3 years? What carrier currently insures it and at what premium?
- The area grade is low — what's the realistic commute time and amenity access for the typical tenant pool here? Any planned neighborhood developments (good or bad) we should know about?
- What's the average days-on-market for RENTAL listings here right now (not sales)? A rising rental-DOM trend means longer vacancies and softer asking-rent achievability than the comps imply.
- What's the recent tenant-quality profile in this submarket — average credit score on applications, eviction rate, late-payment / NSF rate, and stable-employment percentage? A property-management company in the area should have these aggregated.
- How much new for-sale + rental construction is in the pipeline within 1–3 miles? Heavy new supply typically softens prices + rents 12–24 months out; constrained supply supports both.
Investment metrics
- 1% rule
- 0.77% ✗
- Cap rate
- 5.62%
- Cash-on-cash
- -2.41%
- DSCR
- 0.89
- GRM
- 10.8
CMA / ARV
No comps found within radius.
Projected returns pro-forma
3.0% appreciation · 3.0% rent growth · sell at horizon
- IRR
- 5.3%
- Equity multiple
- 1.30×
- Total profit
- $24,724
- Equity at exit
- $131,296
- IRR
- 8.3%
- Equity multiple
- 2.26×
- Total profit
- $102,672
- Equity at exit
- $202,343
Cash invested: $81,760 (down + closing). Projections, not guarantees.
Landlord ↔ Tenant lean methodology
- Overall (STATE)
- 83 Strongly Landlord-Friendly
- State Kansas
- 83 Strongly Landlord-Friendly · R+10
- County
- — inherits STATE
- City
- — inherits STATE
ZIP-level market 67212-6497
- Active inventory
- 1
- Price-to-rent
- 10.8×
Monthly cashflow live
- Estimated rent
- $2,250 medium interval (Pro) →
- Mortgage (P&I)
- −$1,531
- Tax from tax record
- −$271 /mo · $3,257/yr
- Insurance
- −$122
- HOA
- −$17
- Vacancy / Maint / Mgmt
- −$472
- Net cashflow
- $-164
Break-even live
Sensitivity live
| Price | -10% $1 | -5% $-81 | +0% $-164 | +5% $-247 | +10% $-329 |
|---|---|---|---|---|---|
| Rent | -10% $-342 | -5% $-253 | +0% $-164 | +5% $-75 | +10% $14 |
| Rate | -1.0pp $-17 | -0.5pp $-90 | base $-164 | +0.5pp $-240 | +1.0pp $-317 |
UW: 25.0% down · 7.5% · 30yr · 1.5% tax · 5.0% vac · 8.0% maint · 8.0% mgmt
Financing live
Cash to close
- Down payment
- $73,000
- Closing costs
- $8,760
- Reserves months
- —
- Total cash needed
- —
Loan-product check · same deal, 3 products live
Conventional
25% down · 7.5% · 30yr
- Down + closing
- —
- Monthly P&I
- —
- Monthly cashflow
- —
- DSCR
- —
- Eligible?
- —
Personal DTI + credit; lowest rate.
DSCR
20% down · 8.5% · 30yr
- Down + closing
- —
- Monthly P&I
- —
- Monthly cashflow
- —
- DSCR
- —
- Eligible?
- —
No personal income docs; deal must DSCR.
Hard money
10% down · 12.0% · 12mo
- Down + closing
- —
- Monthly P&I
- —
- Monthly cashflow
- —
- DSCR
- —
- Eligible?
- —
Short-term bridge; refi at stabilization.
Rent comps 1 comps
| Address | Beds | Baths | Sqft | Rent | $/sqft | DOM | Units | Dist |
|---|---|---|---|---|---|---|---|---|
| 11901 W Central Park Ct Wichita, KS | 5.0 | 3.0 | 2560 | $2,250 | $0.88 | 16d | 1 | 1.12mi |
HOA detail
- Monthly dues
- $17 · $204/yr
Listing history 11 events
-
2026-05-13$292,000 Active
-
2025-03-24soldstatus
-
2025-02-14status Pending
-
2025-02-05$279,900 Active
-
2017-09-08soldstatus
-
2017-07-18$169,900
-
2009-05-28soldstatus
-
2009-05-28soldstatus
-
2009-03-24$149,900
-
2005-01-10$134,900
-
2002-04-08$125,000
ⓘ Source: listings_history table (triggers on properties + properties_extension) + one-shot
backfill from property_details.listing_events for pre-trigger history.
Tax reassessment forecast KS · Resets to sale price
- Current annual tax
- $3,257 · $271/mo
- Projected year-2 tax
- $4,117 · $343/mo
- Expected delta
- +$860/yr (+$72/mo · 26.4%)
ⓘ Screening estimate from a state-policy table — verify with the county assessor before closing.
Climate risk First Street
- Flood 1/10 Low FEMA zone X (unshaded) · 0% chance over 30 yrs
- Wildfire 1/10 Low
- Heat 5/10 Major 7 d/yr ≥105°F today · 18 d/yr by 30 yrs out
- Wind 2/10 Low
- Air quality 2/10 Low 0 unhealthy d/yr today · 2 by 30 yrs out
Nearby sold comps map
Loading sold comps map…
Walkable amenities ~0.75 mi
Loading nearby amenities…
Taxation est. · year 1
- Rental income
- $27,000
- − Mortgage interest
- −$16,357
- − Property taxes
- −$3,257
- − Insurance
- −$1,460
- − Repairs & maintenance
- −$2,160
- − Management
- −$2,160
- − HOA
- −$204
- − Depreciation
- −$8,495
- Taxable loss
- −$7,092
- Est. tax savings @ 24.0%
- +$1,702
- After-tax cash flow
- $-265/yr
For passive investors: Depreciation is non-cash, so a rental often shows a tax loss while cash-flowing — sheltering income. Rental losses are passive: they offset passive income freely, and up to $25,000/yr can offset ordinary (W-2) income if you actively participate and your MAGI is under $100k (phasing out to $0 by $150k); unused losses carry forward. On sale, claimed depreciation is recaptured at up to 25%, and gains may owe capital-gains tax (a 1031 exchange can defer both). Figures are a year-1 estimate at your 24.0% rate — not tax advice; consult a CPA.
Schools (NCES district)
- District
- Maize
- NCES district ID
- 2009140
- Math proficiency
- 36% ▼ -6.00%
- Reading proficiency
- 45% ▼ -4.00%
- Median HH income
- $87,686
- Composite
- 38.48/100
- National rank
- #4184
- State rank
- #20 of 169 in KS
Livability — Wichita
- Score
- 72/100
- State rank
- #100
- US rank
- #5730
Category grades
Schools grade is shown separately in the Schools card above.
Census & demographics
- Census place
- Wichita, KS
Population outlook (Sedgwick County) Hauer SSP2
- Today (2025)
- 537,014 people
- By 2030
- 546,984 · +1.9%
- By 2040
- 559,141 · +4.1%
- By 2050
- 562,027 · +4.7%
- By 2075
- 557,255 · +3.8%
- By 2100
- 513,383 · -4.4%
Not yet ingested
- Political lean
- —
- Race & ethnicity
- —
- Common origin
- —
- Civics
- —
Market trends
- HPI YoY
- —
- Current HPI
- —
- Rent YoY
- —
- Metro
- —
- State GDP YoY
- —
- F500 in state
- 0
Price history
+133.6% since first listed11 events — show timeline
- 2026-05-13 Listed $292,000 SCKMLS as Distributed by MLS Grid
- 2025-03-24 Sold (Public Records) — Public Records
- 2025-02-14 Pending — SCKMLS as Distributed by MLS Grid
- 2025-02-05 Listed $279,900 SCKMLS as Distributed by MLS Grid
- 2017-09-08 Sold (Public Records) — Public Records
- 2017-07-18 Listed $169,900 SCKMLS as Distributed by MLS Grid
- 2009-05-28 Sold (Public Records) — Public Records
- 2009-05-28 Sold (Public Records) — Public Records
- 2009-03-24 Listed $149,900 SCKMLS as Distributed by MLS Grid
- 2005-01-10 Listed $134,900 SCKMLS as Distributed by MLS Grid
- 2002-04-08 Listed $125,000 SCKMLS as Distributed by MLS Grid
Property tax history
+5.2%/yrLatest (2025): $3,257 · +5.5% YoY. Source: county tax records.
Cash-flow waterfall
monthlySold comps — $/sqft
last 12 mo · ≤1 miLoading sold comps…