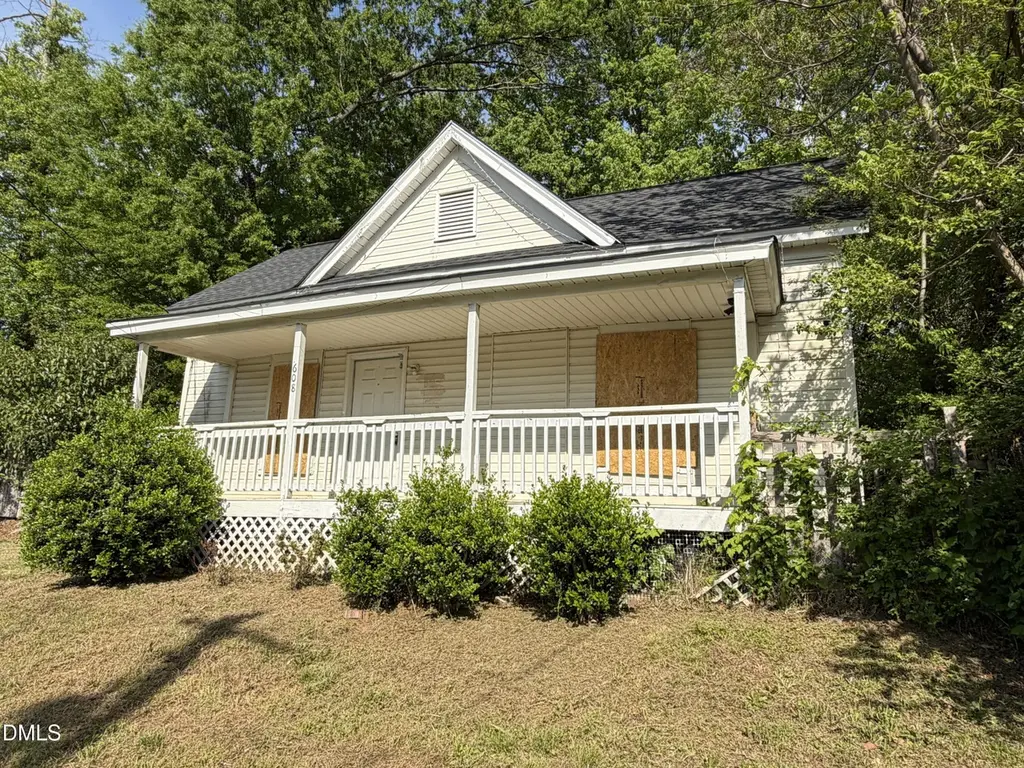
608 N Elm St · Durham, NC
Flood risk 1/10 · Minimal
- FEMA flood zone
- X (unshaded)
- Chance of flooding over 30 yrs
- 0.0%
- Est. flood insurance / yr
- $507 – $1,088
Fire risk 1/10 · Minimal
- Est. fire insurance / yr
- $906 – $1,684
Heat risk 6/10 · Moderate
- Hot days now (above 106°F)
- 7 days/yr
- Hot days in 30 yrs
- 16 days/yr
Wind risk 6/10 · Moderate
- Chance of severe wind over 30 yrs
- 27.0%
Air-quality risk 2/10 · Minimal
- Unhealthy air days now
- 1 days/yr
- Unhealthy air days in 30 yrs
- 1 days/yr
Risk factors via First Street. Map © Google.
Why this score? — see what drove the B grade
The composite is a weighted blend of 9 inputs, each scored 0–100. Each bar is that input's sub-score; the figure is the points it added to the 100-point composite (weight × sub-score).
- Cash flow +30.0/30.0
- DSCR +10.0/10.0
- 1% rule +9.7/10.0
- ARV discount +7.5/15.0
- Livability +4.0/5.0
- Rent growth +3.3/5.0
- Schools +3.0/10.0
- Condition / age +2.5/5.0
- Appreciation +0.0/10.0
$124,900
🖨 Deal sheet 📄 Offer letter ✓ Due diligence
Listing remarks MLS
Very Good Rental Opportunity. Home is in very good condition. Off street parking. Owner financing available with acceptable offer.
Key facts
- 4,356 sq ft lot
- Built 1900
- Listed 21 days
Tags
Property features AI
Finance
- Other: Zoning: R-3
- HOA & community: No homeowners association
Exterior
- Utilities: Public water; Public sewer
- Home design: Site-built single-story home; One level
- Construction: Site built construction; Vinyl siding; Shingle roof
- Exterior features: Shingle roof; Vinyl siding; Lot approximately 0.1 acre; Publicly maintained road access
Interior
- Bedrooms: 2 bedrooms (1 on the main level)
- Flooring: Laminate
- Bathrooms: 1 full bathroom
- Heating & cooling: Central heating; Central air conditioning
- Interior features: Laminate flooring
Neighborhood map
What this means for you Summary
Snapshot
- This is a 2-bed/1.0-bath single-family listed at $125k.
Deal economics
- At list price, monthly cash flow is $579 ($7k/yr) — positive.
- The deal already cash-flows at list — no discount required.
- Meets the 1% rule at list price ($2k rent vs $125k).
- Recommended offer: $123k (1.5% below list) — sets the bar for market timing.
- Cap rate 11.9% vs local median 3.0% in Durham — top-decile yield for the area; either an underpriced asset or a hidden risk that comps aren't pricing in. Stress-test before assuming the spread holds.
Location & tenants
- Location reads 81/100 on livability (#15 in NC, #1,411 nationally) — a professional / high-income tenant draw. Strengths: amenities A+, commute A+, housing A+; Watch: crime F.
- Durham Public Schools (urban): math 29% / reading 39% proficiency, ranked #132 of 178 in NC (top 74%) — families likely to look elsewhere, expect single-tenant / working-renter base with shorter leases.
- Zoned schools: Riverside High (math 49% / reading 42%, grade D-, #347 of 535 statewide, top 65%, 1,812 students, 51% FRL).
- Market conditions: Rents rising (+3.2%/yr); 197 active listings in the ZIP; 40 comparable units currently listed for rent nearby; rentals at typical pace (median 24d on market — plan ~3-4 weeks tenant-placement turnaround); 2,905 units permitted in Durham County in 2024 (955 in 5+ unit buildings).
Forward outlook
- Local home prices are declining (-3.0%/yr); year-one equity from $864 of loan paydown is wiped out by about $4k of value loss. Plan a longer hold.
- Durham County population projected at +44% by 2050 — long-run rental-demand tailwind backs the buy-and-hold thesis.
- At projected returns (-3.0% appreciation + 3.2% rent growth), your $35k cash investment doubles in ~6 years — after that, you're playing with house money.
Negotiation context
- It's been on market 21 days — a 2% lower offer ($123k) is reasonable based on typical stale-listing flexibility.
- 8 sale attempts since 22y ago with the ask held roughly flat each time — persistent listings suggest the price (not the market) is what's stuck; bring a comps-based counter.
- Current owner paid $65k; list at $125k implies a 92% gain — meaningful room to come down on a strong offer.
Risks & watch-outs
- Watch-outs: built in 1900 — expect roof / HVAC / electrical / plumbing capex.
- Climate carrying-cost: major wind risk, 27% chance of damaging wind over 30y; extreme-heat days projected 7→16/yr by 2055 (HVAC capex compounding) — expect insurance premiums to compound above CPI over the hold.
Questions for the listing agent
- Built in 1900 — when were the roof, HVAC, electrical panel, plumbing, and water heater last replaced?
- Is there a deadline driving the sale (1031 exchange, divorce, estate, relocation)? That informs how much negotiation room exists.
- Schools are D-rated, which usually means shorter tenancies and higher turnover. Who's the typical renter profile here, and what's been the actual vacancy rate?
- Crime grade is F in this area — have there been break-ins, vandalism, or insurance claims at this property in the last 3 years? What carrier currently insures it and at what premium?
- What's the average days-on-market for RENTAL listings here right now (not sales)? A rising rental-DOM trend means longer vacancies and softer asking-rent achievability than the comps imply.
- What's the recent tenant-quality profile in this submarket — average credit score on applications, eviction rate, late-payment / NSF rate, and stable-employment percentage? A property-management company in the area should have these aggregated.
- How much new for-sale + rental construction is in the pipeline within 1–3 miles? Heavy new supply typically softens prices + rents 12–24 months out; constrained supply supports both.
Investment metrics
- 1% rule
- 1.47% ✓
- Cap rate
- 11.86%
- Cash-on-cash
- 19.87%
- DSCR
- 1.88
- GRM
- 5.7
CMA / ARV
- ARV (on-the-fly)
- $255,552
- Comps found
- 12
Show comp detail 12 sales within ~0.75 mi
| Address | Dist | Beds/Ba | Sqft | Sold | Price | $/sf | Match |
|---|---|---|---|---|---|---|---|
| 608 N Elm St | 0.00mi | 2/1.0 | 968 (0%) | 1mo | $105,000 | $108 | 100 |
| 1207 Wall St | 0.20mi | 2/1.0 | 916 (-5%) | 12mo | $155,000 | $169 | 72 |
| 1107 N Hyde Park Ave | 0.43mi | 3/1.0 (+1) | 960 (-1%) | 6mo | $299,500 | $312 | 68 |
| 919 Chester St | 0.34mi | 2/1.0 | 855 (-12%) | 9mo | $200,000 | $234 | 57 |
| 1112 N Driver St | 0.62mi | 2/1.0 | 1,036 (+7%) | 4mo | $268,500 | $259 | 56 |
| 1904 Hart St | 0.70mi | 2/2.0 | 998 (+3%) | 7mo | $315,000 | $316 | 52 |
| 1309 N Hyde Park Ave | 0.57mi | 3/1.0 (+1) | 875 (-10%) | 7mo | $175,000 | $200 | 47 |
| 610 N Driver St | 0.49mi | 2/1.0 | 1,099 (+14%) | 11mo | $305,000 | $278 | 45 |
| 1010 Cole St | 0.75mi | 3/2.0 (+1) | 1,041 (+8%) | 0mo | $275,000 | $264 | 43 |
| 1915 Taylor St | 0.63mi | 3/2.0 (+1) | 1,050 (+8%) | 8mo | $282,500 | $269 | 41 |
| 1704 E Main St | 0.57mi | 3/2.0 (+1) | 1,107 (+14%) | 2mo | $205,000 | $185 | 39 |
| 1011 Lowry Ave | 0.39mi | 3/2.0 (+1) | 1,106 (+14%) | 14mo | $300,000 | $271 | 38 |
Match score weights: distance 35% · size 25% · config 20% · recency 20%. Top-matched comps best support the ARV.
Projected returns pro-forma
-3.0% appreciation · 3.25% rent growth · sell at horizon
- IRR
- 12.3%
- Equity multiple
- 1.49×
- Total profit
- $17,147
- Equity at exit
- $18,623
- IRR
- 21.4%
- Equity multiple
- 2.84×
- Total profit
- $64,483
- Equity at exit
- $10,799
Cash invested: $34,972 (down + closing). Projections, not guarantees.
Landlord ↔ Tenant lean methodology
- Overall (STATE)
- 85 Strongly Landlord-Friendly
- State North Carolina
- 85 Strongly Landlord-Friendly · R+3
- County
- — inherits STATE
- City
- — inherits STATE
ZIP-level market 27701
- Rents YoY
- 3.2%
- Active inventory
- 197
- Price-to-rent
- 5.7×
Monthly cashflow live
- Estimated rent
- $1,839 high interval (Pro) →
- Mortgage (P&I)
- −$655
- Tax from tax record
- −$167 /mo · $2,002/yr
- Insurance
- −$52
- HOA
- −$0
- Vacancy / Maint / Mgmt
- −$386
- Net cashflow
- $579
Break-even live
UW: 25.0% down · 7.5% · 30yr · 1.5% tax · 5.0% vac · 8.0% maint · 8.0% mgmt
Financing live
Cash to close
- Down payment
- $31,225
- Closing costs
- $3,747
- Reserves months
- —
- Total cash needed
- —
Loan-product check · same deal, 3 products live
Conventional
25% down · 7.5% · 30yr
- Down + closing
- —
- Monthly P&I
- —
- Monthly cashflow
- —
- DSCR
- —
- Eligible?
- —
Personal DTI + credit; lowest rate.
DSCR
20% down · 8.5% · 30yr
- Down + closing
- —
- Monthly P&I
- —
- Monthly cashflow
- —
- DSCR
- —
- Eligible?
- —
No personal income docs; deal must DSCR.
Hard money
10% down · 12.0% · 12mo
- Down + closing
- —
- Monthly P&I
- —
- Monthly cashflow
- —
- DSCR
- —
- Eligible?
- —
Short-term bridge; refi at stabilization.
Rent comps 40 comps
| Address | Beds | Baths | Sqft | Rent | $/sqft | DOM | Units | Dist |
|---|---|---|---|---|---|---|---|---|
| 721 Liberty St Unit C Durham, NC | 2.0 | 1.0 | 800 | $1,495 | $1.87 | 23d | 1 | 0.10mi |
| 807 E Main St Durham, NC | 1.0 | 1.0 | 1000 | $1,695 | $1.70 | 23d | 2 | 0.20mi |
| 600 N Hyde Park Ave Unit A Durham, NC | 1.0 | 1.0 | 570 | $1,000 | $1.75 | 23d | 1 | 0.30mi |
| 506 Gurley St Unit A Durham, NC | 2.0 | 1.0 | 775 | $1,300 | $1.68 | 14d | 1 | 0.43mi |
| 500 E Main St Durham, NC | 3.0 | 1.0–2.0 | 1002 | $2,920 | $2.91 | 14d | 40 | 0.44mi |
| 103 Young Ave Durham, NC | 1.0 | 1.0 | 600 | $945 | $1.57 | 23d | 1 | 0.50mi |
| 607 Dowd St Durham, NC | 2.0 | 1.0 | 720 | $1,550 | $2.15 | 23d | 1 | 0.59mi |
| 510 E Pettigrew St Durham, NC | 3.0 | 1.0–2.0 | 996 | $2,510 | $2.52 | 14d | 29 | 0.63mi |
| 464 E Pettigrew St Durham, NC | 2.0 | 2.0 | 1091 | $2,786 | $2.55 | 14d | 1 | 0.64mi |
| 504 E Pettigrew St Durham, NC | 2.0 | 1.0–2.0 | 1025 | $2,219 | $2.16 | 14d | 35 | 0.67mi |
| 504 E Pettigrew St Durham, NC | 3.0 | 1.0–2.0 | 1092 | $2,255 | $2.07 | 21d | 30 | 0.67mi |
| 208 Gray Ave Apt 4H Durham, NC | 2.0 | 1.0 | 800 | $1,250 | $1.56 | 23d | 1 | 0.67mi |
| 441 S Dillard St Durham, NC | 1.0–3.0 | 1.0–2.5 | 1153 | $2,454 | $2.13 | 14d | 21 | 0.69mi |
| 1600 N Alston Ave Unit C Durham, NC | 2.0 | 1.0 | 800 | $1,150 | $1.44 | 14d | 1 | 0.72mi |
| 910 Fiske St Unit B Durham, NC | 2.0 | 1.0 | 750 | $1,025 | $1.37 | 23d | 1 | 0.77mi |
| 916 Fiske St Unit A Durham, NC | 2.0 | 1.0 | 800 | $1,050 | $1.31 | 23d | 1 | 0.79mi |
| 1609 Evergreen St Durham, NC | 2.0 | 1.0 | 1051 | $1,695 | $1.61 | 21d | 1 | 0.79mi |
| 201 Raynor St Durham, NC | 1.0 | 1.0 | 600 | $1,150 | $1.92 | 23d | 1 | 0.82mi |
| 110 N Corcoran St Durham, NC | 1.0–2.0 | 1.0–2.0 | 1219 | $4,594 | $3.77 | 14d | 8 | 0.84mi |
| 905 Bunn Ter Durham, NC | 1.0 | 1.0 | 560 | $875 | $1.56 | 23d | 1 | 0.85mi |
| 511 S Mangum St Durham, NC | 3.0 | 1.0–2.0 | 1159 | $3,278 | $2.83 | 14d | 29 | 0.85mi |
| 2113 Angier Ave Apt B Durham, NC | 2.0 | 1.0 | 925 | $1,300 | $1.41 | 23d | 1 | 0.91mi |
| 703 S Roxboro St Durham, NC | 2.0 | 1.0–2.0 | 1113 | $1,696 | $1.52 | 23d | 16 | 0.92mi |
| 1828 Liberty St Unit B Durham, NC | 2.0 | 1.0 | 1100 | $1,450 | $1.32 | 14d | 1 | 0.92mi |
| 1516 London Cir Durham, NC | 3.0 | 1.0 | 1118 | $1,650 | $1.48 | 23d | 1 | 0.94mi |
| 311 W Corporation St Durham, NC | 2.0 | 1.0–2.0 | 691 | $3,505 | $5.07 | 21d | 5 | 0.95mi |
| 311 W Corporation St Unit 3-201 Durham, NC | 2.0 | 2.0 | 985 | $3,355 | $3.41 | 23d | 1 | 0.95mi |
| 321 W Corporation St Durham, NC | 2.0 | 2.0 | 977 | $2,530 | $2.59 | 14d | 1 | 0.95mi |
| 2408 Hart St Durham, NC | 3.0 | 1.0 | 960 | $1,445 | $1.51 | 23d | 1 | 0.95mi |
| 200 W Geer St Unit 200-C Durham, NC | 2.0 | 1.0 | 850 | $1,400 | $1.65 | 14d | 1 | 0.98mi |
| 3 Fisher Pl Durham, NC | 2.0 | 1.5 | 752 | $1,100 | $1.46 | 23d | 1 | 0.98mi |
| 318 W Corporation St Durham, NC | 3.0 | 1.0–2.0 | 900 | $2,934 | $3.26 | 14d | 55 | 1.00mi |
| 815 Madison St Durham, NC | 2.0 | 1.0–2.0 | 859 | $2,854 | $3.32 | 21d | 5 | 1.01mi |
| 530 Foster St Durham, NC | 2.0 | 1.0–2.0 | 918 | $2,750 | $3.00 | 14d | 18 | 1.02mi |
| 115 Morris St #1908 Durham, NC | 1.0 | 1.0 | 750 | $2,600 | $3.47 | 23d | 1 | 1.03mi |
| 704 Bacon St Durham, NC | 2.0 | 1.0 | 744 | $1,495 | $2.01 | 23d | 1 | 1.03mi |
| 115 Morris St Durham, NC | 1.0–2.0 | 1.0–2.0 | 1066 | $7,661 | $7.18 | 14d | 76 | 1.03mi |
| 2313 Owen St Unit A Durham, NC | 1.0 | 1.0 | 600 | $1,095 | $1.82 | 23d | 1 | 1.04mi |
| 2309 Owen St Unit B Durham, NC | 1.0 | 1.0 | 600 | $1,095 | $1.82 | 23d | 1 | 1.05mi |
| 545 Foster St Durham, NC | 2.0 | 1.0–2.0 | 910 | $2,722 | $2.99 | 14d | 2 | 1.06mi |
Listing history 26 events
-
2026-05-08status Pending
-
2026-04-17$124,900 Active
-
2021-01-11soldstatus $65,000
-
2014-02-13soldstatus $29,900 Closed 130-char remark
Show marketing remark (130 chars)
Very Good Rental Opportunity. Home is in very good condition. Off street parking. Owner financing available with acceptable offer.
-
2014-01-25status Pending 130-char remark
Show marketing remark (130 chars)
Very Good Rental Opportunity. Home is in very good condition. Off street parking. Owner financing available with acceptable offer.
-
2014-01-16$29,900 Active 130-char remark
Show marketing remark (130 chars)
Very Good Rental Opportunity. Home is in very good condition. Off street parking. Owner financing available with acceptable offer.
-
2013-10-21historical
-
2013-07-23price $37,500
-
2013-07-05price $39,900
-
2013-06-24price $45,000
-
2013-05-06price $49,900
-
2013-04-24$55,000 Active
-
2010-09-06historical
-
2010-03-12$29,000
-
2009-01-01historical
-
2008-08-07$35,500
-
2008-08-01historical
-
2008-06-25$45,000
-
2005-06-13soldstatus $7,000
-
2005-06-02historical
-
2005-02-10historical
-
2005-01-20$10,000
-
2004-08-20$17,500
-
2002-05-15soldstatus $70,000
-
2000-11-28soldstatus $35,000
-
2000-03-02soldstatus $101,250
ⓘ Source: listings_history table (triggers on properties + properties_extension) + one-shot
backfill from property_details.listing_events for pre-trigger history.
Tax reassessment forecast NC · Resets to sale price
- Current annual tax
- $2,002 · $167/mo
- Projected year-2 tax
- $2,002 · $167/mo
- Expected delta
- $0/yr ($0/mo · 0.0%)
ⓘ Screening estimate from a state-policy table — verify with the county assessor before closing.
Climate risk First Street
- Flood 1/10 Low FEMA zone X (unshaded) · 0% chance over 30 yrs
- Wildfire 1/10 Low
- Heat 6/10 Major 7 d/yr ≥106°F today · 16 d/yr by 30 yrs out
- Wind 6/10 Major 27% chance of damaging wind over 30 yrs
- Air quality 2/10 Low 1 unhealthy d/yr today · 1 by 30 yrs out
Nearby sold comps map
Loading sold comps map…
Walkable amenities ~0.75 mi
Loading nearby amenities…
Taxation est. · year 1
- Rental income
- $22,072
- − Mortgage interest
- −$6,996
- − Property taxes
- −$2,002
- − Insurance
- −$624
- − Repairs & maintenance
- −$1,766
- − Management
- −$1,766
- − Depreciation
- −$3,633
- Taxable income
- $5,284
- Est. tax owed @ 24.0%
- −$1,268
- After-tax cash flow
- $5,682/yr
For passive investors: Depreciation is non-cash, so a rental often shows a tax loss while cash-flowing — sheltering income. Rental losses are passive: they offset passive income freely, and up to $25,000/yr can offset ordinary (W-2) income if you actively participate and your MAGI is under $100k (phasing out to $0 by $150k); unused losses carry forward. On sale, claimed depreciation is recaptured at up to 25%, and gains may owe capital-gains tax (a 1031 exchange can defer both). Figures are a year-1 estimate at your 24.0% rate — not tax advice; consult a CPA.
Schools (NCES district)
- District
- Durham Public Schools
- NCES district ID
- 3701260
- Math proficiency
- 29% ▼ -3.00%
- Reading proficiency
- 39% ▲ 2.00%
- Median HH income
- $52,143
- Composite
- 29.69/100
- National rank
- #6457
- State rank
- #132 of 178 in NC
Livability — Durham
- Score
- 81/100
- State rank
- #15
- US rank
- #1411
Category grades
Schools grade is shown separately in the Schools card above.
Census & demographics
- Census place
- Durham, NC
- County
- Durham County · 288,747 people
- City population
- 288,747
- Metro
- Durham-Chapel Hill, NC
- Population (ZIP)
- 24,793
- Household income
- $69,740
- Rent vs Own
- Severe rent burden
- 1402.0
Population outlook (Durham County) Hauer SSP2
- Today (2025)
- 368,962 people
- By 2030
- 402,686 · +9.1%
- By 2040
- 468,677 · +27.0%
- By 2050
- 531,727 · +44.1%
- By 2075
- 660,446 · +79.0%
- By 2100
- 739,971 · +100.6%
Race, ethnicity, and origin ACS 2023
- Neighborhood character
- Diverse neighborhood (Simpson 0.69)
- Race & ethnicity
- White 40% Black 32% Hispanic / Latino 19% Two or more races 9% Asian 3%
- Hispanic origin (detail)
- Mexican 9%
- Common ancestry
- Romanian 2% Italian 2% Slovak 2%
- Foreign-born
- 18% · Canada, Vietnam
- Languages at home
- 76% English-only · Spanish 18% Other Indo-European 2% German/W. Germanic 1%
Political lean MEDSL · Durham
- 2024 margin
- Solid D (+61.9) · D 80.2% · R 18.2% · Other 1.6%
- 2008→2024 swing
- +10.0pp toward D · 2008: 51.9pp · 2024: 61.9pp
- All cycles
- 2024: D+61.9 2020: D+62.4 2016: D+60.4 2012: D+52.7 2008: D+51.9
Not yet ingested
- Civics
- —
Market trends
- HPI YoY
- ▼ -272.19%
- Current HPI
- 347.5371
- Rent YoY
- ▲ 3.25%
- Metro
- Durham-Chapel Hill, NC
- State GDP YoY
- ▲ 3.28%
- F500 in state
- 26
Industry mix (Fortune 500 HQ in NC)
| Industry | F500 HQs | Revenue |
|---|---|---|
| Financial Services | 2 | $213B |
|
||
| Retail | 2 | $95B |
|
||
| Industrial Conglomerate | 1 | $38B |
|
||
| Metals / Steel | 1 | $35B |
|
||
| Utilities | 1 | $30B |
|
||
| Industrial Machinery | 1 | $19B |
|
||
Price history
+23.4% since first listed26 events — show timeline
- 2026-05-08 Pending — TMLS
- 2026-04-17 Listed $124,900 TMLS
- 2021-01-11 Sold (Public Records) $65,000 Public Records
- 2014-02-13 Sold (MLS) $29,900 TMLS
- 2014-01-25 Pending — TMLS
- 2014-01-16 Listed $29,900 TMLS
- 2013-10-21 Listing Removed — TMLS
- 2013-07-23 Price Changed $37,500 TMLS
- 2013-07-05 Price Changed $39,900 TMLS
- 2013-06-24 Price Changed $45,000 TMLS
- 2013-05-06 Price Changed $49,900 TMLS
- 2013-04-24 Listed $55,000 TMLS
- 2010-09-06 Listing Removed — TMLS
- 2010-03-12 Listed $29,000 TMLS
- 2009-01-01 Listing Removed — TMLS
- 2008-08-07 Listed $35,500 TMLS
- 2008-08-01 Listing Removed — TMLS
- 2008-06-25 Listed $45,000 TMLS
- 2005-06-13 Sold (MLS) $7,000 TMLS
- 2005-06-02 Listing Removed — TMLS
- 2005-02-10 Listing Removed — TMLS
- 2005-01-20 Listed $10,000 TMLS
- 2004-08-20 Listed $17,500 TMLS
- 2002-05-15 Sold (Public Records) $70,000 Public Records
- 2000-11-28 Sold (Public Records) $35,000 Public Records
- 2000-03-02 Sold (Public Records) $101,250 Public Records
Property tax history
+9.7%/yrLatest (2025): $2,002 · +37.1% YoY. Source: county tax records.
Cash-flow waterfall
monthlySold comps — $/sqft
last 12 mo · ≤1 miLoading sold comps…