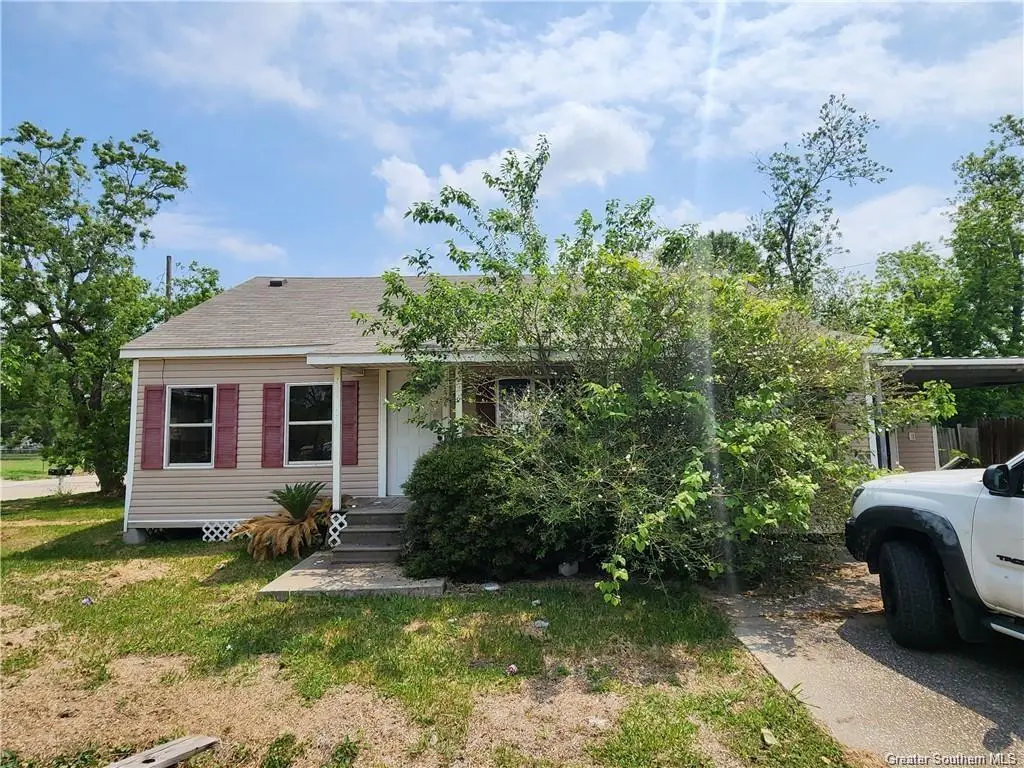
324 Virginia St · Sulphur, LA
Flood risk 1/10 · Minimal
- FEMA flood zone
- X (unshaded)
- Chance of flooding over 30 yrs
- 0.0%
- Est. flood insurance / yr
- $507 – $1,088
Fire risk 3/10 · Minor
- Est. fire insurance / yr
- $1,269 – $2,357
Heat risk 9/10 · Severe
- Hot days now (above 109°F)
- 7 days/yr
- Hot days in 30 yrs
- 24 days/yr
Wind risk 9/10 · Severe
- Chance of severe wind over 30 yrs
- 99.0%
Air-quality risk 2/10 · Minimal
- Unhealthy air days now
- 1 days/yr
- Unhealthy air days in 30 yrs
- 1 days/yr
Risk factors via First Street. Map © Google.
Why this score? — see what drove the B grade
The composite is a weighted blend of 9 inputs, each scored 0–100. Each bar is that input's sub-score; the figure is the points it added to the 100-point composite (weight × sub-score).
- Cash flow +30.0/30.0
- 1% rule +10.0/10.0
- DSCR +10.0/10.0
- ARV discount +7.5/15.0
- Rent growth +4.4/5.0
- Livability +3.6/5.0
- Schools +3.1/10.0
- Condition / age +2.5/5.0
- Appreciation +0.0/10.0
$35,000
🖨 Deal sheet (PDF) 📄 Offer letter ✓ Due diligence
Listing remarks MLS
Investor special! This home has been mostly gutted and is ready for your vision! Set up for 3 bedrooms and 1 bath, but could be made into a 3 bedroom 2 bath! Bring your imagination and investor spirit to this potential flip!
Key facts
- 4,792 sq ft lot
- Built 1980
- Listed 320 days
Neighborhood map
What this means for you Summary
Snapshot
- This is a 3-bed/1.0-bath single-family listed at $35k.
Deal economics
- At list price, monthly cash flow is $670 ($8k/yr) — positive.
- The deal already cash-flows at list — no discount required.
- Meets the 1% rule at list price ($1k rent vs $35k).
- Recommended offer: $31k (12.0% below list) — sets the bar for market timing.
- Cap rate 29.3% vs local median 8.8% in Sulphur — top-decile yield for the area; either an underpriced asset or a hidden risk that comps aren't pricing in. Stress-test before assuming the spread holds.
Location & tenants
- Location reads 71/100 on livability (#48 in LA) — a middle-class / working-renter tenant base. Strengths: cost of living A+, housing A+, health & safety A; Watch: crime D-, amenities F, commute F.
- Calcasieu Parish (other): math 30% / reading 44% proficiency, ranked #29 of 98 in LA (top 30%) — families likely to look elsewhere, expect single-tenant / working-renter base with shorter leases.
- Zoned schools: E. K. Key Elementary School (math 38% / reading 45%, grade F, #212 of 646 statewide, top 33%, 533 students, 64% FRL); Leblanc Middle School (math 23% / reading 45%, grade F, #95 of 218 statewide, top 45%, 399 students, 62% FRL); Sulphur High School (math 36% / reading 53%, grade F, #58 of 265 statewide, top 23%, 2,043 students, 47% FRL).
- Market conditions: Rents rising fast (+7.7%/yr); 294 active listings in the ZIP; 3 comparable units currently listed for rent nearby; rentals at typical pace (median 15d on market — plan ~3-4 weeks tenant-placement turnaround); 1,298 units permitted in Calcasieu Parish in 2024 (526 in 5+ unit buildings).
Forward outlook
- Local home prices are declining (-3.0%/yr); year-one equity from $242 of loan paydown is wiped out by about $1k of value loss. Plan a longer hold.
- Calcasieu County population projected at +11% by 2050 — modest demand growth; plan on rents tracking national, not racing it.
- At projected returns (-3.0% appreciation + 7.7% rent growth), your $10k cash investment doubles in ~2 years — after that, you're playing with house money.
Negotiation context
- It's been on market 320 days — a 12% lower offer ($31k) is reasonable based on typical stale-listing flexibility.
Risks & watch-outs
- Climate carrying-cost: severe wind risk, 99% chance of damaging wind over 30y; extreme-heat days projected 7→24/yr by 2055 (HVAC capex compounding) — expect insurance premiums to compound above CPI over the hold.
Questions for the listing agent
- It's been on market 320 days. Have you received any prior offers? Is the seller open to a 12% concession, seller financing, or rate buy-down credit?
- Why hasn't it sold? Are there any deal-killer items the seller is aware of (foundation, flood, title, zoning, code violations)?
- Is there a deadline driving the sale (1031 exchange, divorce, estate, relocation)? That informs how much negotiation room exists.
- Schools are A-rated — typically a magnet for longer-tenancy family renters. What's the average tenant stay here, and is there a school-zone premium baked into asking?
- Crime grade is D in this area — have there been break-ins, vandalism, or insurance claims at this property in the last 3 years? What carrier currently insures it and at what premium?
- What's the average days-on-market for RENTAL listings here right now (not sales)? A rising rental-DOM trend means longer vacancies and softer asking-rent achievability than the comps imply.
- What's the recent tenant-quality profile in this submarket — average credit score on applications, eviction rate, late-payment / NSF rate, and stable-employment percentage? A property-management company in the area should have these aggregated.
- How much new for-sale + rental construction is in the pipeline within 1–3 miles? Heavy new supply typically softens prices + rents 12–24 months out; constrained supply supports both.
Investment metrics
- 1% rule
- 3.39% ✓
- Cap rate
- 29.26%
- Cash-on-cash
- 82.03%
- DSCR
- 4.65
- GRM
- 2.5
CMA / ARV
- ARV (median comp)
- $118,326
- List price
- $35,000
- Delta
- -70.42%
- Verdict
- UNDERPRICED
- Comps
- 20 within 1.0 mi
Show comp detail 12 sales within ~0.75 mi
| Address | Dist | Beds/Ba | Sqft | Sold | Price | $/sf | Match |
|---|---|---|---|---|---|---|---|
| 207 N Johnson St N | 0.21mi | 3/1.5 | 1,206 (+2%) | 15mo | $120,000 | $100 | 73 |
| 310 Cherry St | 0.40mi | 3/2.0 | 1,211 (+2%) | 11mo | $170,000 | $140 | 65 |
| 560 N Crocker St N | 0.35mi | 3/1.0 | 1,080 (-9%) | 6mo | $92,500 | $86 | 64 |
| 839 Urban St | 0.43mi | 2/1.0 (-1) | 1,121 (-6%) | 4mo | $111,000 | $99 | 62 |
| 518 Cherry St | 0.44mi | 3/2.0 | 1,148 (-3%) | 11mo | $96,200 | $84 | 61 |
| 718 E Lyons St E | 0.26mi | 3/1.0 | 1,300 (+9%) | 14mo | $129,900 | $100 | 60 |
| 615 W Burton St St | 0.44mi | 3/1.0 | 1,315 (+11%) | 5mo | $109,999 | $84 | 58 |
| 728 W Lyons St W | 0.56mi | 3/1.0 | 1,305 (+10%) | 2mo | $73,000 | $56 | 56 |
| 1230 Sherwood Dr | 0.57mi | 3/1.0 | 1,280 (+8%) | 8mo | $115,500 | $90 | 54 |
| 802 E Carlton St St E | 0.48mi | 3/1.0 | 1,033 (-13%) | 5mo | $150,000 | $145 | 52 |
| 618 Phillips St | 0.65mi | 3/1.0 | 1,075 (-10%) | 13mo | $60,000 | $56 | 43 |
| 760 W Phillips St W | 0.71mi | 3/2.0 | 1,366 (+15%) | 9mo | $157,000 | $115 | 30 |
Match score weights: distance 35% · size 25% · config 20% · recency 20%. Top-matched comps best support the ARV.
Projected returns pro-forma
-3.0% appreciation · 7.65% rent growth · sell at horizon
- IRR
- 87.7%
- Equity multiple
- 5.37×
- Total profit
- $42,837
- Equity at exit
- $5,219
- IRR
- 91.9%
- Equity multiple
- 13.10×
- Total profit
- $118,619
- Equity at exit
- $3,026
Cash invested: $9,800 (down + closing). Projections, not guarantees.
Landlord ↔ Tenant lean methodology
- Overall (STATE)
- 90 Strongly Landlord-Friendly
- State Louisiana
- 90 Strongly Landlord-Friendly · R+12
- County
- — inherits STATE
- City
- — inherits STATE
ZIP-level market 70663
- Rents YoY
- 7.7%
- Active inventory
- 294
- Price-to-rent
- 2.5×
Monthly cashflow live
- Estimated rent
- $1,186 medium interval (Pro) →
- Mortgage (P&I)
- −$184
- Tax from tax record
- −$69 /mo · $826/yr
- Insurance
- −$15
- HOA
- −$0
- Vacancy / Maint / Mgmt
- −$249
- Net cashflow
- $670
Break-even live
Sensitivity live
| Price | -10% $690 | -5% $680 | +0% $670 | +5% $660 | +10% $650 |
|---|---|---|---|---|---|
| Rent | -10% $576 | -5% $623 | +0% $670 | +5% $717 | +10% $764 |
| Rate | -1.0pp $688 | -0.5pp $679 | base $670 | +0.5pp $661 | +1.0pp $652 |
UW: 25.0% down · 7.5% · 30yr · 1.5% tax · 5.0% vac · 8.0% maint · 8.0% mgmt
Financing live
Cash to close
- Down payment
- $8,750
- Closing costs
- $1,050
- Reserves months
- —
- Total cash needed
- —
Loan-product check · same deal, 3 products live
Conventional
25% down · 7.5% · 30yr
- Down + closing
- —
- Monthly P&I
- —
- Monthly cashflow
- —
- DSCR
- —
- Eligible?
- —
Personal DTI + credit; lowest rate.
DSCR
20% down · 8.5% · 30yr
- Down + closing
- —
- Monthly P&I
- —
- Monthly cashflow
- —
- DSCR
- —
- Eligible?
- —
No personal income docs; deal must DSCR.
Hard money
10% down · 12.0% · 12mo
- Down + closing
- —
- Monthly P&I
- —
- Monthly cashflow
- —
- DSCR
- —
- Eligible?
- —
Short-term bridge; refi at stabilization.
Rent comps 3 comps
| Address | Beds | Baths | Sqft | Rent | $/sqft | DOM | Units | Dist |
|---|---|---|---|---|---|---|---|---|
| 625 N Claiborne St Unit 1 Sulphur, LA | 3.0 | 2.0 | 1200 | $925 | $0.77 | 15d | 1 | 0.75mi |
| 1115 N Crocker St Sulphur, LA | 2.0 | 2.0 | 960 | $950 | $0.99 | 15d | 1 | 0.82mi |
| 309 W Mimosa Dr Sulphur, LA | 3.0 | 2.0 | 1310 | $1,500 | $1.15 | 15d | 1 | 1.49mi |
Listing history 19 events
-
2026-06-21days on market $35,000 Active 320 DOM
-
2026-06-19days on market $35,000 Active 318 DOM
-
2026-06-18days on market $35,000 Active 317 DOM
-
2026-06-17days on market $35,000 Active 316 DOM
-
2026-06-16days on market $35,000 Active 315 DOM
-
2026-06-15days on market $35,000 Active 314 DOM
-
2026-06-14days on market $35,000 Active 312 DOM
-
2026-06-13days on market $35,000 Active 311 DOM
-
2026-06-10days on market $35,000 Active 309 DOM
-
2026-06-09days on market $35,000 Active 308 DOM
-
2026-06-08days on market $35,000 Active 307 DOM
-
2026-06-07days on market $35,000 Active 306 DOM
-
2026-06-05days on market $35,000 Active 303 DOM
-
2026-06-02days on market $35,000 Active 301 DOM
-
2026-06-01days on market $35,000 Active 300 DOM
-
2026-05-31days on market $35,000 Active 299 DOM
-
2026-05-30days on market $35,000 Active 298 DOM
-
2025-01-27$35,000 Active 224-char remark
Show marketing remark (224 chars)
Investor special! This home has been mostly gutted and is ready for your vision! Set up for 3 bedrooms and 1 bath, but could be made into a 3 bedroom 2 bath! Bring your imagination and investor spirit to this potential flip!
-
1999-09-27soldstatus $51,500
ⓘ Source: listings_history table (triggers on properties + properties_extension) + one-shot
backfill from property_details.listing_events for pre-trigger history.
Tax reassessment forecast LA · Resets to sale price
- Current annual tax
- $826 · $69/mo
- Projected year-2 tax
- $826 · $69/mo
- Expected delta
- $0/yr ($0/mo · 0.0%)
ⓘ Screening estimate from a state-policy table — verify with the county assessor before closing.
Climate risk First Street
- Flood 1/10 Low FEMA zone X (unshaded) · 0% chance over 30 yrs
- Wildfire 3/10 Moderate
- Heat 9/10 Extreme 7 d/yr ≥109°F today · 24 d/yr by 30 yrs out
- Wind 9/10 Extreme 99% chance of damaging wind over 30 yrs
- Air quality 2/10 Low 1 unhealthy d/yr today · 1 by 30 yrs out
Nearby sold comps map
Loading sold comps map…
Walkable amenities ~0.75 mi
Loading nearby amenities…
Taxation est. · year 1
- Rental income
- $14,231
- − Mortgage interest
- −$1,961
- − Property taxes
- −$826
- − Insurance
- −$175
- − Repairs & maintenance
- −$1,138
- − Management
- −$1,138
- − Depreciation
- −$1,018
- Taxable income
- $7,974
- Est. tax owed @ 24.0%
- −$1,914
- After-tax cash flow
- $6,125/yr
For passive investors: Depreciation is non-cash, so a rental often shows a tax loss while cash-flowing — sheltering income. Rental losses are passive: they offset passive income freely, and up to $25,000/yr can offset ordinary (W-2) income if you actively participate and your MAGI is under $100k (phasing out to $0 by $150k); unused losses carry forward. On sale, claimed depreciation is recaptured at up to 25%, and gains may owe capital-gains tax (a 1031 exchange can defer both). Figures are a year-1 estimate at your 24.0% rate — not tax advice; consult a CPA.
Schools (NCES district)
- District
- Calcasieu Parish
- NCES district ID
- 2200330
- Math proficiency
- 30% ▼ -39.00%
- Reading proficiency
- 44% ▼ -33.00%
- Median HH income
- $44,700
- Composite
- 31.45/100
- National rank
- #5979
- State rank
- #29 of 98 in LA
Livability — Sulphur
- Score
- 71/100
- State rank
- #48
- US rank
- #7164
Category grades
Schools grade is shown separately in the Schools card above.
Census & demographics
- Census place
- Sulphur, LA
- County
- Calcasieu Parish · 170,889 people
- City population
- 27,799
- Metro
- Lake Charles, LA
- Population (ZIP)
- 27,799
- Household income
- $64,707
- Rent vs Own
- Severe rent burden
- 197.0
Population outlook (Calcasieu County) Hauer SSP2
- Today (2025)
- 212,179 people
- By 2030
- 218,199 · +2.8%
- By 2040
- 228,486 · +7.7%
- By 2050
- 236,208 · +11.3%
- By 2075
- 251,696 · +18.6%
- By 2100
- 247,848 · +16.8%
Race, ethnicity, and origin ACS 2023
- Neighborhood character
- Predominantly White (82%)
- Race & ethnicity
- White 82% Black 8% Hispanic / Latino 5% Two or more races 4%
- Common ancestry
- Lithuanian 13% Slovak 2% Scandinavian 1%
- Foreign-born
- 3% · Canada, Vietnam
- Languages at home
- 94% English-only · Spanish 2% French/Haitian/Cajun 2% Other Indo-European 1%
Political lean MEDSL · Calcasieu
- 2024 margin
- Solid R (+39.6) · D 29.5% · R 69.0% · Other 1.5%
- 2008→2024 swing
- -15.0pp toward R · 2008: -24.6pp · 2024: -39.6pp
- All cycles
- 2024: R+39.6 2020: R+35.2 2016: R+33.3 2012: R+28.7 2008: R+24.6
Not yet ingested
- Civics
- —
Market trends
- HPI YoY
- ▼ -104.29%
- Current HPI
- 100.0895
- Rent YoY
- ▲ 7.65%
- Metro
- Lake Charles, LA
- State GDP YoY
- ▲ 3.29%
- F500 in state
- 10
Industry mix (Fortune 500 HQ in LA)
| Industry | F500 HQs | Revenue |
|---|---|---|
| Telecommunications | 2 | $23B |
|
||
| Utilities | 1 | $12B |
|
||
| Wholesale / Distribution | 1 | $5B |
|
||
| Advertising | 1 | $2B |
|
||
Price history
-32.0% since first listed2 events — show timeline
- 2025-01-27 Listed $35,000 SWLAR
- 1999-09-27 Sold (Public Records) $51,500 Public Records
Property tax history
-0.7%/yrLatest (2025): $826 · +0.8% YoY. Source: county tax records.
Cash-flow waterfall
monthlySold comps — $/sqft
last 12 mo · ≤1 miLoading sold comps…