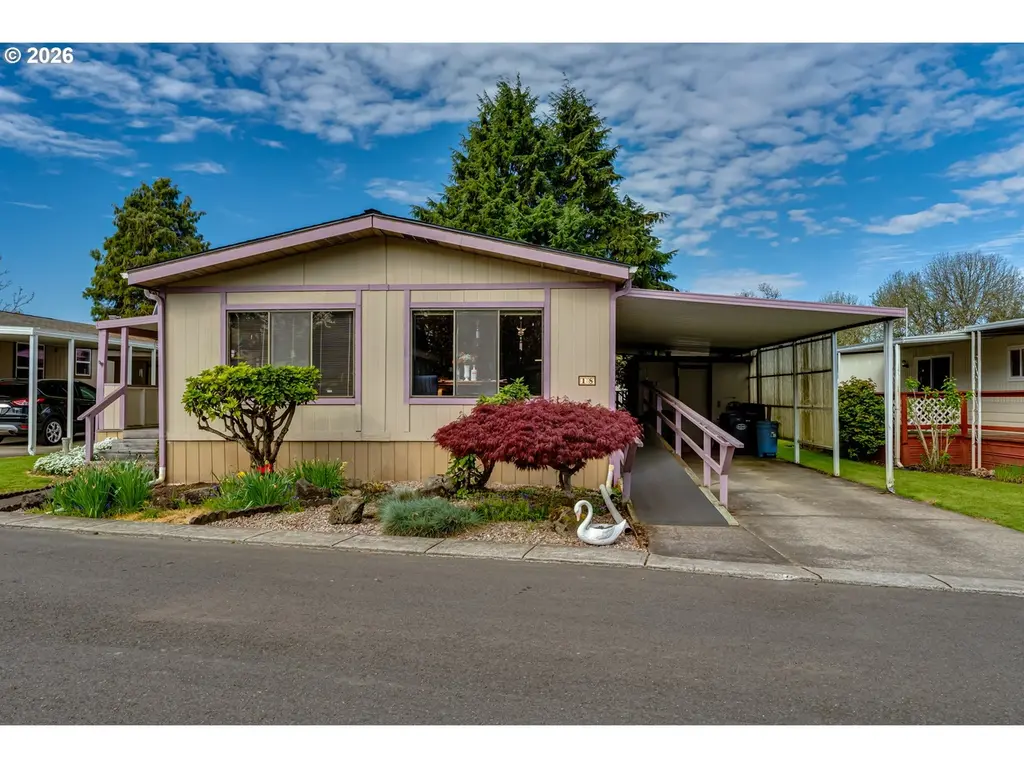
1225 W 10th Ave #18 · Junction City, OR
Flood risk 6/10 · Moderate
- FEMA flood zone
- X (unshaded)
- Chance of flooding over 30 yrs
- 0.57%
- Est. flood insurance / yr
- $507 – $1,088
Fire risk 1/10 · Minimal
- Est. fire insurance / yr
- $498 – $926
Heat risk 4/10 · Minor
- Hot days now (above 92°F)
- 7 days/yr
- Hot days in 30 yrs
- 14 days/yr
Wind risk 1/10 · Minimal
- Chance of severe wind over 30 yrs
- —
Air-quality risk 10/10 · Severe
- Unhealthy air days now
- 12 days/yr
- Unhealthy air days in 30 yrs
- 13 days/yr
Risk factors via First Street. Map © Google.
Why this score? — see what drove the B+ grade
The composite is a weighted blend of 9 inputs, each scored 0–100. Each bar is that input's sub-score; the figure is the points it added to the 100-point composite (weight × sub-score).
- Cash flow +30.0/30.0
- ARV discount +15.0/15.0
- 1% rule +10.0/10.0
- DSCR +10.0/10.0
- Livability +4.1/5.0
- Schools +2.9/10.0
- Rent growth +2.5/5.0
- Condition / age +2.5/5.0
- Appreciation +0.0/10.0
$62,000
🖨 Deal sheet 📄 Offer letter ✓ Due diligence
Listing remarks MLS
Welcome to this 3 bed, 2 bath manufactured home in the highly sought-after 55+ community of Scandia Village! Offering 1,440 sq ft of comfortable living space, this 1978 manufactured home features a bright sunroom, a cozy pellet stove in the family room, and an efficient heat pump for year-round comfort. The home also includes a brand new roof, a pellet stove as well as handicap-accessible ramp installed just 4 years ago. Enjoy a beautifully kept park setting with a true sense of community—this is easy living at its best!
Key facts
- Heat pump
- Park setting
- Sunroom
Tags
Neighborhood map
What this means for you Summary
Snapshot
- This is a 3-bed/2.0-bath manufactured listed at $62k.
Deal economics
- At list price, monthly cash flow is $803 ($10k/yr) — positive.
- The deal already cash-flows at list — no discount required.
- Meets the 1% rule at list price ($2k rent vs $62k).
- Recommended offer: $58k (6.0% below list) — sets the bar for market timing.
- Cap rate 21.8% vs local median 2.7% in Junction City — top-decile yield for the area; either an underpriced asset or a hidden risk that comps aren't pricing in. Stress-test before assuming the spread holds.
Location & tenants
- Location reads 82/100 on livability (#46 in OR, #1,184 nationally) — a professional / high-income tenant draw. Strengths: housing A+, health & safety A+, cost of living B+; Watch: schools D.
- Junction City SD 69 (town): math 26% / reading 41% proficiency, ranked #27 of 58 in OR (top 47%) — families likely to look elsewhere, expect single-tenant / working-renter base with shorter leases.
- Market conditions: 84 active listings in the ZIP; 6 comparable units currently listed for rent nearby; rentals lingering (median 44d on market — plan ~5-8 weeks vacancy on turnover, expect pricing pressure); 50% of comp listings sitting > 30 days — soft ceiling on asking rent; 1,808 units permitted in Lane County in 2024 (972 in 5+ unit buildings).
Forward outlook
- Local home prices are declining (-3.0%/yr); year-one equity from $429 of loan paydown is wiped out by about $2k of value loss. Plan a longer hold.
- Lane County population projected at +15% by 2050 — long-run rental-demand tailwind backs the buy-and-hold thesis.
- At projected returns (-3.0% appreciation + 3.0% rent growth), your $17k cash investment doubles in ~3 years — after that, you're playing with house money.
Negotiation context
- It's been on market 64 days — a 6% lower offer ($58k) is reasonable based on typical stale-listing flexibility.
- 5 sale attempts since 23y ago with the ask held roughly flat each time — persistent listings suggest the price (not the market) is what's stuck; bring a comps-based counter.
- Current owner paid $31k; list at $62k implies a 100% gain — meaningful room to come down on a strong offer.
Risks & watch-outs
- Climate carrying-cost: major flood risk — expect insurance premiums to compound above CPI over the hold.
Questions for the listing agent
- It's been on market 64 days. Have you received any prior offers? Is the seller open to a 6% concession, seller financing, or rate buy-down credit?
- Built in 1978 — when were the roof, HVAC, electrical panel, plumbing, and water heater last replaced?
- Why hasn't it sold? Are there any deal-killer items the seller is aware of (foundation, flood, title, zoning, code violations)?
- Is there a deadline driving the sale (1031 exchange, divorce, estate, relocation)? That informs how much negotiation room exists.
- Schools are D-rated, which usually means shorter tenancies and higher turnover. Who's the typical renter profile here, and what's been the actual vacancy rate?
- What's the average days-on-market for RENTAL listings here right now (not sales)? A rising rental-DOM trend means longer vacancies and softer asking-rent achievability than the comps imply.
- What's the recent tenant-quality profile in this submarket — average credit score on applications, eviction rate, late-payment / NSF rate, and stable-employment percentage? A property-management company in the area should have these aggregated.
- How much new for-sale + rental construction is in the pipeline within 1–3 miles? Heavy new supply typically softens prices + rents 12–24 months out; constrained supply supports both.
Investment metrics
- 1% rule
- 2.49% ✓
- Cap rate
- 21.83%
- Cash-on-cash
- 55.48%
- DSCR
- 3.47
- GRM
- 3.3
CMA / ARV
- ARV (median comp)
- $100,222
- List price
- $62,000
- Delta
- -38.14%
- Verdict
- UNDERPRICED
- Comps
- 6 within 1.0 mi
Show comp detail 11 sales within ~0.75 mi
| Address | Dist | Beds/Ba | Sqft | Sold | Price | $/sf | Match |
|---|---|---|---|---|---|---|---|
| 1225 W 10th Ave #49 | 0.00mi | 3/2.0 | 1,536 (+7%) | 2mo | $65,000 | $42 | 87 |
| 1225 W 10th Ave #53 | 0.00mi | 2/2.0 (-1) | 1,536 (+7%) | 4mo | $80,000 | $52 | 80 |
| 310 Pitney Ln #40 | 0.44mi | 3/2.0 | 1,500 (+4%) | 4mo | $130,000 | $87 | 69 |
| 1225 W 10th Ave #44 | 0.00mi | 2/2.0 (-1) | 1,344 (-7%) | 24mo | $75,000 | $56 | 64 |
| 310 Pitney Ln #52 | 0.55mi | 3/2.0 | 1,512 (+5%) | 10mo | $184,500 | $122 | 58 |
| 310 Pitney Ln #62 | 0.44mi | 4/2.0 (+1) | 1,512 (+5%) | 21mo | $185,000 | $122 | 49 |
| 310 Pitney Ln #84 | 0.58mi | 3/2.0 | 1,553 (+8%) | 14mo | $215,000 | $138 | 48 |
| 310 Pitney Ln #1 | 0.44mi | 3/2.0 | 1,248 (-13%) | 11mo | $123,500 | $99 | 48 |
| 310 Pitney Ln #13 | 0.44mi | 2/2.0 (-1) | 1,521 (+6%) | 23mo | $203,500 | $134 | 46 |
| 310 Pitney Ln | 0.52mi | 4/2.0 (+1) | 1,512 (+5%) | 22mo | $173,900 | $115 | 44 |
| 310 Pitney Ln #70 | 0.58mi | 4/2.0 (+1) | 1,512 (+5%) | 22mo | $173,900 | $115 | 42 |
Match score weights: distance 35% · size 25% · config 20% · recency 20%. Top-matched comps best support the ARV.
Projected returns pro-forma
-3.0% appreciation · 3.0% rent growth · sell at horizon
- IRR
- 53.8%
- Equity multiple
- 3.37×
- Total profit
- $41,089
- Equity at exit
- $9,244
- IRR
- 58.9%
- Equity multiple
- 6.86×
- Total profit
- $101,669
- Equity at exit
- $5,361
Cash invested: $17,360 (down + closing). Projections, not guarantees.
Landlord ↔ Tenant lean methodology
- Overall (STATE)
- 28 Tenant-Leaning
- State Oregon
- 28 Tenant-Leaning · D+6
- County
- — inherits STATE
- City
- — inherits STATE
ZIP-level market 97448
- Home prices YoY
- -35.0%
- Active inventory
- 84
- Price-to-rent
- 3.3×
Monthly cashflow live
- Estimated rent
- $1,543 high interval (Pro) →
- Mortgage (P&I)
- −$325
- Tax from tax record
- −$65 /mo · $781/yr
- Insurance
- −$26
- HOA
- −$0
- Vacancy / Maint / Mgmt
- −$324
- Net cashflow
- $803
Break-even live
UW: 25.0% down · 7.5% · 30yr · 1.5% tax · 5.0% vac · 8.0% maint · 8.0% mgmt
Financing live
Cash to close
- Down payment
- $15,500
- Closing costs
- $1,860
- Reserves months
- —
- Total cash needed
- —
Loan-product check · same deal, 3 products live
Conventional
25% down · 7.5% · 30yr
- Down + closing
- —
- Monthly P&I
- —
- Monthly cashflow
- —
- DSCR
- —
- Eligible?
- —
Personal DTI + credit; lowest rate.
DSCR
20% down · 8.5% · 30yr
- Down + closing
- —
- Monthly P&I
- —
- Monthly cashflow
- —
- DSCR
- —
- Eligible?
- —
No personal income docs; deal must DSCR.
Hard money
10% down · 12.0% · 12mo
- Down + closing
- —
- Monthly P&I
- —
- Monthly cashflow
- —
- DSCR
- —
- Eligible?
- —
Short-term bridge; refi at stabilization.
Rent comps 6 comps
| Address | Beds | Baths | Sqft | Rent | $/sqft | DOM | Units | Dist |
|---|---|---|---|---|---|---|---|---|
| 165 SW Kalmia St Ste 3 Junction City, OR | 2.0 | 1.0 | 886 | $1,295 | $1.46 | 13d | 1 | 0.49mi |
| 165 SW Kalmia St Unit 4 Junction City, OR | 2.0 | 1.0 | 886 | $1,295 | $1.46 | 43d | 1 | 0.49mi |
| 2254 W 10th Ave Unit 414-115 Junction City, OR | 2.0 | 2.0 | 968 | $1,599 | $1.65 | 43d | 1 | 0.59mi |
| 2280 W 10th Ave Unit 414-259 Junction City, OR | 2.0 | 2.0 | 968 | $1,565 | $1.62 | 13d | 1 | 0.61mi |
| 2272 W 10th Ave Junction City, OR | 2.0 | 2.0 | 990 | $1,575 | $1.59 | 13d | 1 | 0.68mi |
| 29426 Dane Ln Junction City, OR | 3.0 | 2.0 | 1320 | $2,100 | $1.59 | 43d | 1 | 1.02mi |
Listing history 29 events
-
2026-06-18days on market $62,000 Active 64 DOM
-
2026-06-17days on market $62,000 Active 63 DOM
-
2026-06-16days on market $62,000 Active 62 DOM
-
2026-06-15price $62,000 Active 61 DOM
-
2026-06-15days on market $65,000 Active 61 DOM
-
2026-06-14days on market $65,000 Active 59 DOM
-
2026-06-10days on market $65,000 Active 56 DOM
-
2026-06-09days on market $65,000 Active 55 DOM
-
2026-06-08days on market $65,000 Active 54 DOM
-
2026-06-07days on market $65,000 Active 53 DOM
-
2026-06-05days on market $65,000 Active 50 DOM
-
2026-06-03days on market $65,000 Active 49 DOM
-
2026-06-02days on market $65,000 Active 48 DOM
-
2026-06-01days on market $65,000 Active 47 DOM
-
2026-05-31days on market $65,000 Active 46 DOM
-
2026-05-30statusdays on market $65,000 Active 45 DOM
-
2026-04-13$65,000 Active 532-char remark
Show marketing remark (532 chars)
Welcome to this 3 bed, 2 bath manufactured home in the highly sought-after 55+ community of Scandia Village! Offering 1,440 sq ft of comfortable living space, this 1978 manufactured home features a bright sunroom, a cozy pellet stove in the family room, and an efficient heat pump for year-round comfort. The home also includes a brand new roof, a pellet stove as well as handicap-accessible ramp installed just 4 years ago. Enjoy a beautifully kept park setting with a true sense of community—this is easy living at its best!
-
2024-12-21historical
-
2024-11-27historical Active under Contract
-
2024-10-25$65,000 Active
-
2017-01-20soldstatus $31,000 Sold
-
2017-01-06status Pending
-
2016-12-23status Active
-
2016-12-23price $31,900
-
2016-11-30status Pending
-
2016-10-30$35,000 Active
-
2003-10-20soldstatus $32,000
-
2003-09-11historical
-
2003-03-17$38,000
ⓘ Source: listings_history table (triggers on properties + properties_extension) + one-shot
backfill from property_details.listing_events for pre-trigger history.
Tax reassessment forecast OR · Resets to sale price
- Current annual tax
- $781 · $65/mo
- Projected year-2 tax
- $781 · $65/mo
- Expected delta
- $0/yr ($0/mo · 0.0%)
ⓘ Screening estimate from a state-policy table — verify with the county assessor before closing.
Climate risk First Street
- Flood 6/10 Major FEMA zone X (unshaded) · 57% chance over 30 yrs
- Wildfire 1/10 Low
- Heat 4/10 Moderate 7 d/yr ≥92°F today · 14 d/yr by 30 yrs out
- Wind 1/10 Low
- Air quality 10/10 Extreme 12 unhealthy d/yr today · 13 by 30 yrs out
Nearby sold comps map
Loading sold comps map…
Walkable amenities ~0.75 mi
Loading nearby amenities…
Taxation est. · year 1
- Rental income
- $18,511
- − Mortgage interest
- −$3,473
- − Property taxes
- −$781
- − Insurance
- −$310
- − Repairs & maintenance
- −$1,481
- − Management
- −$1,481
- − Depreciation
- −$1,804
- Taxable income
- $9,182
- Est. tax owed @ 24.0%
- −$2,204
- After-tax cash flow
- $7,428/yr
For passive investors: Depreciation is non-cash, so a rental often shows a tax loss while cash-flowing — sheltering income. Rental losses are passive: they offset passive income freely, and up to $25,000/yr can offset ordinary (W-2) income if you actively participate and your MAGI is under $100k (phasing out to $0 by $150k); unused losses carry forward. On sale, claimed depreciation is recaptured at up to 25%, and gains may owe capital-gains tax (a 1031 exchange can defer both). Figures are a year-1 estimate at your 24.0% rate — not tax advice; consult a CPA.
Schools (NCES district)
- District
- Junction City SD 69
- NCES district ID
- 4106930
- Math proficiency
- 26% ▼ -10.00%
- Reading proficiency
- 41% ▼ -11.00%
- Median HH income
- $50,018
- Composite
- 29.05/100
- National rank
- #6608
- State rank
- #27 of 58 in OR
Livability — Junction City
- Score
- 82/100
- State rank
- #46
- US rank
- #1184
Category grades
Schools grade is shown separately in the Schools card above.
Census & demographics
- Census place
- Junction City, OR
- Population (ZIP)
- 14,629
Population outlook (Lane County) Hauer SSP2
- Today (2025)
- 391,933 people
- By 2030
- 405,860 · +3.6%
- By 2040
- 429,386 · +9.6%
- By 2050
- 452,016 · +15.3%
- By 2075
- 508,825 · +29.8%
- By 2100
- 531,208 · +35.5%
Race, ethnicity, and origin ACS 2023
- Neighborhood character
- Predominantly White (84%)
- Race & ethnicity
- White 84% Two or more races 8% Hispanic / Latino 8%
- Hispanic origin (detail)
- Mexican 6%
- Common ancestry
- Lithuanian 4% Portuguese 2% Italian 2%
- Foreign-born
- 3% · Canada
- Languages at home
- 95% English-only · Spanish 4%
Political lean MEDSL · Lane
- 2024 margin
- Strong D (+23.1) · D 60.0% · R 36.9% · Other 3.1%
- 2008→2024 swing
- -4.3pp toward R · 2008: 27.4pp · 2024: 23.1pp
- All cycles
- 2024: D+23.1 2020: D+24.3 2016: D+18.9 2012: D+23.4 2008: D+27.4
Not yet ingested
- Civics
- —
Market trends
- HPI YoY
- ▼ -151.05%
- Current HPI
- 281.1105
- Rent YoY
- —
- Metro
- —
- State GDP YoY
- ▲ 2.05%
- F500 in state
- 2
Industry mix (Fortune 500 HQ in OR)
| Industry | F500 HQs | Revenue |
|---|---|---|
| Consumer Goods | 1 | $51B |
|
||
Price history
+71.1% since first listed13 events — show timeline
- 2026-04-13 Listed $65,000 RMLS
- 2024-12-21 Listing Removed — WVMLS
- 2024-11-27 Contingent — WVMLS
- 2024-10-25 Listed $65,000 WVMLS
- 2017-01-20 Sold (MLS) $31,000 RMLS
- 2017-01-06 Pending — RMLS
- 2016-12-23 Relisted — RMLS
- 2016-12-23 Price Changed $31,900 RMLS
- 2016-11-30 Pending — RMLS
- 2016-10-30 Listed $35,000 RMLS
- 2003-10-20 Sold (MLS) $32,000 RMLS
- 2003-09-11 Delisted — RMLS
- 2003-03-17 Listed $38,000 RMLS
Property tax history
+3.7%/yrLatest (2025): $781 · +3.6% YoY. Source: county tax records.
Cash-flow waterfall
monthlySold comps — $/sqft
last 12 mo · ≤1 miLoading sold comps…