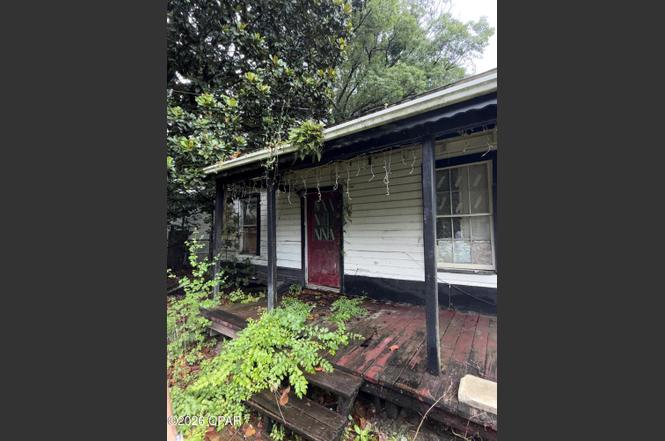
615 Calhoun Ave · Warrington, FL
Flood risk 1/10 · Minimal
- FEMA flood zone
- X (unshaded)
- Chance of flooding over 30 yrs
- 0.0%
- Est. flood insurance / yr
- $507 – $1,088
Fire risk 3/10 · Minor
- Est. fire insurance / yr
- $947 – $1,759
Heat risk 10/10 · Severe
- Hot days now (above 105°F)
- 7 days/yr
- Hot days in 30 yrs
- 22 days/yr
Wind risk 9/10 · Severe
- Chance of severe wind over 30 yrs
- 99.0%
Air-quality risk 1/10 · Minimal
- Unhealthy air days now
- 0 days/yr
- Unhealthy air days in 30 yrs
- 0 days/yr
Risk factors via First Street. Map © Google.
Why this score? — see what drove the B- grade
The composite is a weighted blend of 9 inputs, each scored 0–100. Each bar is that input's sub-score; the figure is the points it added to the 100-point composite (weight × sub-score).
- Cash flow +30.0/30.0
- 1% rule +10.0/10.0
- DSCR +10.0/10.0
- ARV discount +7.5/15.0
- Schools +3.6/10.0
- Livability +3.2/5.0
- Rent growth +2.8/5.0
- Condition / age +2.5/5.0
- Appreciation +0.0/10.0
$55,000
🖨 Deal sheet 📄 Offer letter ✓ Due diligence
Listing remarks MLS
SPECIAL ADDENDUMS NEEDED, BEING SOLD "AS IS" WHERE IS. MANY RENOVATIONS COMPLETED. WILL MAKE A NICE FIRST TIME HOME, OR A GOOD RENTAL.
Key facts
- Substantial repairs
- Shopping
- Renovations
Tags
Property features AI
Finance
- Financial info: Units are partially furnished (multi-unit information)
Exterior
- Utilities: Electricity available
- Home design: Single-story property
- Exterior features: Lot dimensions approximately 50 x 140
Interior
- Bedrooms: 1 bedroom
- Bathrooms: 1 full bathroom
- Interior features: Short term rental allowed
Neighborhood map
What this means for you Summary
Snapshot
- This is a 2-bed/1.0-bath single-family listed at $55k.
Deal economics
- At list price, monthly cash flow is $798 ($10k/yr) — positive.
- The deal already cash-flows at list — no discount required.
- Meets the 1% rule at list price ($1k rent vs $55k).
- Cap rate 23.7% vs local median 4.3% in Warrington — top-decile yield for the area; either an underpriced asset or a hidden risk that comps aren't pricing in. Stress-test before assuming the spread holds.
Location & tenants
- Location reads 65/100 on livability (#631 in FL) — a middle-class / working-renter tenant base. Strengths: cost of living A+, housing A+; Watch: schools D, amenities F, commute F.
- Escambia (suburban): math 40% / reading 45% proficiency, ranked #56 of 73 in FL (top 77%) — families likely to look elsewhere, expect single-tenant / working-renter base with shorter leases.
- Market conditions: Rents rising (+1.2%/yr); 702 active listings in the ZIP; 8 comparable units currently listed for rent nearby; rentals at typical pace (median 23d on market — plan ~3-4 weeks tenant-placement turnaround); 1,479 units permitted in Escambia County in 2024 (0 in 5+ unit buildings).
Forward outlook
- Local home prices are declining (-3.0%/yr); year-one equity from $380 of loan paydown is wiped out by about $2k of value loss. Plan a longer hold.
- Escambia County population projected at +13% by 2050 — modest demand growth; plan on rents tracking national, not racing it.
- At projected returns (-3.0% appreciation + 1.2% rent growth), your $15k cash investment doubles in ~2 years — after that, you're playing with house money.
Negotiation context
- Only 1 days on market — expect competitive offers; lowballing is unlikely to land.
- 3 sale attempts since 26y ago with the ask held roughly flat each time — persistent listings suggest the price (not the market) is what's stuck; bring a comps-based counter.
- Current owner paid $14k; list at $55k implies a 290% gain — meaningful room to come down on a strong offer.
Risks & watch-outs
- Watch-outs: built in 1959 — expect roof / HVAC / electrical / plumbing capex.
- Climate carrying-cost: severe wind risk, 99% chance of damaging wind over 30y; extreme-heat days projected 7→22/yr by 2055 (HVAC capex compounding) — expect insurance premiums to compound above CPI over the hold.
Questions for the listing agent
- Built in 1959 — when were the roof, HVAC, electrical panel, plumbing, and water heater last replaced?
- Is there a deadline driving the sale (1031 exchange, divorce, estate, relocation)? That informs how much negotiation room exists.
- Schools are D-rated, which usually means shorter tenancies and higher turnover. Who's the typical renter profile here, and what's been the actual vacancy rate?
- What's the average days-on-market for RENTAL listings here right now (not sales)? A rising rental-DOM trend means longer vacancies and softer asking-rent achievability than the comps imply.
- What's the recent tenant-quality profile in this submarket — average credit score on applications, eviction rate, late-payment / NSF rate, and stable-employment percentage? A property-management company in the area should have these aggregated.
- How much new for-sale + rental construction is in the pipeline within 1–3 miles? Heavy new supply typically softens prices + rents 12–24 months out; constrained supply supports both.
Investment metrics
- 1% rule
- 2.71% ✓
- Cap rate
- 23.69%
- Cash-on-cash
- 62.14%
- DSCR
- 3.77
- GRM
- 3.1
CMA / ARV
- ARV (on-the-fly)
- $145,920
- Comps found
- 3
Show comp detail 3 sales within ~0.75 mi
| Address | Dist | Beds/Ba | Sqft | Sold | Price | $/sf | Match |
|---|---|---|---|---|---|---|---|
| 1829 Bainbridge Ave | 0.33mi | 2/1.0 | 940 (+3%) | 4mo | $100,000 | $106 | 76 |
| 2105 Grundy St | 0.33mi | 2/1.0 | 852 (-7%) | 1mo | $210,000 | $246 | 72 |
| 2718 Talbert St | 0.26mi | 3/1.0 (+1) | 1,030 (+13%) | 23mo | $165,100 | $160 | 42 |
Match score weights: distance 35% · size 25% · config 20% · recency 20%. Top-matched comps best support the ARV.
Projected returns pro-forma
-3.0% appreciation · 1.22% rent growth · sell at horizon
- IRR
- 59.0%
- Equity multiple
- 3.55×
- Total profit
- $39,279
- Equity at exit
- $8,201
- IRR
- 63.2%
- Equity multiple
- 6.80×
- Total profit
- $89,306
- Equity at exit
- $4,755
Cash invested: $15,400 (down + closing). Projections, not guarantees.
Landlord ↔ Tenant lean methodology
- Overall (STATE)
- 87 Strongly Landlord-Friendly
- State Florida
- 87 Strongly Landlord-Friendly · R+3
- County
- — inherits STATE
- City
- — inherits STATE
ZIP-level market 32507
- Home prices YoY
- -4.6%
- Rents YoY
- 1.2%
- Active inventory
- 702
- Price-to-rent
- 3.1×
Monthly cashflow live
- Estimated rent
- $1,492 high interval (Pro) →
- Mortgage (P&I)
- −$288
- Tax from tax record
- −$70 /mo · $842/yr
- Insurance
- −$23
- HOA
- −$0
- Vacancy / Maint / Mgmt
- −$313
- Net cashflow
- $798
Break-even live
UW: 25.0% down · 7.5% · 30yr · 1.5% tax · 5.0% vac · 8.0% maint · 8.0% mgmt
Financing live
Cash to close
- Down payment
- $13,750
- Closing costs
- $1,650
- Reserves months
- —
- Total cash needed
- —
Loan-product check · same deal, 3 products live
Conventional
25% down · 7.5% · 30yr
- Down + closing
- —
- Monthly P&I
- —
- Monthly cashflow
- —
- DSCR
- —
- Eligible?
- —
Personal DTI + credit; lowest rate.
DSCR
20% down · 8.5% · 30yr
- Down + closing
- —
- Monthly P&I
- —
- Monthly cashflow
- —
- DSCR
- —
- Eligible?
- —
No personal income docs; deal must DSCR.
Hard money
10% down · 12.0% · 12mo
- Down + closing
- —
- Monthly P&I
- —
- Monthly cashflow
- —
- DSCR
- —
- Eligible?
- —
Short-term bridge; refi at stabilization.
Rent comps 8 comps
| Address | Beds | Baths | Sqft | Rent | $/sqft | DOM | Units | Dist |
|---|---|---|---|---|---|---|---|---|
| 1007 Winton Ave Unit B Pensacola, FL | 2.0 | 1.0 | 810 | $1,295 | $1.60 | 23d | 1 | 0.53mi |
| 718 Mills Ave Unit A Pensacola, FL | 2.0 | 1.0 | 728 | $1,200 | $1.65 | 23d | 1 | 0.80mi |
| 315 Flannan Rd Pensacola, FL | 3.0 | 1.0 | 836 | $1,745 | $2.09 | 13d | 1 | 1.00mi |
| 7591 W Highway 98 Pensacola, FL | 1.0–2.0 | 1.0–2.0 | 872 | $1,781 | $2.04 | 13d | 9 | 1.15mi |
| 204 Holmes Dr Unit B Pensacola, FL | 1.0 | 1.0 | 525 | $895 | $1.70 | 13d | 1 | 1.15mi |
| 346 Quigley Rd Pensacola, FL | 3.0 | 2.0 | 1021 | $1,500 | $1.47 | 23d | 1 | 1.28mi |
| 1036 Hawthorn Dr Unit B Pensacola, FL | 2.0 | 1.0 | 650 | $800 | $1.23 | 23d | 1 | 1.31mi |
| 585 S 72nd Ave Pensacola, FL | 1.0–2.0 | 1.0 | 862 | $1,300 | $1.51 | 23d | 3 | 1.44mi |
Listing history 2 events
-
2026-06-17remarks 556-char remark
-
2026-06-17$55,000 Active 1 DOM
ⓘ Source: listings_history table (triggers on properties + properties_extension) + one-shot
backfill from property_details.listing_events for pre-trigger history.
Tax reassessment forecast FL · Resets to sale price
- Current annual tax
- $842 · $70/mo
- Projected year-2 tax
- $842 · $70/mo
- Expected delta
- $0/yr ($0/mo · 0.0%)
ⓘ Screening estimate from a state-policy table — verify with the county assessor before closing.
Climate risk First Street
- Flood 1/10 Low FEMA zone X (unshaded) · 0% chance over 30 yrs
- Wildfire 3/10 Moderate
- Heat 10/10 Extreme 7 d/yr ≥105°F today · 22 d/yr by 30 yrs out
- Wind 9/10 Extreme 99% chance of damaging wind over 30 yrs
- Air quality 1/10 Low 0 unhealthy d/yr today · 0 by 30 yrs out
Nearby sold comps map
Loading sold comps map…
Walkable amenities ~0.75 mi
Loading nearby amenities…
Taxation est. · year 1
- Rental income
- $17,909
- − Mortgage interest
- −$3,081
- − Property taxes
- −$842
- − Insurance
- −$275
- − Repairs & maintenance
- −$1,433
- − Management
- −$1,433
- − Depreciation
- −$1,600
- Taxable income
- $9,246
- Est. tax owed @ 24.0%
- −$2,219
- After-tax cash flow
- $7,351/yr
For passive investors: Depreciation is non-cash, so a rental often shows a tax loss while cash-flowing — sheltering income. Rental losses are passive: they offset passive income freely, and up to $25,000/yr can offset ordinary (W-2) income if you actively participate and your MAGI is under $100k (phasing out to $0 by $150k); unused losses carry forward. On sale, claimed depreciation is recaptured at up to 25%, and gains may owe capital-gains tax (a 1031 exchange can defer both). Figures are a year-1 estimate at your 24.0% rate — not tax advice; consult a CPA.
Schools (NCES district)
- District
- Escambia
- NCES district ID
- 1200510
- Math proficiency
- 40% ▼ -9.00%
- Reading proficiency
- 45% ▼ -4.00%
- Median HH income
- $44,649
- Composite
- 36.04/100
- National rank
- #4773
- State rank
- #56 of 73 in FL
Livability — Warrington
- Score
- 65/100
- State rank
- #631
- US rank
- #12396
Category grades
Schools grade is shown separately in the Schools card above.
Census & demographics
- Census place
- Warrington, FL
- County
- Escambia County · 301,722 people
- Metro
- Pensacola-Ferry Pass-Brent, FL
- Population (ZIP)
- 32,226
- Household income
- $73,540
- Rent vs Own
- Severe rent burden
- 1175.0
Population outlook (Escambia County) Hauer SSP2
- Today (2025)
- 334,637 people
- By 2030
- 345,779 · +3.3%
- By 2040
- 364,828 · +9.0%
- By 2050
- 378,514 · +13.1%
- By 2075
- 403,220 · +20.5%
- By 2100
- 386,125 · +15.4%
Race, ethnicity, and origin ACS 2023
- Neighborhood character
- Predominantly White (73%)
- Race & ethnicity
- White 73% Black 10% Two or more races 10% Hispanic / Latino 7% Asian 2%
- Hispanic origin (detail)
- Mexican 3% Puerto Rican 2%
- Common ancestry
- Slovak 3% Lithuanian 2% Romanian 2%
- Foreign-born
- 5% · Canada, Vietnam
- Languages at home
- 92% English-only · Spanish 4% Other Asian/Pacific 1% French/Haitian/Cajun 1%
Political lean MEDSL · Escambia
- 2024 margin
- R (+19.5) · D 39.7% · R 59.2% · Other 1.1%
- 2008→2024 swing
- -0.2pp no change · 2008: -19.3pp · 2024: -19.5pp
- All cycles
- 2024: R+19.5 2020: R+15.1 2016: R+20.6 2012: R+20.6 2008: R+19.3
Not yet ingested
- Civics
- —
Market trends
- HPI YoY
- ▼ -26.23%
- Current HPI
- 548.03
- Rent YoY
- ▲ 1.22%
- Metro
- Pensacola-Ferry Pass-Brent, FL
- State GDP YoY
- ▲ 3.28%
- F500 in state
- 36
Industry mix (Fortune 500 HQ in FL)
| Industry | F500 HQs | Revenue |
|---|---|---|
| Industrial Technology | 2 | $29B |
|
||
| Insurance | 2 | $17B |
|
||
| Retail | 1 | $60B |
|
||
| Technology Distribution | 1 | $58B |
|
||
| Homebuilding | 1 | $35B |
|
||
| Technology Manufacturing | 1 | $35B |
|
||
Price history
+101.5% since first listed7 events — show timeline
- 2026-06-16 Listed $55,000 CPARMLS
- 2001-10-03 Sold (MLS) $14,100 PARMLS
- 2001-04-21 Listed $17,900 PARMLS
- 2001-01-17 Listing Removed — PARMLS
- 2000-02-17 Listed $39,900 PARMLS
- 1998-01-22 Sold (Public Records) $27,300 Public Records
- 1988-09-01 Sold (Public Records) $27,300 Public Records
Property tax history
+7.2%/yrLatest (2025): $842 · +24.0% YoY. Source: county tax records.
Cash-flow waterfall
monthlySold comps — $/sqft
last 12 mo · ≤1 miLoading sold comps…