161 John Vanzandt Dr · Pennington, NJ
Flood risk No data
- FEMA flood zone
- —
- Chance of flooding over 30 yrs
- —
- Est. flood insurance / yr
- —
Fire risk No data
- Est. fire insurance / yr
- —
Heat risk No data
- Hot days now (above threshold)
- —
- Hot days in 30 yrs
- —
Wind risk No data
- Chance of severe wind over 30 yrs
- —
Air-quality risk No data
- Unhealthy air days now
- —
- Unhealthy air days in 30 yrs
- —
Risk factors via First Street. Map © Google.
Why this score? — see what drove the D+ grade
The composite is a weighted blend of 9 inputs, each scored 0–100. Each bar is that input's sub-score; the figure is the points it added to the 100-point composite (weight × sub-score).
- Cash flow +17.0/30.0
- ARV discount +7.8/15.0
- DSCR +5.3/10.0
- Schools +5.2/10.0
- 1% rule +4.0/10.0
- Livability +4.0/5.0
- Rent growth +2.5/5.0
- Condition / age +1.0/5.0
- Appreciation +0.0/10.0
$479,990
🖨 Deal sheet 📄 Offer letter ✓ Due diligence
Listing remarks
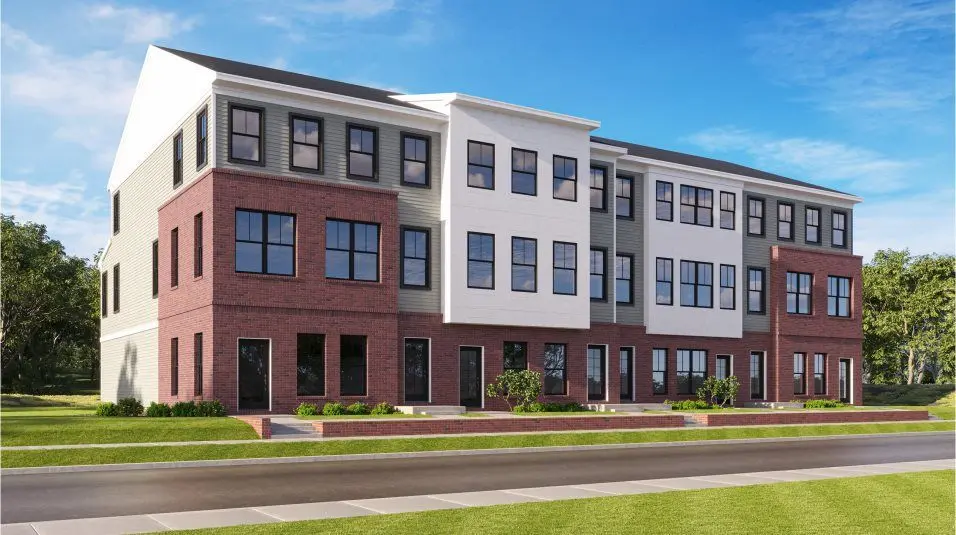
Step inside the stunning 3-story Collins townhome nestled in the sought-after Hopewell Parc community, where thoughtful design meets everyday functionality. Light pours through every level of this generously sized home, anchored by an open main floor where the living room, dining space, and kitchen flow effortlessly into one another. The kitchen includes clean cabinetry, quality finishes, generous counter space, and an oversized center island — the natural hub for entertaining or casual family meals. The upper level is home to a serene primary suite complete with a walk-in closet and en-suite bath, while additional bedrooms adapt easily to your needs — whether that's a guest roo
Key facts
- $225 HOA
- Garage
- Community pool
Neighborhood map
What this means for you Summary
Snapshot
- This is a 3-bed/2.5-bath townhouse listed at $480k. Condition is rated poor.
Deal economics
- At list price, monthly cash flow is $323 ($4k/yr) — positive.
- The deal already cash-flows at list — no discount required.
- To meet the 1% rule (rent ≥ 1% of price), the offer needs to be $434k (9.7% below list).
- Recommended offer: $434k (9.7% below list) — sets the bar for 1% rule.
- Cap rate 7.1% vs local median 2.2% in Pennington — top-decile yield for the area; either an underpriced asset or a hidden risk that comps aren't pricing in. Stress-test before assuming the spread holds.
Location & tenants
- Location reads 79/100 on livability (#84 in NJ, #2,077 nationally) — a middle-class / working-renter tenant base. Strengths: crime A+, commute A+, employment A+; Watch: amenities F, cost of living F.
- Hopewell Valley Regional School District (suburban): math 39% / reading 66% proficiency, ranked #72 of 472 in NJ (top 15%) — acceptable for families but not a draw, mixed tenant base, ~2y average lease; only 2% free/reduced lunch — higher-income household profile.
- Zoned schools: Hopewell Valley Central High School (math 44% / reading 71%, grade C, #67 of 399 statewide, top 17%, 1,079 students, 5% FRL) — zoned schools at 5% FRL track the district average.
- Market conditions: 86 active listings in the ZIP; 2 comparable units currently listed for rent nearby; 2,256 units permitted in Mercer County in 2024 (1,303 in 5+ unit buildings).
Forward outlook
- Local home prices are declining (-3.0%/yr); year-one equity from $3k of loan paydown is wiped out by about $14k of value loss. Plan a longer hold.
- Mercer County population projected at +4% by 2050 — modest demand growth; plan on rents tracking national, not racing it.
Negotiation context
- Only 0 days on market — expect competitive offers; lowballing is unlikely to land.
Questions for the listing agent
- Have any recent inspections been done? Can we get a copy of the seller's disclosures and any deferred-maintenance estimates?
- What does the HOA fee cover, when was the last increase, and are there any pending special assessments or reserve-fund shortfalls?
- Is there a deadline driving the sale (1031 exchange, divorce, estate, relocation)? That informs how much negotiation room exists.
- Schools are A-rated — typically a magnet for longer-tenancy family renters. What's the average tenant stay here, and is there a school-zone premium baked into asking?
- The area grade is low — what's the realistic commute time and amenity access for the typical tenant pool here? Any planned neighborhood developments (good or bad) we should know about?
- What's the average days-on-market for RENTAL listings here right now (not sales)? A rising rental-DOM trend means longer vacancies and softer asking-rent achievability than the comps imply.
- What's the recent tenant-quality profile in this submarket — average credit score on applications, eviction rate, late-payment / NSF rate, and stable-employment percentage? A property-management company in the area should have these aggregated.
- How much new for-sale + rental construction is in the pipeline within 1–3 miles? Heavy new supply typically softens prices + rents 12–24 months out; constrained supply supports both.
Investment metrics
- 1% rule
- 0.90% ✗
- Cap rate
- 7.10%
- Cash-on-cash
- 2.88%
- DSCR
- 1.13
- GRM
- 9.2
CMA / ARV
- ARV (median comp)
- $482,888
- List price
- $479,990
- Delta
- 2.44%
- Verdict
- FAIR
- Comps
- 20 within 1.0 mi
Show comp detail 12 sales within ~0.75 mi
| Address | Dist | Beds/Ba | Sqft | Sold | Price | $/sf | Match |
|---|---|---|---|---|---|---|---|
| 228 Cora Bergen Blvd | 0.03mi | 3/2.5 | 2,145 (+1%) | 2mo | $589,990 | $275 | 96 |
| 139 John Vanzandt Dr | 0.04mi | 3/2.5 | 2,129 (0%) | 5mo | $648,340 | $305 | 94 |
| 123 John Vanzandt Dr | 0.05mi | 3/2.5 | 2,129 (0%) | 5mo | $610,000 | $287 | 94 |
| 121 John Vanzandt Dr | 0.06mi | 3/2.5 | 2,129 (0%) | 5mo | $658,740 | $309 | 93 |
| 129 John Vanzandt Dr | 0.05mi | 3/2.5 | 2,129 (0%) | 6mo | $619,000 | $291 | 93 |
| 115 Lois Seruby Dr | 0.25mi | 3/3.5 | 2,382 (+12%) | 2mo | $712,000 | $299 | 63 |
| 121 Lois Seruby Dr | 0.24mi | 3/3.5 | 2,382 (+12%) | 3mo | $724,840 | $304 | 63 |
| 517 John Vanzandt Dr | 0.29mi | 3/3.5 | 2,382 (+12%) | 1mo | $721,930 | $303 | 62 |
| 519 John Vanzandt Dr | 0.29mi | 3/3.5 | 2,382 (+12%) | 2mo | $724,990 | $304 | 61 |
| 111 Lois Seruby Dr | 0.26mi | 3/3.5 | 2,382 (+12%) | 4mo | $726,000 | $305 | 61 |
| 101 Lois Seruby Dr | 0.28mi | 3/3.5 | 2,382 (+12%) | 3mo | $724,840 | $304 | 60 |
| 107 Lois Seruby Dr | 0.27mi | 3/3.5 | 2,382 (+12%) | 5mo | $714,990 | $300 | 60 |
Match score weights: distance 35% · size 25% · config 20% · recency 20%. Top-matched comps best support the ARV.
Projected returns pro-forma
-3.0% appreciation · 3.0% rent growth · sell at horizon
- IRR
- -11.8%
- Equity multiple
- 0.57×
- Total profit
- $-57,292
- Equity at exit
- $71,568
- IRR
- -2.6%
- Equity multiple
- 0.82×
- Total profit
- $-23,693
- Equity at exit
- $41,501
Cash invested: $134,397 (down + closing). Projections, not guarantees.
Landlord ↔ Tenant lean methodology
- Overall (STATE)
- 21 Tenant-Leaning
- State New Jersey
- 21 Tenant-Leaning · D+6
- County
- — inherits STATE
- City
- — inherits STATE
ZIP-level market 08560
- Home prices YoY
- -18.6%
- Active inventory
- 86
- Price-to-rent
- 9.2×
Monthly cashflow live
- Estimated rent
- $4,335 medium interval (Pro) →
- Mortgage (P&I)
- −$2,517
- Tax from tax record
- −$160 /mo · $1,921/yr
- Insurance
- −$200
- HOA
- −$225
- Vacancy / Maint / Mgmt
- −$910
- Net cashflow
- $323
Break-even live
UW: 25.0% down · 7.5% · 30yr · 1.5% tax · 5.0% vac · 8.0% maint · 8.0% mgmt
Financing live
Cash to close
- Down payment
- $119,998
- Closing costs
- $14,400
- Reserves months
- —
- Total cash needed
- —
Loan-product check · same deal, 3 products live
Conventional
25% down · 7.5% · 30yr
- Down + closing
- —
- Monthly P&I
- —
- Monthly cashflow
- —
- DSCR
- —
- Eligible?
- —
Personal DTI + credit; lowest rate.
DSCR
20% down · 8.5% · 30yr
- Down + closing
- —
- Monthly P&I
- —
- Monthly cashflow
- —
- DSCR
- —
- Eligible?
- —
No personal income docs; deal must DSCR.
Hard money
10% down · 12.0% · 12mo
- Down + closing
- —
- Monthly P&I
- —
- Monthly cashflow
- —
- DSCR
- —
- Eligible?
- —
Short-term bridge; refi at stabilization.
Rent comps 2 comps
| Address | Beds | Baths | Sqft | Rent | $/sqft | DOM | Units | Dist |
|---|---|---|---|---|---|---|---|---|
| 126 Ada Hightower Ave Pennington, NJ | 4.0 | 3.5 | 2453 | $4,900 | $2.00 | 43d | 1 | 1.33mi |
| 135 Stoutsburg Blvd Hopewell Township, NJ | 3.0 | 2.5 | 2129 | $3,800 | $1.78 | 43d | 1 | 1.45mi |
HOA detail
- Monthly dues
- $225 · $2,700/yr
Listing history 11 events
-
2026-06-09remarks 687-char remark
-
2026-06-09statusdays on market $479,990 Pending
-
2026-06-08days on market $479,990 Active 24 DOM
-
2026-06-07pricedays on market $479,990 Active 23 DOM
-
2026-06-03days on market $492,265 Active 19 DOM
-
2026-06-03price $492,265 Active 18 DOM
-
2026-06-02days on market $494,665 Active 18 DOM
-
2026-06-01days on market $494,665 Active 17 DOM
-
2026-05-31days on market $494,665 Active 16 DOM
-
2026-05-30days on market $494,665 Active 15 DOM
-
2026-05-15$519,915 Active 334-char remark
ⓘ Source: listings_history table (triggers on properties + properties_extension) + one-shot
backfill from property_details.listing_events for pre-trigger history.
Tax reassessment forecast NJ · Partial reset (capped growth)
- Current annual tax
- $1,921 · $160/mo
- Projected year-2 tax
- $6,936 · $578/mo
- Expected delta
- +$5,015/yr (+$418/mo · 261.1%)
ⓘ Screening estimate from a state-policy table — verify with the county assessor before closing.
Nearby sold comps map
Loading sold comps map…
Walkable amenities ~0.75 mi
Loading nearby amenities…
Taxation est. · year 1
- Rental income
- $52,024
- − Mortgage interest
- −$26,887
- − Property taxes
- −$1,921
- − Insurance
- −$2,400
- − Repairs & maintenance
- −$4,162
- − Management
- −$4,162
- − HOA
- −$2,700
- − Depreciation
- −$13,963
- Taxable loss
- −$4,171
- Est. tax savings @ 24.0%
- +$1,001
- After-tax cash flow
- $4,874/yr
For passive investors: Depreciation is non-cash, so a rental often shows a tax loss while cash-flowing — sheltering income. Rental losses are passive: they offset passive income freely, and up to $25,000/yr can offset ordinary (W-2) income if you actively participate and your MAGI is under $100k (phasing out to $0 by $150k); unused losses carry forward. On sale, claimed depreciation is recaptured at up to 25%, and gains may owe capital-gains tax (a 1031 exchange can defer both). Figures are a year-1 estimate at your 24.0% rate — not tax advice; consult a CPA.
Condition & rehab AI · 0 photos
This 3-story Collins townhome in Pennington, NJ, requires extensive repairs and updates to its kitchen, exterior, flooring, and interior walls, significantly impacting its current condition score. Significant value can be added through painting, updating cabinets, replacing siding, and updating windows, making it a promising investment opportunity.
Repairs flagged
- Major Kitchen cabinets — Significant wear and tear, indicating the need for replacement or major repair.
- Major Exterior siding — Peeling and in need of repainting or replacement.
- Major Flooring — Worn and may need replacement or refinishing.
- Major Interior walls — Signs of wear and discoloration, indicating the need for painting or repairs.
- Major Windows — Old and may need replacement or caulking.
Value-add opportunities
- Both Painting and updating the kitchen cabinets — Fresh paint and updated cabinets can significantly improve the home's curb appeal and interior aesthetics, enhancing both resale and rental value.
- Both Replacing the exterior siding — A fresh coat of paint and new siding can greatly improve the home's curb appeal and increase its value for both resale and rental.
- Both Replacing the flooring — New flooring can make a significant difference in the home's appearance and value, improving both resale and rental potential.
- Both Painting and updating the interior walls — Fresh paint can make the interior look new and improve the home's overall appearance, enhancing both resale and rental value.
- Both Replacing the windows — New windows can improve energy efficiency, reduce heating and cooling costs, and enhance the home's curb appeal, increasing its value for both resale and rental.
Renovation cost estimate screening
| Repair item | Severity | Est. cost |
|---|---|---|
| Kitchen cabinets · Significant wear and tear, indicating the need for replacement or major repair. | Major | $15,000–50,000 |
| Exterior siding · Peeling and in need of repainting or replacement. | Major | $15,000–50,000 |
| Flooring · Worn and may need replacement or refinishing. | Major | $15,000–50,000 |
| Interior walls · Signs of wear and discoloration, indicating the need for painting or repairs. | Major | $15,000–50,000 |
| Windows · Old and may need replacement or caulking. | Major | $15,000–50,000 |
| Total estimated repair cost · 5 items | $75,000–250,000 |
Value-add ROI direction
- Both Painting and updating the kitchen cabinets — Fresh paint and updated cabinets can significantly improve the home's curb appeal and interior aesthetics, enhancing both resale and rental value. ↑
- Both Replacing the exterior siding — A fresh coat of paint and new siding can greatly improve the home's curb appeal and increase its value for both resale and rental. ↑
- Both Replacing the flooring — New flooring can make a significant difference in the home's appearance and value, improving both resale and rental potential. ↑
- Both Painting and updating the interior walls — Fresh paint can make the interior look new and improve the home's overall appearance, enhancing both resale and rental value. ↑
- Both Replacing the windows — New windows can improve energy efficiency, reduce heating and cooling costs, and enhance the home's curb appeal, increasing its value for both resale and rental. ↑
ⓘ Cost ranges are severity-bucket heuristics (US national rule-of-thumb). Get contractor quotes + a written scope before underwriting a rehab budget.
Schools (NCES district)
- District
- Hopewell Valley Regional School District
- NCES district ID
- 3407530
- Math proficiency
- 39% ▼ -25.00%
- Reading proficiency
- 66% ▼ -10.00%
- Median HH income
- $126,131
- Composite
- 52.03/100
- National rank
- #1636
- State rank
- #72 of 472 in NJ
Livability — Pennington
- Score
- 79/100
- State rank
- #84
- US rank
- #2077
Category grades
Schools grade is shown separately in the Schools card above.
Census & demographics
- City population
- 13,272
- Population (ZIP)
- 3,334
Population outlook (Mercer County) Hauer SSP2
- Today (2025)
- 381,395 people
- By 2030
- 384,640 · +0.9%
- By 2040
- 391,431 · +2.6%
- By 2050
- 397,845 · +4.3%
- By 2075
- 417,281 · +9.4%
- By 2100
- 420,327 · +10.2%
Race, ethnicity, and origin ACS 2023
- Neighborhood character
- Predominantly White (87%)
- Race & ethnicity
- White 87% Asian 6% Two or more races 5% Hispanic / Latino 1%
- Common ancestry
- Romanian 7% Lithuanian 4% Serbian 2%
- Foreign-born
- 6% · China
- Languages at home
- 91% English-only · French/Haitian/Cajun 3% Chinese 2% Spanish 1%
Political lean MEDSL · Mercer
- 2024 margin
- Solid D (+33.9) · D 65.9% · R 32.0% · Other 2.1%
- 2008→2024 swing
- -2.2pp toward R · 2008: 36.1pp · 2024: 33.9pp
- All cycles
- 2024: D+33.9 2020: D+40.0 2016: D+36.2 2012: D+36.8 2008: D+36.1
Not yet ingested
- Civics
- —
Market trends
- HPI YoY
- ▼ -56.39%
- Current HPI
- 246.241
- Rent YoY
- —
- Metro
- —
- State GDP YoY
- ▲ 2.05%
- F500 in state
- 34
Industry mix (Fortune 500 HQ in NJ)
| Industry | F500 HQs | Revenue |
|---|---|---|
| Consumer Goods | 3 | $31B |
|
||
| Pharmaceuticals | 2 | $153B |
|
||
| Technology | 2 | $21B |
|
||
| Insurance | 2 | $20B |
|
||
| Healthcare | 2 | $19B |
|
||
| Financial Services | 1 | $70B |
|
||
Price history
2 events — show timeline
- 2026-06-08 Listed $479,990 BRIGHT MLS
- 2026-06-08 Listing Removed — BRIGHT MLS
Property tax history
+2.8%/yrLatest (2025): $1,921 · +2.8% YoY. Source: county tax records.
Cash-flow waterfall
monthlySold comps — $/sqft
last 12 mo · ≤1 miLoading sold comps…