7574 Hudson Way · Abilene, TX
Flood risk No data
- FEMA flood zone
- —
- Chance of flooding over 30 yrs
- —
- Est. flood insurance / yr
- —
Fire risk No data
- Est. fire insurance / yr
- —
Heat risk No data
- Hot days now (above threshold)
- —
- Hot days in 30 yrs
- —
Wind risk No data
- Chance of severe wind over 30 yrs
- —
Air-quality risk No data
- Unhealthy air days now
- —
- Unhealthy air days in 30 yrs
- —
Risk factors via First Street. Map © Google.
Why this score? — see what drove the D+ grade
The composite is a weighted blend of 9 inputs, each scored 0–100. Each bar is that input's sub-score; the figure is the points it added to the 100-point composite (weight × sub-score).
- Cash flow +17.0/30.0
- Schools +5.6/10.0
- DSCR +5.3/10.0
- Rent growth +5.0/5.0
- 1% rule +4.7/10.0
- Condition / age +4.0/5.0
- ARV discount +3.8/15.0
- Livability +3.8/5.0
- Appreciation +0.0/10.0
$329,900
🖨 Deal sheet 📄 Offer letter ✓ Due diligence
Listing remarks
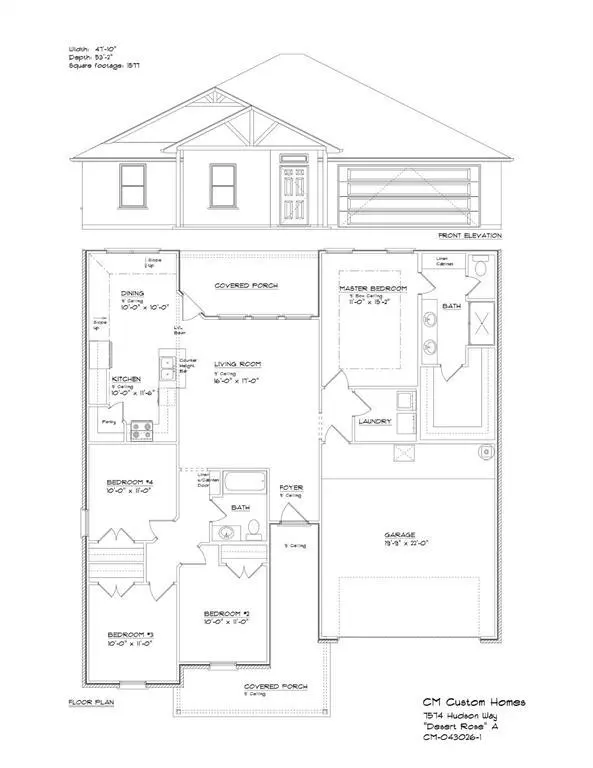
Discover the Desert Rose floor plan in the sought after Carriage Hills subdivision located in the highly desired Wylie Independent School District. This pre-sold semi-custom home offers a thoughtfully designed 4 bedroom, 2 bath layout featuring a spacious living area, abundant natural light, and a beautifully planned kitchen perfect for everyday living and entertaining. The private primary suite includes a luxurious bath and oversized walk-in closet, creating the ideal retreat at the end of the day. Buyers will have the opportunity to personalize the home from the inside out by selecting from the builder’s professionally curated design packages, including interior and exterior finishe
Key facts
- Modern finishes
- 0.24 acre lot
- 2 garage spots
Tags
Property features AI
Finance
- Other: Property located in Carriage Hills planned development; Easements present (per public records); Possession at closing/funding; Builder special listing conditions
- Financial info: Listing accepts Cash, Conventional, FHA, and VA financing
- HOA & community: Mandatory HOA (Carriage Hills); HOA management provided by Carriage Hills HOA; HOA fee includes management fees; HOA fee: $250 annually
Exterior
- Parking: Attached 2-car garage with garage door opener; Covered parking for 2 vehicles; Driveway; Asphalt surfaces; Enclosed parking
- Security: Security lights
- Utilities: City water; City sewer; Electricity connected; Concrete curbs; Sidewalk
- Home design: Single family residence (new construction - incomplete); One story; Residential property
- Construction: Brick and siding exterior; Composition roof; Slab foundation; Built in 2026
- Exterior features: Awning(s); Back yard fencing; Wood fence; Fenced yard; Landscaped lot; Sprinkler system; Interior lot; Subdivision setting (Carriage Hills)
Interior
- Kitchen: Granite counters; Kitchen island; Eat-in kitchen; Dishwasher; Garbage disposal; Electric range; Microwave
- Bedrooms: Primary bedroom (level 1) with ensuite bath, dual sinks and walk-in closet; Total of 4 bedrooms
- Flooring: Luxury vinyl plank
- Bathrooms: 2 full bathrooms
- Heating & cooling: Central heating (electric); Central air (electric); Ceiling fans
- Interior features: Decorative lighting; Double vanity in primary bath; Eat-in kitchen; Granite counters; High-speed internet available; Kitchen island; Open floorplan; Pantry; Smart home system; Vaulted ceilings; Walk-in closets
- Laundry & utility: Electric water heater
Neighborhood map
What this means for you Summary
Snapshot
- This is a 4-bed/2.0-bath single-family listed at $330k. Condition is rated good.
Deal economics
- At list price, monthly cash flow is $224 ($3k/yr) — positive.
- The deal already cash-flows at list — no discount required.
- To meet the 1% rule (rent ≥ 1% of price), the offer needs to be $320k (3.1% below list).
- Recommended offer: $320k (3.1% below list) — sets the bar for 1% rule.
Location & tenants
- Location reads 75/100 on livability (#142 in TX, #4,037 nationally) — a middle-class / working-renter tenant base. Strengths: cost of living A+, housing A+, health & safety A+; Watch: crime D, commute F.
- Wylie ISD (rural): math 63% / reading 62% proficiency, ranked #32 of 826 in TX (top 4%) — acceptable for families but not a draw, mixed tenant base, ~2y average lease; only 17% free/reduced lunch — higher-income household profile.
- Zoned schools: Wylie East El (math 58% / reading 58%, grade C+, #480 of 4,322 statewide, top 11%, 789 students, 30% FRL).
- Market conditions: Rents rising fast (+33.5%/yr); 370 active listings in the ZIP; 23 comparable units currently listed for rent nearby; rentals leasing fast (median 11d on market — plan ~1-2 weeks tenant-placement turnaround); solid renter incomes; 508 units permitted in Taylor County in 2024 (0 in 5+ unit buildings).
- This rent runs 43% of the median local income ($90k/yr) — at the standard rent-burdened threshold; future hikes will face affordability resistance.
Forward outlook
- Local home prices are declining (-3.0%/yr); year-one equity from $2k of loan paydown is wiped out by about $10k of value loss. Plan a longer hold.
- Taylor County population projected at +16% by 2050 — long-run rental-demand tailwind backs the buy-and-hold thesis.
- At projected returns (-3.0% appreciation + 8.0% rent growth), your $92k cash investment doubles in ~10 years — after that, you're playing with house money.
Negotiation context
- It's been on market 24 days — a 2% lower offer ($325k) is reasonable based on typical stale-listing flexibility.
Questions for the listing agent
- What does the HOA fee cover, when was the last increase, and are there any pending special assessments or reserve-fund shortfalls?
- Is there a deadline driving the sale (1031 exchange, divorce, estate, relocation)? That informs how much negotiation room exists.
- Schools are D-rated, which usually means shorter tenancies and higher turnover. Who's the typical renter profile here, and what's been the actual vacancy rate?
- Crime grade is D in this area — have there been break-ins, vandalism, or insurance claims at this property in the last 3 years? What carrier currently insures it and at what premium?
- The area grade is low — what's the realistic commute time and amenity access for the typical tenant pool here? Any planned neighborhood developments (good or bad) we should know about?
- What's the average days-on-market for RENTAL listings here right now (not sales)? A rising rental-DOM trend means longer vacancies and softer asking-rent achievability than the comps imply.
- What's the recent tenant-quality profile in this submarket — average credit score on applications, eviction rate, late-payment / NSF rate, and stable-employment percentage? A property-management company in the area should have these aggregated.
- How much new for-sale + rental construction is in the pipeline within 1–3 miles? Heavy new supply typically softens prices + rents 12–24 months out; constrained supply supports both.
Investment metrics
- 1% rule
- 0.97% ✗
- Cap rate
- 7.11%
- Cash-on-cash
- 2.90%
- DSCR
- 1.13
- GRM
- 8.6
CMA / ARV
- ARV (median comp)
- $304,579
- List price
- $329,900
- Delta
- 8.31%
- Verdict
- FAIR
- Comps
- 20 within 1.0 mi
Show comp detail 12 sales within ~0.75 mi
| Address | Dist | Beds/Ba | Sqft | Sold | Price | $/sf | Match |
|---|---|---|---|---|---|---|---|
| 7654 Hudson Way | 0.21mi | 4/2.0 | 1,577 (0%) | 1mo | $335,000 | $212 | 90 |
| 7580 Wildflower | 0.02mi | 3/2.0 (-1) | 1,522 (-4%) | 0mo | $304,900 | $200 | 88 |
| 7584 Wildflower | 0.03mi | 3/2.0 (-1) | 1,522 (-4%) | 0mo | $304,900 | $200 | 87 |
| 7633 Wildflower Way | 0.04mi | 4/2.0 | 1,764 (+12%) | 1mo | $348,000 | $197 | 78 |
| 132 Lake Ridge Ct | 0.29mi | 3/2.0 (-1) | 1,662 (+5%) | 1mo | $350,000 | $211 | 72 |
| 7685 Lake Ridge Pkwy | 0.35mi | 3/2.0 (-1) | 1,650 (+5%) | 0mo | $325,000 | $197 | 70 |
| 250 Martis Way | 0.46mi | 4/2.0 | 1,650 (+5%) | 1mo | $325,000 | $197 | 70 |
| 7689 Lake Ridge Pkwy | 0.36mi | 3/2.0 (-1) | 1,650 (+5%) | 1mo | $325,000 | $197 | 70 |
| 7693 Lake Ridge Pkwy | 0.37mi | 3/2.0 (-1) | 1,650 (+5%) | 0mo | $325,000 | $197 | 70 |
| 331 Sophia Ln | 0.45mi | 3/2.0 (-1) | 1,632 (+4%) | 0mo | $329,000 | $202 | 68 |
| 149 Spring Park Way | 0.32mi | 3/2.0 (-1) | 1,714 (+9%) | 1mo | $289,000 | $169 | 65 |
| 7321 Wildflower Way | 0.48mi | 4/2.0 | 1,737 (+10%) | 1mo | $335,000 | $193 | 60 |
Match score weights: distance 35% · size 25% · config 20% · recency 20%. Top-matched comps best support the ARV.
Projected returns pro-forma
-3.0% appreciation · 8.0% rent growth · sell at horizon
- IRR
- -6.2%
- Equity multiple
- 0.76×
- Total profit
- $-22,271
- Equity at exit
- $49,189
- IRR
- 8.8%
- Equity multiple
- 1.82×
- Total profit
- $76,050
- Equity at exit
- $28,524
Cash invested: $92,372 (down + closing). Projections, not guarantees.
Landlord ↔ Tenant lean methodology
- Overall (STATE)
- 87 Strongly Landlord-Friendly
- State Texas
- 87 Strongly Landlord-Friendly · R+5
- County
- — inherits STATE
- City
- — inherits STATE
ZIP-level market 79602
- Home prices YoY
- -19.6%
- Rents YoY
- 33.5%
- Active inventory
- 370
- Price-to-rent
- 8.6×
Monthly cashflow live
- Estimated rent
- $3,195 high interval (Pro) →
- Mortgage (P&I)
- −$1,730
- Tax est. 1.5%
- −$412 /mo · $4,948/yr
- Insurance
- −$137
- HOA
- −$21
- Vacancy / Maint / Mgmt
- −$671
- Net cashflow
- $224
Break-even live
UW: 25.0% down · 7.5% · 30yr · 1.5% tax · 5.0% vac · 8.0% maint · 8.0% mgmt
Financing live
Cash to close
- Down payment
- $82,475
- Closing costs
- $9,897
- Reserves months
- —
- Total cash needed
- —
Loan-product check · same deal, 3 products live
Conventional
25% down · 7.5% · 30yr
- Down + closing
- —
- Monthly P&I
- —
- Monthly cashflow
- —
- DSCR
- —
- Eligible?
- —
Personal DTI + credit; lowest rate.
DSCR
20% down · 8.5% · 30yr
- Down + closing
- —
- Monthly P&I
- —
- Monthly cashflow
- —
- DSCR
- —
- Eligible?
- —
No personal income docs; deal must DSCR.
Hard money
10% down · 12.0% · 12mo
- Down + closing
- —
- Monthly P&I
- —
- Monthly cashflow
- —
- DSCR
- —
- Eligible?
- —
Short-term bridge; refi at stabilization.
Rent comps 23 comps
| Address | Beds | Baths | Sqft | Rent | $/sqft | DOM | Units | Dist |
|---|---|---|---|---|---|---|---|---|
| 7709 Sawdust Trl Abilene, TX | 3.0 | 2.0 | 1502 | $3,200 | $2.13 | 43d | 1 | 0.08mi |
| 7717 Sawdust Trl Abilene, TX | 3.0 | 2.0 | 1502 | $3,375 | $2.25 | 11d | 1 | 0.09mi |
| 7625 Wildflower Way Abilene, TX | 4.0 | 3.0 | 1800 | $3,300 | $1.83 | 3d | 1 | 0.13mi |
| 7627 Hudson Way Abilene, TX | 4.0 | 2.0 | 1598 | $8,900 | $5.57 | 13d | 1 | 0.15mi |
| 7949 Sawdust Trl Abilene, TX | 3.0 | 2.0 | 1508 | $2,995 | $1.99 | 43d | 1 | 0.15mi |
| 7646 Hudson Way Abilene, TX | 4.0 | 2.0 | 1577 | $3,295 | $2.09 | 20d | 1 | 0.19mi |
| 7650 Hudson Way Abilene, TX | 4.0 | 2.0 | 1577 | $3,295 | $2.09 | 13d | 1 | 0.20mi |
| 385 Kristi Path Abilene, TX | 3.0 | 2.0 | 1449 | $2,700 | $1.86 | 2d | 1 | 0.22mi |
| 8001 Sawdust Trl Abilene, TX | 3.0 | 2.0 | 1508 | $2,995 | $1.99 | 43d | 1 | 0.27mi |
| 385 Kristie Path Abilene, TX | 3.0 | 2.0 | 1449 | $2,700 | $1.86 | 2d | 1 | 0.27mi |
| 8009 Sawdust Trl Abilene, TX | 3.0 | 2.0 | 1508 | $2,995 | $1.99 | 43d | 1 | 0.27mi |
| 409 Kristie Path Abilene, TX | 3.0 | 2.0 | 1409 | $2,895 | $2.05 | 5d | 1 | 0.35mi |
| 405 Kristie Path Abilene, TX | 3.0 | 2.0 | 1439 | $2,895 | $2.01 | 7d | 1 | 0.35mi |
| 273 Martis Way Abilene, TX | 4.0 | 2.0 | 1660 | $3,200 | $1.93 | 13d | 1 | 0.43mi |
| 331 Sophia Ln Abilene, TX | 3.0 | 2.0 | 1632 | $3,195 | $1.96 | 3d | 1 | 0.47mi |
| 7309 Wildflower Way Abilene, TX | 3.0 | 2.0 | 1578 | $3,195 | $2.02 | 24d | 1 | 0.53mi |
| 7328 Mountain View Rd Abilene, TX | 3.0 | 2.0 | 1481 | $2,995 | $2.02 | 11d | 1 | 0.58mi |
| 7326 Mountain View Rd Unit 7328 Abilene, TX | 3.0 | 2.0 | 1481 | $2,995 | $2.02 | 11d | 1 | 0.59mi |
| 7319 Mountain View Rd Abilene, TX | 3.0 | 2.0 | 1502 | $4,000 | $2.66 | 43d | 1 | 0.59mi |
| 349 Whiterock Dr Abilene, TX | 4.0 | 2.0 | 1809 | $6,000 | $3.32 | 17d | 1 | 0.80mi |
| 250 Southlake Dr Abilene, TX | 4.0 | 2.0 | 2006 | $3,400 | $1.69 | 2d | 1 | 0.81mi |
| 350 Miss Ellie Ln Abilene, TX | 3.0 | 2.0 | 1414 | $2,600 | $1.84 | 7d | 1 | 1.12mi |
| 350 Miss Ellie Ln Abilene, TX | 3.0 | 2.0 | 1414 | $2,600 | $1.84 | 2d | 1 | 1.12mi |
HOA detail
- Monthly dues
- $21 · $252/yr
Listing history 5 events
-
2026-06-02status $329,900 Pending 24 DOM
-
2026-06-01days on market $329,900 Active 24 DOM
-
2026-05-31days on market $329,900 Active 23 DOM
-
2026-05-30days on market $329,900 Active 22 DOM
-
2026-05-08$329,900 Active 934-char remark
ⓘ Source: listings_history table (triggers on properties + properties_extension) + one-shot
backfill from property_details.listing_events for pre-trigger history.
Nearby sold comps map
Loading sold comps map…
Walkable amenities ~0.75 mi
Loading nearby amenities…
Taxation est. · year 1
- Rental income
- $38,346
- − Mortgage interest
- −$18,480
- − Property taxes
- −$4,948
- − Insurance
- −$1,650
- − Repairs & maintenance
- −$3,068
- − Management
- −$3,068
- − HOA
- −$252
- − Depreciation
- −$9,597
- Taxable loss
- −$2,716
- Est. tax savings @ 24.0%
- +$652
- After-tax cash flow
- $3,335/yr
For passive investors: Depreciation is non-cash, so a rental often shows a tax loss while cash-flowing — sheltering income. Rental losses are passive: they offset passive income freely, and up to $25,000/yr can offset ordinary (W-2) income if you actively participate and your MAGI is under $100k (phasing out to $0 by $150k); unused losses carry forward. On sale, claimed depreciation is recaptured at up to 25%, and gains may owe capital-gains tax (a 1031 exchange can defer both). Figures are a year-1 estimate at your 24.0% rate — not tax advice; consult a CPA.
Condition & rehab AI · 2 photos
This pre-sold semi-custom home in Carriage Hills subdivision is in excellent condition with minimal repairs needed. It offers a good return on investment with updates focusing on curb appeal and interior modernization.
Value-add opportunities
- Both Painting exterior and interior — Enhances curb appeal and interior aesthetics
- Both Landscaping and curb appeal improvements — Improves curb appeal and enhances property value
- Both New flooring in bathrooms and kitchen — Modernizes spaces and improves functionality
- Both New lighting fixtures throughout — Enhances interior ambiance and energy efficiency
Renovation cost estimate screening
Value-add ROI direction
- Both Painting exterior and interior — Enhances curb appeal and interior aesthetics ↑
- Both Landscaping and curb appeal improvements — Improves curb appeal and enhances property value ↑
- Both New flooring in bathrooms and kitchen — Modernizes spaces and improves functionality ↑
- Both New lighting fixtures throughout — Enhances interior ambiance and energy efficiency ↑
ⓘ Cost ranges are severity-bucket heuristics (US national rule-of-thumb). Get contractor quotes + a written scope before underwriting a rehab budget.
Schools (NCES district)
- District
- Wylie ISD
- NCES district ID
- 4846500
- Math proficiency
- 63% ▼ -12.00%
- Reading proficiency
- 62% ▼ -4.00%
- Median HH income
- $78,248
- Composite
- 55.86/100
- National rank
- #1206
- State rank
- #32 of 826 in TX
Livability — Abilene
- Score
- 75/100
- State rank
- #142
- US rank
- #4037
Category grades
Schools grade is shown separately in the Schools card above.
Census & demographics
- Census place
- Abilene, TX
- County
- Taylor County · 136,672 people
- City population
- 136,672
- Metro
- Abilene, TX
- Population (ZIP)
- 27,425
- Household income
- $89,551
- Rent vs Own
- Severe rent burden
- 338.0
Population outlook (Taylor County) Hauer SSP2
- Today (2025)
- 145,270 people
- By 2030
- 150,050 · +3.3%
- By 2040
- 159,417 · +9.7%
- By 2050
- 168,883 · +16.3%
- By 2075
- 194,436 · +33.8%
- By 2100
- 203,163 · +39.9%
Race, ethnicity, and origin ACS 2023
- Neighborhood character
- Majority White (64%)
- Race & ethnicity
- White 64% Hispanic / Latino 22% Two or more races 12% Black 10% Asian 2%
- Hispanic origin (detail)
- Mexican 19%
- Common ancestry
- Romanian 2% Italian 2% Portuguese 2%
- Foreign-born
- 6% · Canada, Vietnam, Jamaica
- Languages at home
- 87% English-only · Spanish 9% Other Asian/Pacific 1% French/Haitian/Cajun 1%
Political lean MEDSL · Taylor
- 2024 margin
- Solid R (+49.8) · D 24.6% · R 74.4% · Other 1.0%
- 2008→2024 swing
- -4.2pp toward R · 2008: -45.6pp · 2024: -49.8pp
- All cycles
- 2024: R+49.8 2020: R+45.3 2016: R+51.1 2012: R+53.6 2008: R+45.6
Not yet ingested
- Civics
- —
Market trends
- HPI YoY
- ▼ -46.04%
- Current HPI
- 189.3098
- Rent YoY
- ▲ 33.46%
- Metro
- Abilene, TX
- State GDP YoY
- ▲ 3.95%
- F500 in state
- 110
Industry mix (Fortune 500 HQ in TX)
| Industry | F500 HQs | Revenue |
|---|---|---|
| Energy | 16 | $1,198B |
|
||
| Technology | 5 | $198B |
|
||
| Engineering / Construction | 4 | $72B |
|
||
| Energy Services | 3 | $60B |
|
||
| Utilities | 3 | $41B |
|
||
| Healthcare | 2 | $330B |
|
||
Price history
2 events — show timeline
- 2026-06-01 Pending — NTREIS
- 2026-05-08 Listed $329,900 NTREIS
Cash-flow waterfall
monthlySold comps — $/sqft
last 12 mo · ≤1 miLoading sold comps…