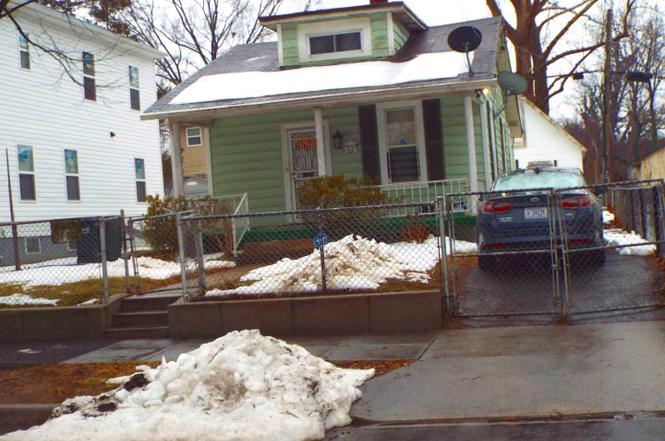
3123 G St SE · Washington, DC
Flood risk 1/10 · Minimal
- FEMA flood zone
- X (unshaded)
- Chance of flooding over 30 yrs
- 0.0%
- Est. flood insurance / yr
- $507 – $1,088
Fire risk 2/10 · Minimal
- Est. fire insurance / yr
- $631 – $1,173
Heat risk 7/10 · Major
- Hot days now (above 104°F)
- 7 days/yr
- Hot days in 30 yrs
- 15 days/yr
Wind risk 4/10 · Minor
- Chance of severe wind over 30 yrs
- 17.0%
Air-quality risk 4/10 · Minor
- Unhealthy air days now
- 4 days/yr
- Unhealthy air days in 30 yrs
- 5 days/yr
Risk factors via First Street. Map © Google.
Why this score? — see what drove the C+ grade
The composite is a weighted blend of 9 inputs, each scored 0–100. Each bar is that input's sub-score; the figure is the points it added to the 100-point composite (weight × sub-score).
- Cash flow +20.7/30.0
- ARV discount +15.0/15.0
- DSCR +6.6/10.0
- 1% rule +4.2/10.0
- Rent growth +4.0/5.0
- Livability +3.7/5.0
- Schools +3.6/10.0
- Condition / age +2.5/5.0
- Appreciation +0.0/10.0
$280,000
🖨 Deal sheet 📄 Offer letter ✓ Due diligence
Listing remarks
REDUCED $20K !Charming 2 bed room 1 bath detached home in quiet Hillcrest neighborhood . Great starter home, or for Buyers looking to down size! Large front porch great for enjoying your morning coffee , or watching the sun go down. The main level offers a formal Living / Dinning room two nice size bedrooms, full bath and kitchen. You have an upper level with can be used as a 3rd bedroom , home office , or home gym. There is a lower level which can be accessed from outside, that can be finished for additional living space. Don't forget about the off street parking for 2 cars. Level back yard with an oversized Shed with lots of storage! New Senior Center that recently opened is 2 blocks
Key facts
- Lower level
- Off street parking
- Large front porch
Tags
Neighborhood map
What this means for you Summary
Snapshot
- This is a 2-bed/1.0-bath single-family listed at $280k.
Deal economics
- At list price, monthly cash flow is $381 ($5k/yr) — positive.
- The deal already cash-flows at list — no discount required.
- To meet the 1% rule (rent ≥ 1% of price), the offer needs to be $259k (7.6% below list).
- Recommended offer: $259k (7.6% below list) — sets the bar for 1% rule.
- Cap rate 7.9% vs local median 2.5% in Washington — top-decile yield for the area; either an underpriced asset or a hidden risk that comps aren't pricing in. Stress-test before assuming the spread holds.
Location & tenants
- Location reads 73/100 on livability (#1 in DC) — a middle-class / working-renter tenant base. Strengths: amenities A+, commute A+, employment A+; Watch: crime F, cost of living F.
- District Of Columbia Public Schools (urban): math 33% / reading 40% proficiency, ranked #8 of 32 in DC (top 25%) — families likely to look elsewhere, expect single-tenant / working-renter base with shorter leases; 65% free/reduced lunch — lower-income household profile, screen leases tightly.
- Market conditions: Rents rising fast (+6.1%/yr); 276 active listings in the ZIP; 40 comparable units currently listed for rent nearby; rentals at typical pace (median 24d on market — plan ~3-4 weeks tenant-placement turnaround); 1,737 units permitted in District of Columbia in 2024 (1,506 in 5+ unit buildings).
- At $2,586/mo this rent would consume 53% of the median local household income ($58k/yr) (locally 5115% of renters already pay >50% of income on rent) — very limited rent-growth headroom before tenants either downsize or default.
Forward outlook
- Local home prices are declining (-3.0%/yr); year-one equity from $2k of loan paydown is wiped out by about $8k of value loss. Plan a longer hold.
- District of Columbia County population projected at +50% by 2050 — long-run rental-demand tailwind backs the buy-and-hold thesis.
Negotiation context
- It's been on market 56 days — a 3% lower offer ($272k) is reasonable based on typical stale-listing flexibility.
- Current owner paid $16k; list at $280k implies a 1706% gain — meaningful room to come down on a strong offer.
Risks & watch-outs
- Watch-outs: built in 1926 — expect roof / HVAC / electrical / plumbing capex.
- Climate carrying-cost: extreme-heat days projected 7→15/yr by 2055 (HVAC capex compounding) — expect insurance premiums to compound above CPI over the hold.
Questions for the listing agent
- It's been on market 56 days. Have you received any prior offers? Is the seller open to a 8% concession, seller financing, or rate buy-down credit?
- Built in 1926 — when were the roof, HVAC, electrical panel, plumbing, and water heater last replaced?
- Is there a deadline driving the sale (1031 exchange, divorce, estate, relocation)? That informs how much negotiation room exists.
- Crime grade is F in this area — have there been break-ins, vandalism, or insurance claims at this property in the last 3 years? What carrier currently insures it and at what premium?
- What's the average days-on-market for RENTAL listings here right now (not sales)? A rising rental-DOM trend means longer vacancies and softer asking-rent achievability than the comps imply.
- What's the recent tenant-quality profile in this submarket — average credit score on applications, eviction rate, late-payment / NSF rate, and stable-employment percentage? A property-management company in the area should have these aggregated.
- How much new for-sale + rental construction is in the pipeline within 1–3 miles? Heavy new supply typically softens prices + rents 12–24 months out; constrained supply supports both.
Investment metrics
- 1% rule
- 0.92% ✗
- Cap rate
- 7.93%
- Cash-on-cash
- 5.84%
- DSCR
- 1.26
- GRM
- 9.0
CMA / ARV
- ARV (on-the-fly)
- $445,824
- Comps found
- 4
Show comp detail 4 sales within ~0.75 mi
| Address | Dist | Beds/Ba | Sqft | Sold | Price | $/sf | Match |
|---|---|---|---|---|---|---|---|
| 3304 E St SE | 0.24mi | 3/1.0 (+1) | 1,161 (-10%) | 2mo | $125,000 | $108 | 64 |
| 3209 E St SE | 0.19mi | 3/2.0 (+1) | 1,440 (+11%) | 5mo | $210,000 | $146 | 60 |
| 2522 Park Pl SE | 0.72mi | 3/1.5 (+1) | 1,408 (+9%) | 1mo | $485,000 | $344 | 44 |
| 1336 30th St SE | 0.48mi | 3/2.0 (+1) | 1,120 (-14%) | 12mo | $430,000 | $384 | 36 |
Match score weights: distance 35% · size 25% · config 20% · recency 20%. Top-matched comps best support the ARV.
Projected returns pro-forma
-3.0% appreciation · 6.06% rent growth · sell at horizon
- IRR
- -4.3%
- Equity multiple
- 0.83×
- Total profit
- $-13,012
- Equity at exit
- $41,749
- IRR
- 8.2%
- Equity multiple
- 1.70×
- Total profit
- $55,272
- Equity at exit
- $24,209
Cash invested: $78,400 (down + closing). Projections, not guarantees.
Landlord ↔ Tenant lean methodology
- Overall (CITY)
- 0 Strongly Tenant-Friendly
- State District of Columbia
- 12 Strongly Tenant-Friendly · D+43
- County
- — inherits STATE
- City Washington
- 0 Strongly Tenant-Friendly · D+43
ZIP-level market 20019
- Rents YoY
- 6.1%
- Active inventory
- 276
- Price-to-rent
- 9.0×
Monthly cashflow live
- Estimated rent
- $2,586 high interval (Pro) →
- Mortgage (P&I)
- −$1,468
- Tax from tax record
- −$77 /mo · $919/yr
- Insurance
- −$117
- HOA
- −$0
- Vacancy / Maint / Mgmt
- −$543
- Net cashflow
- $381
Break-even live
UW: 25.0% down · 7.5% · 30yr · 1.5% tax · 5.0% vac · 8.0% maint · 8.0% mgmt
Financing live
Cash to close
- Down payment
- $70,000
- Closing costs
- $8,400
- Reserves months
- —
- Total cash needed
- —
Loan-product check · same deal, 3 products live
Conventional
25% down · 7.5% · 30yr
- Down + closing
- —
- Monthly P&I
- —
- Monthly cashflow
- —
- DSCR
- —
- Eligible?
- —
Personal DTI + credit; lowest rate.
DSCR
20% down · 8.5% · 30yr
- Down + closing
- —
- Monthly P&I
- —
- Monthly cashflow
- —
- DSCR
- —
- Eligible?
- —
No personal income docs; deal must DSCR.
Hard money
10% down · 12.0% · 12mo
- Down + closing
- —
- Monthly P&I
- —
- Monthly cashflow
- —
- DSCR
- —
- Eligible?
- —
Short-term bridge; refi at stabilization.
Rent comps 40 comps
| Address | Beds | Baths | Sqft | Rent | $/sqft | DOM | Units | Dist |
|---|---|---|---|---|---|---|---|---|
| 3101 E St SE Washington, DC | 2.0 | 2.0 | 1283 | $2,500 | $1.95 | 20d | 1 | 0.19mi |
| 21 Randle Cir SE Washington, DC | 2.0 | 1.0 | 1100 | $2,477 | $2.25 | 24d | 1 | 0.19mi |
| 3128 Lyndale Pl SE Washington, DC | 3.0 | 2.0 | 1552 | $2,800 | $1.80 | 18d | 1 | 0.21mi |
| 3600 Ely Pl SE Washington, DC | 1.0–3.0 | 1.0 | 719 | $2,088 | $2.90 | 2d | 10 | 0.49mi |
| 3532 Minnesota Ave SE Unit 3 Washington, DC | 3.0 | 1.0 | 1100 | $2,500 | $2.27 | 24d | 1 | 0.60mi |
| 2418 L'Enfant Sq SE Unit 8 Washington, DC | 2.0 | 2.0 | 960 | $2,400 | $2.50 | 4d | 1 | 0.61mi |
| 2925-2929 Pennsylvania Ave SE Unit 204 Washington, DC | 3.0 | 1.0 | 980 | $3,000 | $3.06 | 3d | 1 | 0.65mi |
| 1525 28th St SE Unit 302 Washington, DC | 3.0 | 1.0 | 900 | $2,100 | $2.33 | 24d | 1 | 0.70mi |
| 3539 A St SE Washington, DC | 1.0–2.0 | 1.0–2.0 | 807 | $1,403 | $1.74 | 17d | 1 | 0.72mi |
| 1616 27th St SE Unit 6 Washington, DC | 3.0 | 1.0 | 1100 | $2,850 | $2.59 | 24d | 1 | 0.77mi |
| 1707 29th St SE Unit 2 Washington, DC | 2.0 | 1.0 | 1200 | $2,350 | $1.96 | 2d | 1 | 0.78mi |
| 1901 C St SE Washington, DC | 2.0 | 1.0–2.0 | 839 | $3,504 | $4.18 | 1d | 11 | 0.81mi |
| 1800 28th Pl SE #201 Washington, DC | 3.0 | 2.0 | 1132 | $2,800 | $2.47 | 2d | 1 | 0.84mi |
| 2515 R St SE Washington, DC | 1.0–2.0 | 1.0 | 812 | $1,755 | $2.16 | 5d | 2 | 0.88mi |
| 1805 Potomac Ave SE Washington, DC | 3.0 | 1.5 | 1598 | $4,000 | $2.50 | 24d | 1 | 0.89mi |
| 1955 Fairlawn Ave SE Unit 2A Washington, DC | 2.0 | 2.0 | 1000 | $2,499 | $2.50 | 24d | 1 | 0.92mi |
| 3423 Baker St NE Washington, DC | 2.0 | 1.5 | 1300 | $2,100 | $1.62 | 24d | 1 | 0.92mi |
| 3337 Clay St NE Washington, DC | 2.0 | 1.0 | 1144 | $3,250 | $2.84 | 24d | 1 | 0.93mi |
| 3351 Clay St NE Washington, DC | 2.0 | 1.5 | 1312 | $2,500 | $1.91 | 24d | 1 | 0.94mi |
| 6 Barney Cir SE Washington, DC | 3.0 | 1.0 | 1200 | $2,550 | $2.12 | 10d | 1 | 1.03mi |
| 4318 G St SE Washington, DC | 2.0 | 2.5 | 1376 | $2,500 | $1.82 | 18d | 1 | 1.04mi |
| 1835 E Capitol St SE Unit 1 Washington, DC | 2.0 | 1.0 | 912 | $2,600 | $2.85 | 24d | 1 | 1.06mi |
| 1600 Pennsylvania Ave SE Washington, DC | 1.0–2.0 | 1.0–2.0 | 743 | $3,248 | $4.37 | 2d | 4 | 1.07mi |
| 1938 S St SE Washington, DC | 3.0 | 2.0 | 1522 | $2,999 | $1.97 | 24d | 1 | 1.09mi |
| 1617 C St SE Washington, DC | 2.0 | 2.5 | 1352 | $3,750 | $2.77 | 1d | 1 | 1.12mi |
| 1617 C St SE Washington, DC | 2.0 | 2.5 | 1352 | $3,750 | $2.77 | 18d | 1 | 1.12mi |
| 2562 Naylor Rd SE Washington, DC | 1.0–2.0 | 1.0 | 790 | $2,075 | $2.63 | 2d | 21 | 1.12mi |
| 813 Hilltop Ter SE Washington, DC | 3.0 | 1.5 | 1660 | $4,500 | $2.71 | 7d | 1 | 1.15mi |
| 4011 Blaine St NE Washington, DC | 3.0 | 1.0 | 1632 | $2,500 | $1.53 | 24d | 1 | 1.16mi |
| 924 15th St SE Washington, DC | 2.0 | 2.0 | 1100 | $3,450 | $3.14 | 24d | 1 | 1.16mi |
| 127 17th St SE Washington, DC | 1.0 | 1.0 | 900 | $2,495 | $2.77 | 24d | 1 | 1.16mi |
| 1717 E Capitol St SE Washington, DC | 2.0 | 1.0–2.0 | 707 | $2,735 | $3.87 | 1d | 11 | 1.16mi |
| 812 Burns St SE Washington, DC | 3.0 | 2.5 | 1280 | $3,300 | $2.58 | 24d | 1 | 1.17mi |
| 406 15th St SE Unit B Washington, DC | 2.0 | 2.5 | 1700 | $4,200 | $2.47 | 17d | 1 | 1.19mi |
| 2112 34th St SE Washington, DC | 2.0 | 1.5 | 1284 | $3,300 | $2.57 | 24d | 1 | 1.19mi |
| 270 15th St SE Washington, DC | 2.0 | 2.0 | 875 | $3,595 | $4.11 | 7d | 1 | 1.22mi |
| 1513 Massachusetts Ave SE Unit B Washington, DC | 1.0 | 1.0 | 1288 | $1,623 | $1.26 | 24d | 1 | 1.23mi |
| 4110 Ames St NE #14 Washington, DC | 2.0 | 1.0 | 1098 | $1,850 | $1.68 | 24d | 1 | 1.24mi |
| 2202 U Pl SE Washington, DC | 2.0 | 1.5 | 1232 | $3,500 | $2.84 | 24d | 1 | 1.25mi |
| 2300 Good Hope Rd SE Washington, DC | 2.0 | 1.0–2.0 | 1020 | $1,913 | $1.88 | 24d | 6 | 1.25mi |
Listing history 5 events
-
2026-04-14status Pending
-
2026-04-12historical
-
2026-03-13price $280,000
-
2026-02-15$299,999 Active
-
1970-12-07soldstatus $15,500
ⓘ Source: listings_history table (triggers on properties + properties_extension) + one-shot
backfill from property_details.listing_events for pre-trigger history.
Tax reassessment forecast DC · Partial reset (capped growth)
- Current annual tax
- $919 · $77/mo
- Projected year-2 tax
- $1,314 · $109/mo
- Expected delta
- +$394/yr (+$33/mo · 42.9%)
ⓘ Screening estimate from a state-policy table — verify with the county assessor before closing.
Climate risk First Street
- Flood 1/10 Low FEMA zone X (unshaded) · 0% chance over 30 yrs
- Wildfire 2/10 Low
- Heat 7/10 Severe 7 d/yr ≥104°F today · 15 d/yr by 30 yrs out
- Wind 4/10 Moderate 17% chance of damaging wind over 30 yrs
- Air quality 4/10 Moderate 4 unhealthy d/yr today · 5 by 30 yrs out
Nearby sold comps map
Loading sold comps map…
Walkable amenities ~0.75 mi
Loading nearby amenities…
Taxation est. · year 1
- Rental income
- $31,032
- − Mortgage interest
- −$15,684
- − Property taxes
- −$919
- − Insurance
- −$1,400
- − Repairs & maintenance
- −$2,483
- − Management
- −$2,483
- − Depreciation
- −$8,145
- Taxable loss
- −$83
- Est. tax savings @ 24.0%
- +$20
- After-tax cash flow
- $4,595/yr
For passive investors: Depreciation is non-cash, so a rental often shows a tax loss while cash-flowing — sheltering income. Rental losses are passive: they offset passive income freely, and up to $25,000/yr can offset ordinary (W-2) income if you actively participate and your MAGI is under $100k (phasing out to $0 by $150k); unused losses carry forward. On sale, claimed depreciation is recaptured at up to 25%, and gains may owe capital-gains tax (a 1031 exchange can defer both). Figures are a year-1 estimate at your 24.0% rate — not tax advice; consult a CPA.
Schools (NCES district)
- District
- District Of Columbia Public Schools
- NCES district ID
- 1100030
- Math proficiency
- 33% ▲ 3.00%
- Reading proficiency
- 40% ▲ 5.00%
- Median HH income
- $67,671
- Composite
- 35.84/100
- National rank
- #9606
- State rank
- #8 of 32 in DC
Livability — Washington
- Score
- 73/100
- State rank
- #1
- US rank
- #5327
Category grades
Schools grade is shown separately in the Schools card above.
Census & demographics
- Census place
- Washington, DC
- County
- District of Columbia · 671,873 people
- City population
- 671,873
- Metro
- Washington-Arlington-Alexandria, DC-VA-MD-WV
- Population (ZIP)
- 63,380
- Household income
- $58,296
- Rent vs Own
- Severe rent burden
- 5115.0
Population outlook (District of Columbia County) Hauer SSP2
- Today (2025)
- 821,926 people
- By 2030
- 899,517 · +9.4%
- By 2040
- 1,061,162 · +29.1%
- By 2050
- 1,231,493 · +49.8%
- By 2075
- 1,603,312 · +95.1%
- By 2100
- 1,847,141 · +124.7%
Race, ethnicity, and origin ACS 2023
- Neighborhood character
- Predominantly Black (87%)
- Race & ethnicity
- Black 87% Hispanic / Latino 7% Two or more races 4% White 2%
- Hispanic origin (detail)
- Mexican 1% Dominican 1%
- Foreign-born
- 6% · Canada
- Languages at home
- 91% English-only · Spanish 6% French/Haitian/Cajun 1%
Political lean MEDSL · District of Columbia
- 2024 margin
- Solid D (+86.1) · D 91.2% · R 5.1% · Other 3.8%
- 2008→2024 swing
- +0.1pp no change · 2008: 85.9pp · 2024: 86.1pp
- All cycles
- 2024: D+86.1 2020: D+86.8 2016: D+88.7 2012: D+84.2 2008: D+85.9
Not yet ingested
- Civics
- —
Market trends
- HPI YoY
- ▼ -416.91%
- Current HPI
- 326.4481
- Rent YoY
- ▲ 6.06%
- Metro
- Washington-Arlington-Alexandria, DC-VA-MD-WV
- State GDP YoY
- ▲ 1.33%
- F500 in state
- 6
Industry mix (Fortune 500 HQ in DC)
| Industry | F500 HQs | Revenue |
|---|---|---|
| Financial Services | 1 | $153B |
|
||
| Life Sciences / Industrials | 1 | $25B |
|
||
| Industrial Machinery | 1 | $8B |
|
||
Price history
+1706.5% since first listed5 events — show timeline
- 2026-04-14 Pending — BRIGHT MLS
- 2026-04-12 Listing Removed — BRIGHT MLS
- 2026-03-13 Price Changed $280,000 BRIGHT MLS
- 2026-02-15 Listed $299,999 BRIGHT MLS
- 1970-12-07 Sold (Public Records) $15,500 Public Records
Property tax history
+4.1%/yrLatest (2025): $919 · +0.7% YoY. Source: county tax records.
Cash-flow waterfall
monthlySold comps — $/sqft
last 12 mo · ≤1 miLoading sold comps…