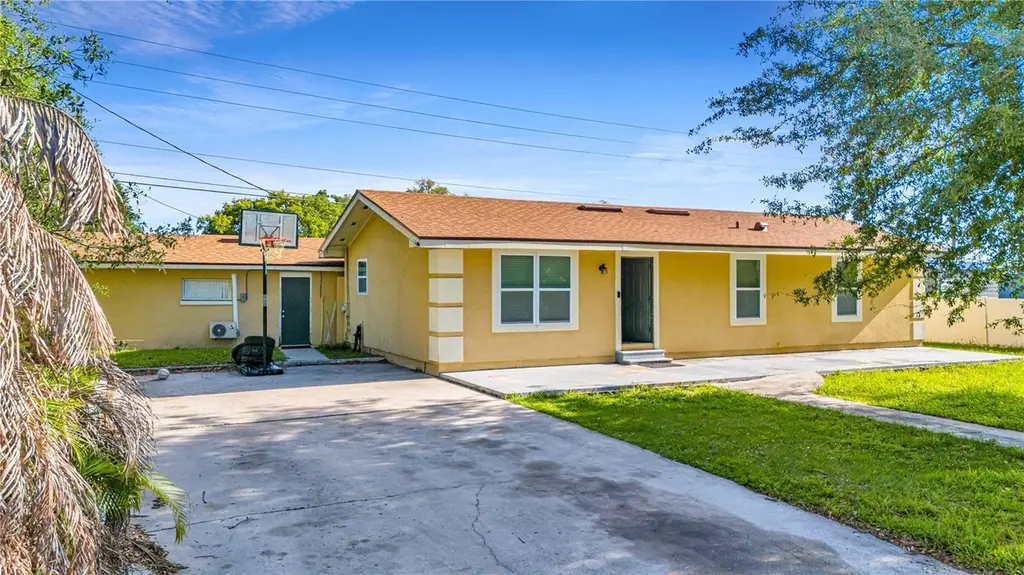
4325 Lake Ave · Campbell, FL
Flood risk 1/10 · Minimal
- FEMA flood zone
- X (unshaded)
- Chance of flooding over 30 yrs
- 0.0%
- Est. flood insurance / yr
- $507 – $1,088
Fire risk 2/10 · Minimal
- Est. fire insurance / yr
- $947 – $1,759
Heat risk 8/10 · Major
- Hot days now (above 108°F)
- 7 days/yr
- Hot days in 30 yrs
- 23 days/yr
Wind risk 9/10 · Severe
- Chance of severe wind over 30 yrs
- 99.0%
Air-quality risk 1/10 · Minimal
- Unhealthy air days now
- 0 days/yr
- Unhealthy air days in 30 yrs
- 0 days/yr
Risk factors via First Street. Map © Google.
Why this score? — see what drove the C- grade
The composite is a weighted blend of 9 inputs, each scored 0–100. Each bar is that input's sub-score; the figure is the points it added to the 100-point composite (weight × sub-score).
- Cash flow +16.1/30.0
- ARV discount +15.0/15.0
- DSCR +5.0/10.0
- Schools +3.6/10.0
- 1% rule +3.4/10.0
- Livability +2.9/5.0
- Condition / age +2.5/5.0
- Rent growth +2.2/5.0
- Appreciation +0.0/10.0
$294,900
🖨 Deal sheet (PDF) 📄 Offer letter ✓ Due diligence
Listing remarks MLS
Great House in Kissimmee near 441 17-92 Near shopping area. It has a new AC, New Stocco and all new Windows call today for a showing.
Key facts
- Spacious yard
- Private in-law suite
- Separate entrance
Tags
Property features AI
Exterior
- Parking: 1-car garage
- Utilities: Well water; Public sewer and septic tank; Public utilities
- Home design: Single-family residence; One story; Faces north
- Construction: Stucco and frame construction; Shingle roof; Slab foundation; Built on lot of about 0.19 acres
- Exterior features: Concrete road access
Interior
- Kitchen: Microwave; Range; Refrigerator
- Bedrooms: 4 bedrooms
- Flooring: Laminate; Tile
- Bathrooms: 2 full bathrooms
- Heating & cooling: Central heating (electric); Central air conditioning
- Interior features: Ceiling fans; Thermostat
- Laundry & utility: Laundry inside
Neighborhood map
What this means for you Summary
Snapshot
- This is a 4-bed/2.0-bath single-family listed at $295k.
Deal economics
- At list price, monthly cash flow is $149 ($2k/yr) — positive.
- The deal already cash-flows at list — no discount required.
- To meet the 1% rule (rent ≥ 1% of price), the offer needs to be $249k (15.6% below list).
- Recommended offer: $249k (15.6% below list) — sets the bar for 1% rule.
- Cap rate 6.9% vs local median 4.2% in Campbell — top-decile yield for the area; either an underpriced asset or a hidden risk that comps aren't pricing in. Stress-test before assuming the spread holds.
Location & tenants
- Location reads 58/100 on livability (#848 in FL) — a working-class tenant base; expect higher turnover. Strengths: cost of living A+, crime A, housing A-; Watch: amenities F, commute F, employment F.
- Osceola (suburban): math 39% / reading 45% proficiency, ranked #60 of 73 in FL (top 82%) — families likely to look elsewhere, expect single-tenant / working-renter base with shorter leases; 60% free/reduced lunch — lower-income household profile, screen leases tightly.
- Zoned schools: Sunrise Elementary School (math 38% / reading 41%, grade F, #1,513 of 2,144 statewide, top 73%, 1,068 students, 51% FRL); Horizon Middle School (math 40% / reading 41%, grade F, #360 of 571 statewide, top 64%, 1,295 students, 75% FRL); Poinciana High School (math 24% / reading 31%, grade F, #470 of 667 statewide, top 71%, 2,455 students, 48% FRL) — zoned schools at 58% FRL track the district average.
- Market conditions: Rents soft (-1.2%/yr); 1296 active listings in the ZIP; 27 comparable units currently listed for rent nearby; rentals at typical pace (median 24d on market — plan ~3-4 weeks tenant-placement turnaround); 8,813 units permitted in Osceola County in 2024 (3,072 in 5+ unit buildings).
- This rent runs 42% of the median local income ($71k/yr) — at the standard rent-burdened threshold; future hikes will face affordability resistance.
Forward outlook
- Local home prices are declining (-3.0%/yr); year-one equity from $2k of loan paydown is wiped out by about $9k of value loss. Plan a longer hold.
- Osceola County population projected at +73% by 2050 — long-run rental-demand tailwind backs the buy-and-hold thesis.
Negotiation context
- It's been on market 35 days — a 3% lower offer ($286k) is reasonable based on typical stale-listing flexibility.
- 4 sale attempts since 7y ago with the ask held roughly flat each time — persistent listings suggest the price (not the market) is what's stuck; bring a comps-based counter.
- Current owner paid $180k; list at $295k implies a 64% gain — meaningful room to come down on a strong offer.
Risks & watch-outs
- Climate carrying-cost: severe wind risk, 99% chance of damaging wind over 30y; extreme-heat days projected 7→23/yr by 2055 (HVAC capex compounding) — expect insurance premiums to compound above CPI over the hold.
Questions for the listing agent
- It's been on market 35 days. Have you received any prior offers? Is the seller open to a 16% concession, seller financing, or rate buy-down credit?
- Is there a deadline driving the sale (1031 exchange, divorce, estate, relocation)? That informs how much negotiation room exists.
- Schools are F-rated, which usually means shorter tenancies and higher turnover. Who's the typical renter profile here, and what's been the actual vacancy rate?
- What's the average days-on-market for RENTAL listings here right now (not sales)? A rising rental-DOM trend means longer vacancies and softer asking-rent achievability than the comps imply.
- What's the recent tenant-quality profile in this submarket — average credit score on applications, eviction rate, late-payment / NSF rate, and stable-employment percentage? A property-management company in the area should have these aggregated.
- How much new for-sale + rental construction is in the pipeline within 1–3 miles? Heavy new supply typically softens prices + rents 12–24 months out; constrained supply supports both.
Investment metrics
- 1% rule
- 0.84% ✗
- Cap rate
- 6.90%
- Cash-on-cash
- 2.16%
- DSCR
- 1.10
- GRM
- 9.9
CMA / ARV
- ARV (on-the-fly)
- $367,010
- Comps found
- 9
Show comp detail 9 sales within ~0.75 mi
| Address | Dist | Beds/Ba | Sqft | Sold | Price | $/sf | Match |
|---|---|---|---|---|---|---|---|
| 4174 Babbling Brook Way | 0.35mi | 4/2.0 | 1,843 (+8%) | 14mo | $394,000 | $214 | 59 |
| 1794 Lindens St | 0.31mi | 3/2.5 (-1) | 1,463 (-15%) | 2mo | $324,990 | $222 | 52 |
| 1815 Orange Vista Blvd | 0.30mi | 3/2.0 (-1) | 1,578 (-8%) | 18mo | $375,000 | $238 | 52 |
| 1918 Birnham Wood Bnd | 0.57mi | 3/2.0 (-1) | 1,551 (-10%) | 3mo | $310,000 | $200 | 50 |
| 1920 Grove Ct | 0.73mi | 3/2.0 (-1) | 1,780 (+4%) | 10mo | $420,000 | $236 | 47 |
| 1959 Cricket Cradle Dr | 0.64mi | 3/2.0 (-1) | 1,560 (-9%) | 5mo | $321,000 | $206 | 46 |
| 1950 Birnham Wood Bnd | 0.62mi | 3/2.0 (-1) | 1,560 (-9%) | 6mo | $315,000 | $202 | 46 |
| 1979 Cricket Cradle Dr | 0.68mi | 3/2.0 (-1) | 1,560 (-9%) | 6mo | $350,000 | $224 | 43 |
| 1983 Cricket Cradle Dr | 0.69mi | 4/2.0 | 1,843 (+8%) | 22mo | $371,000 | $201 | 36 |
Match score weights: distance 35% · size 25% · config 20% · recency 20%. Top-matched comps best support the ARV.
Projected returns pro-forma
-3.0% appreciation · 0.0% rent growth · sell at horizon
- IRR
- -16.0%
- Equity multiple
- 0.45×
- Total profit
- $-45,696
- Equity at exit
- $43,971
- IRR
- -13.3%
- Equity multiple
- 0.32×
- Total profit
- $-56,165
- Equity at exit
- $25,498
Cash invested: $82,572 (down + closing). Projections, not guarantees.
Landlord ↔ Tenant lean methodology
- Overall (STATE)
- 87 Strongly Landlord-Friendly
- State Florida
- 87 Strongly Landlord-Friendly · R+3
- County
- — inherits STATE
- City
- — inherits STATE
ZIP-level market 34746
- Home prices YoY
- -33.4%
- Rents YoY
- -1.2%
- Active inventory
- 1296
- Price-to-rent
- 9.9×
Monthly cashflow live
- Estimated rent
- $2,488 high interval (Pro) →
- Mortgage (P&I)
- −$1,546
- Tax from tax record
- −$148 /mo · $1,772/yr
- Insurance
- −$123
- HOA
- −$0
- Vacancy / Maint / Mgmt
- −$523
- Net cashflow
- $149
Break-even live
Sensitivity live
| Price | -10% $316 | -5% $232 | +0% $149 | +5% $65 | +10% $-18 |
|---|---|---|---|---|---|
| Rent | -10% $-48 | -5% $51 | +0% $149 | +5% $247 | +10% $345 |
| Rate | -1.0pp $297 | -0.5pp $224 | base $149 | +0.5pp $72 | +1.0pp $-5 |
UW: 25.0% down · 7.5% · 30yr · 1.5% tax · 5.0% vac · 8.0% maint · 8.0% mgmt
Financing live
Cash to close
- Down payment
- $73,725
- Closing costs
- $8,847
- Reserves months
- —
- Total cash needed
- —
Loan-product check · same deal, 3 products live
Conventional
25% down · 7.5% · 30yr
- Down + closing
- —
- Monthly P&I
- —
- Monthly cashflow
- —
- DSCR
- —
- Eligible?
- —
Personal DTI + credit; lowest rate.
DSCR
20% down · 8.5% · 30yr
- Down + closing
- —
- Monthly P&I
- —
- Monthly cashflow
- —
- DSCR
- —
- Eligible?
- —
No personal income docs; deal must DSCR.
Hard money
10% down · 12.0% · 12mo
- Down + closing
- —
- Monthly P&I
- —
- Monthly cashflow
- —
- DSCR
- —
- Eligible?
- —
Short-term bridge; refi at stabilization.
Rent comps 27 comps
| Address | Beds | Baths | Sqft | Rent | $/sqft | DOM | Units | Dist |
|---|---|---|---|---|---|---|---|---|
| 1814 Lindens St Kissimmee, FL | 3.0 | 2.5 | 1463 | $2,200 | $1.50 | 25d | 1 | 0.25mi |
| 4383 Hazel St Kissimmee, FL | 3.0 | 2.5 | 1616 | $2,200 | $1.36 | 25d | 1 | 0.30mi |
| 4391 Hazel St Kissimmee, FL | 3.0 | 2.5 | 1614 | $2,200 | $1.36 | 23d | 1 | 0.30mi |
| 4273 Babbling Brook Way Kissimmee, FL | 3.0 | 2.0 | 1444 | $2,000 | $1.39 | 21d | 1 | 0.38mi |
| 4273 Babbling Brook Way Kissimmee, FL | 3.0 | 2.0 | 1444 | $2,000 | $1.39 | 6d | 1 | 0.38mi |
| 4327 Babbling Brook Way Kissimmee, FL | 3.0 | 2.0 | 1444 | $2,000 | $1.39 | 4d | 1 | 0.45mi |
| 1918 Birnham Wood Bnd Kissimmee, FL | 3.0 | 2.0 | 1551 | $2,099 | $1.35 | 25d | 1 | 0.56mi |
| 4213 Green Gables Pl Kissimmee, FL | 3.0 | 2.0 | 1555 | $2,300 | $1.48 | 25d | 1 | 0.68mi |
| 1918 Ancestry Trl Kissimmee, FL | 3.0 | 2.0 | 1432 | $2,200 | $1.54 | 25d | 1 | 0.70mi |
| 2002 Myrtle Pine St Kissimmee, FL | 3.0 | 2.0 | 2115 | $2,600 | $1.23 | 0d | 1 | 0.93mi |
| 4213 Patterson Cv Kissimmee, FL | 3.0 | 2.0 | 1700 | $2,490 | $1.46 | 0d | 1 | 0.95mi |
| 4213 Patterson Cv Kissimmee, FL | 3.0 | 2.0 | 1700 | $2,490 | $1.46 | 25d | 1 | 0.95mi |
| 4269 Nightcaps Way Kissimmee, FL | 3.0 | 2.0 | 1555 | $2,500 | $1.61 | 25d | 1 | 1.06mi |
| 4497 Bluff Oak Loop Kissimmee, FL | 3.0 | 2.0 | 2115 | $2,290 | $1.08 | 5d | 1 | 1.08mi |
| 4215 Nightcaps Way Kissimmee, FL | 4.0 | 2.0 | 1853 | $2,450 | $1.32 | 0d | 1 | 1.08mi |
| 2293 Pocky Way Kissimmee, FL | 4.0 | 2.0 | 1854 | $2,490 | $1.34 | 25d | 1 | 1.14mi |
| 4301 Twisted Twig Bnd Kissimmee, FL | 3.0 | 2.0 | 1267 | $2,300 | $1.82 | 25d | 1 | 1.16mi |
| 3949 Ambrose Ave Kissimmee, FL | 3.0 | 2.0 | 1560 | $2,300 | $1.47 | 0d | 1 | 1.18mi |
| 4207 Mountain Laurel Ln Kissimmee, FL | 3.0 | 2.0 | 1260 | $2,600 | $2.06 | 25d | 1 | 1.19mi |
| 2359 Pocky Way Kissimmee, FL | 3.0 | 2.0 | 1560 | $2,300 | $1.47 | 25d | 1 | 1.25mi |
| 1552 Loxley Trl Kissimmee, FL | 4.0 | 2.0 | 1936 | $2,650 | $1.37 | 9d | 1 | 1.30mi |
| 1582 Loxley Trl Kissimmee, FL | 4.0 | 2.0 | 1936 | $2,400 | $1.24 | 25d | 1 | 1.32mi |
| 4659 Cumbrian Lakes Dr Kissimmee, FL | 4.0 | 3.5 | 1830 | $2,495 | $1.36 | 19d | 1 | 1.36mi |
| 4742 Cumbrian Lakes Dr Kissimmee, FL | 4.0 | 3.0 | 1874 | $2,600 | $1.39 | 19d | 1 | 1.37mi |
| 4585 Golden Knight Blvd Kissimmee, FL | 4.0 | 2.0 | 1936 | $2,800 | $1.45 | 9d | 1 | 1.38mi |
| 4795 Cumbrian Lakes Dr Kissimmee, FL | 4.0 | 3.0 | 1720 | $2,600 | $1.51 | 25d | 1 | 1.47mi |
| 1137 Liberty Hall Dr Kissimmee, FL | 3.0 | 2.0 | 1536 | $2,350 | $1.53 | 6d | 1 | 1.48mi |
Listing history 12 events
-
2026-05-19status Pending
-
2026-04-28price $294,900
-
2026-04-14$299,900 Active
-
2019-07-10soldstatus $180,000
-
2019-07-05soldstatus $180,000 Sold 133-char remark
Show marketing remark (133 chars)
Great House in Kissimmee near 441 17-92 Near shopping area. It has a new AC, New Stocco and all new Windows call today for a showing.
-
2019-05-31status Pending 133-char remark
Show marketing remark (133 chars)
Great House in Kissimmee near 441 17-92 Near shopping area. It has a new AC, New Stocco and all new Windows call today for a showing.
-
2019-05-24status Active 133-char remark
Show marketing remark (133 chars)
Great House in Kissimmee near 441 17-92 Near shopping area. It has a new AC, New Stocco and all new Windows call today for a showing.
-
2019-04-08status Pending 133-char remark
Show marketing remark (133 chars)
Great House in Kissimmee near 441 17-92 Near shopping area. It has a new AC, New Stocco and all new Windows call today for a showing.
-
2019-03-19status Active 133-char remark
Show marketing remark (133 chars)
Great House in Kissimmee near 441 17-92 Near shopping area. It has a new AC, New Stocco and all new Windows call today for a showing.
-
2019-02-26status Pending 133-char remark
Show marketing remark (133 chars)
Great House in Kissimmee near 441 17-92 Near shopping area. It has a new AC, New Stocco and all new Windows call today for a showing.
-
2019-02-08$179,900 Active 133-char remark
Show marketing remark (133 chars)
Great House in Kissimmee near 441 17-92 Near shopping area. It has a new AC, New Stocco and all new Windows call today for a showing.
-
2018-12-07soldstatus $101,000
ⓘ Source: listings_history table (triggers on properties + properties_extension) + one-shot
backfill from property_details.listing_events for pre-trigger history.
Tax reassessment forecast FL · Resets to sale price
- Current annual tax
- $1,772 · $148/mo
- Projected year-2 tax
- $2,448 · $204/mo
- Expected delta
- +$676/yr (+$56/mo · 38.1%)
ⓘ Screening estimate from a state-policy table — verify with the county assessor before closing.
Climate risk First Street
- Flood 1/10 Low FEMA zone X (unshaded) · 0% chance over 30 yrs
- Wildfire 2/10 Low
- Heat 8/10 Severe 7 d/yr ≥108°F today · 23 d/yr by 30 yrs out
- Wind 9/10 Extreme 99% chance of damaging wind over 30 yrs
- Air quality 1/10 Low 0 unhealthy d/yr today · 0 by 30 yrs out
Nearby sold comps map
Loading sold comps map…
Walkable amenities ~0.75 mi
Loading nearby amenities…
Taxation est. · year 1
- Rental income
- $29,861
- − Mortgage interest
- −$16,519
- − Property taxes
- −$1,772
- − Insurance
- −$1,474
- − Repairs & maintenance
- −$2,389
- − Management
- −$2,389
- − Depreciation
- −$8,579
- Taxable loss
- −$3,261
- Est. tax savings @ 24.0%
- +$783
- After-tax cash flow
- $2,569/yr
For passive investors: Depreciation is non-cash, so a rental often shows a tax loss while cash-flowing — sheltering income. Rental losses are passive: they offset passive income freely, and up to $25,000/yr can offset ordinary (W-2) income if you actively participate and your MAGI is under $100k (phasing out to $0 by $150k); unused losses carry forward. On sale, claimed depreciation is recaptured at up to 25%, and gains may owe capital-gains tax (a 1031 exchange can defer both). Figures are a year-1 estimate at your 24.0% rate — not tax advice; consult a CPA.
Schools (NCES district)
- District
- Osceola
- NCES district ID
- 1201470
- Math proficiency
- 39% ▼ -9.00%
- Reading proficiency
- 45% ▼ -4.00%
- Median HH income
- $45,528
- Composite
- 35.7/100
- National rank
- #4865
- State rank
- #60 of 73 in FL
Livability — Campbell
- Score
- 58/100
- State rank
- #848
- US rank
- #21421
Category grades
Schools grade is shown separately in the Schools card above.
Census & demographics
- Census place
- Campbell, FL
- County
- Osceola County · 410,217 people
- City population
- 60,595
- Metro
- Orlando-Kissimmee-Sanford, FL
- Population (ZIP)
- 60,595
- Household income
- $70,998
- Rent vs Own
- Severe rent burden
- 1690.0
Population outlook (Osceola County) Hauer SSP2
- Today (2025)
- 447,624 people
- By 2030
- 511,823 · +14.3%
- By 2040
- 642,986 · +43.6%
- By 2050
- 774,552 · +73.0%
- By 2075
- 1,078,144 · +140.9%
- By 2100
- 1,269,660 · +183.6%
Race, ethnicity, and origin ACS 2023
- Neighborhood character
- Diverse neighborhood (Simpson 0.66)
- Race & ethnicity
- Hispanic / Latino 49% White 29% Two or more races 18% Black 14% Asian 4%
- Hispanic origin (detail)
- Mexican 4% Puerto Rican 26% Dominican 4%
- Common ancestry
- Hispanic 4% Estonian 2% Lithuanian 1%
- Foreign-born
- 29% · Canada, Jamaica, China
- Languages at home
- 44% English-only · Spanish 41% French/Haitian/Cajun 4% Other Indo-European 4%
Political lean MEDSL · Osceola
- 2024 margin
- Toss-up / Even · D 48.7% · R 50.2% · Other 1.1%
- 2008→2024 swing
- -21.2pp toward R · 2008: 19.7pp · 2024: -1.4pp
- All cycles
- 2024: R+1.4 2020: D+13.8 2016: D+25.0 2012: D+24.5 2008: D+19.7
Not yet ingested
- Civics
- —
Market trends
- HPI YoY
- ▼ -119.87%
- Current HPI
- 239.1841
- Rent YoY
- ▼ -1.23%
- Metro
- Orlando-Kissimmee-Sanford, FL
- State GDP YoY
- ▲ 3.28%
- F500 in state
- 36
Industry mix (Fortune 500 HQ in FL)
| Industry | F500 HQs | Revenue |
|---|---|---|
| Industrial Technology | 2 | $29B |
|
||
| Insurance | 2 | $17B |
|
||
| Retail | 1 | $60B |
|
||
| Technology Distribution | 1 | $58B |
|
||
| Homebuilding | 1 | $35B |
|
||
| Technology Manufacturing | 1 | $35B |
|
||
Price history
+192.0% since first listed12 events — show timeline
- 2026-05-19 Pending — Stellar MLS as Distributed by MLS Grid
- 2026-04-28 Price Changed $294,900 Stellar MLS as Distributed by MLS Grid
- 2026-04-14 Listed $299,900 Stellar MLS as Distributed by MLS Grid
- 2019-07-10 Sold (Public Records) $180,000 Public Records
- 2019-07-05 Sold (MLS) $180,000 Stellar MLS as Distributed by MLS Grid
- 2019-05-31 Pending — Stellar MLS as Distributed by MLS Grid
- 2019-05-24 Relisted — Stellar MLS as Distributed by MLS Grid
- 2019-04-08 Pending — Stellar MLS as Distributed by MLS Grid
- 2019-03-19 Relisted — Stellar MLS as Distributed by MLS Grid
- 2019-02-26 Pending — Stellar MLS as Distributed by MLS Grid
- 2019-02-08 Listed $179,900 Stellar MLS as Distributed by MLS Grid
- 2018-12-07 Sold (Public Records) $101,000 Public Records
Property tax history
+7.3%/yrLatest (2025): $1,772 · +7.5% YoY. Source: county tax records.
Cash-flow waterfall
monthlySold comps — $/sqft
last 12 mo · ≤1 miLoading sold comps…