400 Sulphur Bank #59 · Clearlake Oaks, CA
Flood risk 6/10 · Moderate
- FEMA flood zone
- X (unshaded)
- Chance of flooding over 30 yrs
- 0.74%
- Est. flood insurance / yr
- $507 – $1,088
Fire risk 10/10 · Severe
- Est. fire insurance / yr
- $659 – $1,223
Heat risk 6/10 · Moderate
- Hot days now (above 100°F)
- 8 days/yr
- Hot days in 30 yrs
- 16 days/yr
Wind risk 1/10 · Minimal
- Chance of severe wind over 30 yrs
- —
Air-quality risk 10/10 · Severe
- Unhealthy air days now
- 31 days/yr
- Unhealthy air days in 30 yrs
- 33 days/yr
Risk factors via First Street. Map © Google.
Why this score? — see what drove the B- grade
The composite is a weighted blend of 9 inputs, each scored 0–100. Each bar is that input's sub-score; the figure is the points it added to the 100-point composite (weight × sub-score).
- Cash flow +30.0/30.0
- 1% rule +10.0/10.0
- DSCR +10.0/10.0
- ARV discount +7.5/15.0
- Livability +3.0/5.0
- Rent growth +2.5/5.0
- Condition / age +2.5/5.0
- Schools +1.2/10.0
- Appreciation +0.0/10.0
$72,500
🖨 Deal sheet 📄 Offer letter ✓ Due diligence
Listing remarks
There's a large covered deck leading to front door. Very nice floor plan. Dining area has built-in hutch and large living room. Beautiful chandelier near built-in hutch. Family room is off kitchen. Spacious bedrooms and baths. Primary bath has garden or soaking tub with a separate shower stall. Main bath has large, step-in shower. New oven, gas countertop range and dishwasher in kitchen. Washer and dryer are included. There's a storage shed in back
Key facts
- Covered deck
- Soaking tub
- Built-in hutch
Tags
Property features AI
Finance
- Other: Double body type; Model: Silvercrest; Year built: see remarks
- Financial info: Land lease: $675 monthly (park)
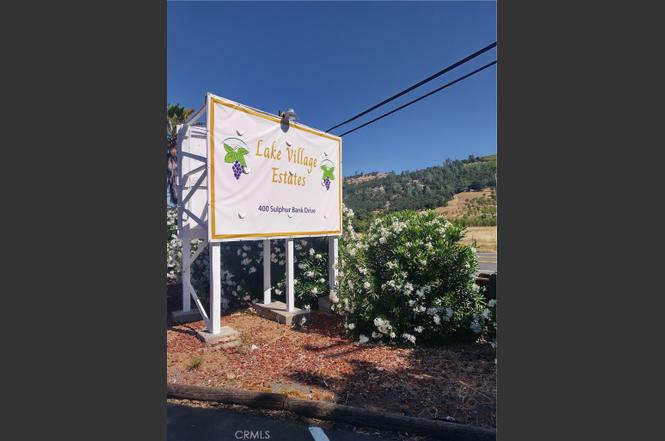
- HOA & community: Part of an association; Senior community; Park name: Lake Village Estates; Community features: Foothills; Manager approval required; Pets allowed with breed restrictions
Exterior
- Parking: Attached carport with 2 spaces
- Security: Gated community; Carbon monoxide detector(s)
- Utilities: 220V in kitchen and laundry; Propane available; Electricity connected; Public/district water; Public sewer
- Home design: Single-story mobile home (Silvercrest model, 24' x 60'); Entry at level 1 with side entry; Total of 1 story; Mobile home remains on site
- Construction: Composition roof; No foundation specified
- Exterior features: Covered patio/porch; Porch; Deck; Association pool with fenced area; Shed; Level/rectangular lot, level with street; Has view
Interior
- Kitchen: Gas cooktop; Refrigerator; Dishwasher; Formica counters; Kitchen open to family room; Water heater unit
- Bedrooms: Primary bedroom on main level; All bedrooms on main level
- Flooring: Vinyl flooring; Carpet
- Bathrooms: 2 full bathrooms; Soaking tub; Walk-in shower; Shower; Formica counters in bathrooms
- Heating & cooling: Heat pump for heating and cooling
- Interior features: Sliding glass door(s); Blinds; Gated community; Carbon monoxide detector(s)
- Laundry & utility: Dedicated laundry room; Washer included; Dryer included
Neighborhood map
What this means for you Summary
Snapshot
- This is a 2-bed/2.0-bath land listed at $72k.
Deal economics
- At list price, monthly cash flow is $1k ($14k/yr) — positive.
- The deal already cash-flows at list — no discount required.
- Meets the 1% rule at list price ($2k rent vs $72k).
- Cap rate 25.1% vs local median 4.3% in Clearlake Oaks — top-decile yield for the area; either an underpriced asset or a hidden risk that comps aren't pricing in. Stress-test before assuming the spread holds.
Location & tenants
- Location reads 60/100 on livability (#569 in CA) — a middle-class / working-renter tenant base. Strengths: housing A+, crime B; Watch: health & safety C-, schools F, amenities F.
- Konocti Unified (town): math 9% / reading 21% proficiency, ranked #494 of 517 in CA (top 96%) — low school quality limits family demand, transient renter base, plan for 1-2y turnover; 77% free/reduced lunch — lower-income household profile, screen leases tightly.
- Market conditions: 136 active listings in the ZIP; 1 comparable units currently listed for rent nearby; 107 units permitted in Lake County in 2024 (40 in 5+ unit buildings).
Forward outlook
- Local home prices are declining (-3.0%/yr); year-one equity from $501 of loan paydown is wiped out by about $2k of value loss. Plan a longer hold.
- Lake County population projected at -15% by 2050 — secular population decline; favor cash flow + early exit over multi-decade hold.
- At projected returns (-3.0% appreciation + 3.0% rent growth), your $20k cash investment doubles in ~2 years — after that, you're playing with house money.
Negotiation context
- Only 3 days on market — expect competitive offers; lowballing is unlikely to land.
- 6 sale attempts since 21y ago with the ask held roughly flat each time — persistent listings suggest the price (not the market) is what's stuck; bring a comps-based counter.
- Current owner paid $53k; 37% above their basis — modest negotiation headroom, anchor on the comps not their cost.
Risks & watch-outs
- Climate carrying-cost: major flood risk; severe wildfire risk; extreme-heat days projected 8→16/yr by 2055 (HVAC capex compounding) — expect insurance premiums to compound above CPI over the hold.
Questions for the listing agent
- Built in 1978 — when were the roof, HVAC, electrical panel, plumbing, and water heater last replaced?
- Is there a deadline driving the sale (1031 exchange, divorce, estate, relocation)? That informs how much negotiation room exists.
- Schools are F-rated, which usually means shorter tenancies and higher turnover. Who's the typical renter profile here, and what's been the actual vacancy rate?
- What's the average days-on-market for RENTAL listings here right now (not sales)? A rising rental-DOM trend means longer vacancies and softer asking-rent achievability than the comps imply.
- What's the recent tenant-quality profile in this submarket — average credit score on applications, eviction rate, late-payment / NSF rate, and stable-employment percentage? A property-management company in the area should have these aggregated.
- How much new for-sale + rental construction is in the pipeline within 1–3 miles? Heavy new supply typically softens prices + rents 12–24 months out; constrained supply supports both.
Investment metrics
- 1% rule
- 2.76% ✓
- Cap rate
- 25.12%
- Cash-on-cash
- 67.24%
- DSCR
- 3.99
- GRM
- 3.0
CMA / ARV
No comps found within radius.
Projected returns pro-forma
-3.0% appreciation · 3.0% rent growth · sell at horizon
- IRR
- 66.6%
- Equity multiple
- 3.99×
- Total profit
- $60,697
- Equity at exit
- $10,810
- IRR
- 70.8%
- Equity multiple
- 8.20×
- Total profit
- $146,122
- Equity at exit
- $6,268
Cash invested: $20,300 (down + closing). Projections, not guarantees.
Landlord ↔ Tenant lean methodology
- Overall (STATE)
- 18 Strongly Tenant-Friendly
- State California
- 18 Strongly Tenant-Friendly · D+13
- County
- — inherits STATE
- City
- — inherits STATE
ZIP-level market 95423
- Home prices YoY
- -20.6%
- Active inventory
- 136
- Price-to-rent
- 3.0×
Monthly cashflow live
- Estimated rent
- $2,000 medium interval (Pro) →
- Mortgage (P&I)
- −$380
- Tax from tax record
- −$32 /mo · $385/yr
- Insurance
- −$30
- HOA
- −$0
- Vacancy / Maint / Mgmt
- −$420
- Net cashflow
- $1,138
Break-even live
UW: 25.0% down · 7.5% · 30yr · 1.5% tax · 5.0% vac · 8.0% maint · 8.0% mgmt
Financing live
Cash to close
- Down payment
- $18,125
- Closing costs
- $2,175
- Reserves months
- —
- Total cash needed
- —
Loan-product check · same deal, 3 products live
Conventional
25% down · 7.5% · 30yr
- Down + closing
- —
- Monthly P&I
- —
- Monthly cashflow
- —
- DSCR
- —
- Eligible?
- —
Personal DTI + credit; lowest rate.
DSCR
20% down · 8.5% · 30yr
- Down + closing
- —
- Monthly P&I
- —
- Monthly cashflow
- —
- DSCR
- —
- Eligible?
- —
No personal income docs; deal must DSCR.
Hard money
10% down · 12.0% · 12mo
- Down + closing
- —
- Monthly P&I
- —
- Monthly cashflow
- —
- DSCR
- —
- Eligible?
- —
Short-term bridge; refi at stabilization.
Rent comps 1 comps
| Address | Beds | Baths | Sqft | Rent | $/sqft | DOM | Units | Dist |
|---|---|---|---|---|---|---|---|---|
| 12755 Blue Heron Ct Clearlake Oaks, CA | 2.0 | 2.0 | 1134 | $2,000 | $1.76 | 43d | 1 | 1.21mi |
Listing history 4 events
-
2026-06-19days on market $72,500 Active 3 DOM
-
2026-06-18days on market $72,500 Active 2 DOM
-
2026-06-17remarks 452-char remark
-
2026-06-17$72,500 Active 1 DOM
ⓘ Source: listings_history table (triggers on properties + properties_extension) + one-shot
backfill from property_details.listing_events for pre-trigger history.
Tax reassessment forecast CA · Resets to sale price
- Current annual tax
- $385 · $32/mo
- Projected year-2 tax
- $551 · $46/mo
- Expected delta
- +$166/yr (+$14/mo · 43.3%)
ⓘ Screening estimate from a state-policy table — verify with the county assessor before closing.
Climate risk First Street
- Flood 6/10 Major FEMA zone X (unshaded) · 74% chance over 30 yrs
- Wildfire 10/10 Extreme
- Heat 6/10 Major 8 d/yr ≥100°F today · 16 d/yr by 30 yrs out
- Wind 1/10 Low
- Air quality 10/10 Extreme 31 unhealthy d/yr today · 33 by 30 yrs out
Nearby sold comps map
Loading sold comps map…
Walkable amenities ~0.75 mi
Loading nearby amenities…
Taxation est. · year 1
- Rental income
- $24,000
- − Mortgage interest
- −$4,061
- − Property taxes
- −$385
- − Insurance
- −$362
- − Repairs & maintenance
- −$1,920
- − Management
- −$1,920
- − Depreciation
- −$2,109
- Taxable income
- $13,243
- Est. tax owed @ 24.0%
- −$3,178
- After-tax cash flow
- $10,472/yr
For passive investors: Depreciation is non-cash, so a rental often shows a tax loss while cash-flowing — sheltering income. Rental losses are passive: they offset passive income freely, and up to $25,000/yr can offset ordinary (W-2) income if you actively participate and your MAGI is under $100k (phasing out to $0 by $150k); unused losses carry forward. On sale, claimed depreciation is recaptured at up to 25%, and gains may owe capital-gains tax (a 1031 exchange can defer both). Figures are a year-1 estimate at your 24.0% rate — not tax advice; consult a CPA.
Schools (NCES district)
- District
- Konocti Unified
- NCES district ID
- 0620070
- Math proficiency
- 9% ▼ -5.00%
- Reading proficiency
- 21% ▼ -6.00%
- Median HH income
- $30,026
- Composite
- 11.81/100
- National rank
- #9677
- State rank
- #494 of 517 in CA
Livability — Clearlake Oaks
- Score
- 60/100
- State rank
- #569
- US rank
- #18675
Category grades
Schools grade is shown separately in the Schools card above.
Census & demographics
- Census place
- Clearlake Oaks, CA
- Population (ZIP)
- 3,432
Population outlook (Lake County) Hauer SSP2
- Today (2025)
- 62,396 people
- By 2030
- 60,626 · -2.8%
- By 2040
- 56,453 · -9.5%
- By 2050
- 53,054 · -15.0%
- By 2075
- 47,663 · -23.6%
- By 2100
- 41,804 · -33.0%
Race, ethnicity, and origin ACS 2023
- Neighborhood character
- Predominantly White (69%)
- Race & ethnicity
- White 69% Hispanic / Latino 18% Two or more races 9% Native American 3% Black 1% Asian 1%
- Hispanic origin (detail)
- Mexican 17%
- Common ancestry
- Slovak 5% Lithuanian 4% Russian 2%
- Foreign-born
- 11% · Canada, Vietnam
- Languages at home
- 84% English-only · Spanish 8% Other Indo-European 7% German/W. Germanic 1%
Political lean MEDSL · Lake
- 2024 margin
- Toss-up / Even · D 47.8% · R 49.2% · Other 3.0%
- 2008→2024 swing
- -20.6pp toward R · 2008: 19.3pp · 2024: -1.4pp
- All cycles
- 2024: R+1.4 2020: D+6.3 2016: D+3.7 2012: D+16.5 2008: D+19.3
Not yet ingested
- Civics
- —
Market trends
- HPI YoY
- ▼ -46.32%
- Current HPI
- 178.9812
- Rent YoY
- —
- Metro
- —
- State GDP YoY
- ▲ 3.21%
- F500 in state
- 116
Industry mix (Fortune 500 HQ in CA)
| Industry | F500 HQs | Revenue |
|---|---|---|
| Technology | 27 | $1,492B |
|
||
| Financial Services | 3 | $174B |
|
||
| Retail | 3 | $44B |
|
||
| Insurance | 3 | $26B |
|
||
| Media / Entertainment | 2 | $115B |
|
||
| Pharmaceuticals / Biotech | 2 | $62B |
|
||
Price history
+26.1% since first listed12 events — show timeline
- 2026-06-16 Listed $72,500 CRMLS
- 2015-07-30 Listing Removed — CRMLS
- 2015-07-08 Price Changed $35,500 CRMLS
- 2015-06-15 Listed $37,750 CRMLS
- 2014-09-08 Listing Removed — CRMLS
- 2014-02-07 Listed $45,900 CRMLS
- 2008-09-30 Listing Removed — CRMLS
- 2008-03-03 Listed $57,500 CRMLS
- 2006-07-14 Sold (MLS) $53,000 CRMLS
- 2006-01-30 Listed $57,500 CRMLS
- 2005-12-16 Listing Removed — CRMLS
- 2005-04-16 Listed $57,500 CRMLS
Property tax history
+2.7%/yrLatest (2025): $385 · +83.7% YoY. Source: county tax records.
Cash-flow waterfall
monthlySold comps — $/sqft
last 12 mo · ≤1 miLoading sold comps…