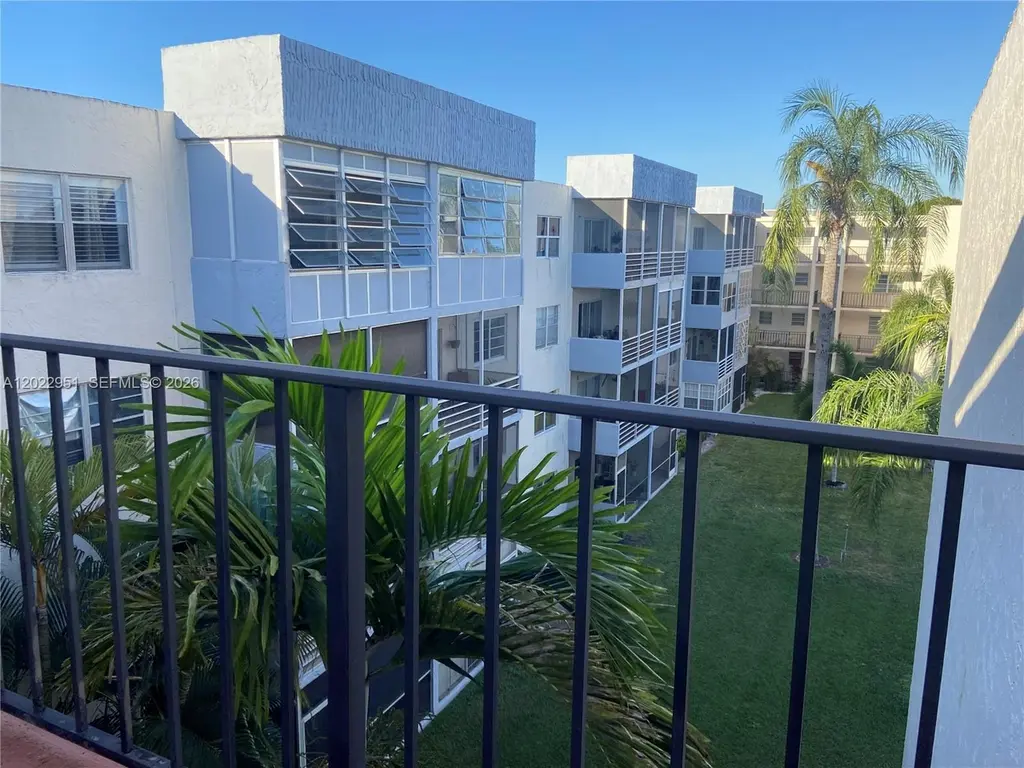
7502 NW 30th Pl #417 · Sunrise, FL
Flood risk 1/10 · Minimal
- FEMA flood zone
- X (shaded)
- Chance of flooding over 30 yrs
- 0.0%
- Est. flood insurance / yr
- $507 – $1,088
Fire risk 1/10 · Minimal
- Est. fire insurance / yr
- $947 – $1,759
Heat risk 9/10 · Severe
- Hot days now (above 105°F)
- 6 days/yr
- Hot days in 30 yrs
- 20 days/yr
Wind risk 10/10 · Severe
- Chance of severe wind over 30 yrs
- 99.0%
Air-quality risk 3/10 · Minor
- Unhealthy air days now
- 3 days/yr
- Unhealthy air days in 30 yrs
- 3 days/yr
Risk factors via First Street. Map © Google.
Why this score? — see what drove the C+ grade
The composite is a weighted blend of 9 inputs, each scored 0–100. Each bar is that input's sub-score; the figure is the points it added to the 100-point composite (weight × sub-score).
- Cash flow +23.9/30.0
- 1% rule +8.3/10.0
- DSCR +7.7/10.0
- ARV discount +7.5/15.0
- Livability +4.2/5.0
- Schools +4.1/10.0
- Rent growth +2.6/5.0
- Condition / age +2.5/5.0
- Appreciation +0.0/10.0
$149,900
🖨 Deal sheet 📄 Offer letter ✓ Due diligence
Listing remarks
Beautiful Update spacious 2/2 on the 4 Floor, this unit has two large bedrooms, each with respectivve badrooms> The amenities include Tennis Courts, Clubhouse, pool, close to shopping center, Malls and Beach. Laundry Facilities on site. It come with one personal parking space, and guest parking.
Key facts
- Laundry facilities
- Guest parking
- Clubhouse
Tags
Property features AI
Finance
- Other: Association-managed pool
- Financial info: Lease considered; Pets not allowed
- HOA & community: Monthly association fee; Association amenities: pool, elevator(s); Association covers amenities, insurance, laundry, grounds maintenance, structure maintenance, parking; Senior community
Exterior
- Parking: Guest parking
- Security: Secured elevator; Smoke detector(s)
- Utilities: Has heating
- Home design: Condominium with property attached; 4 total stories; Entry on level 4; Resale unit
- Construction: Block construction
- Exterior features: Balcony; Courtyard; Tennis court(s); Open balcony/patio
Interior
- Kitchen: Dishwasher; Microwave; Refrigerator; Disposal; Electric water heater
- Bedrooms: Bedroom on main level
- Flooring: Laminate flooring
- Bathrooms: 2 full bathrooms
- Heating & cooling: Central heating
- Interior features: Handicap access; Living/dining room; Elevator
Neighborhood map
What this means for you Summary
Snapshot
- This is a 2-bed/2.0-bath condo listed at $150k.
Deal economics
- At list price, monthly cash flow is $292 ($4k/yr) — positive.
- The deal already cash-flows at list — no discount required.
- Meets the 1% rule at list price ($2k rent vs $150k).
- Recommended offer: $148k (1.5% below list) — sets the bar for market timing.
- Cap rate 8.6% vs local median 4.9% in Sunrise — top-decile yield for the area; either an underpriced asset or a hidden risk that comps aren't pricing in. Stress-test before assuming the spread holds.
Location & tenants
- Location reads 83/100 on livability (#56 in FL, #986 nationally) — a professional / high-income tenant draw. Strengths: commute A+, housing A+, health & safety A+; Watch: employment C-, amenities F.
- Broward (suburban): math 42% / reading 53% proficiency, ranked #46 of 73 in FL (top 63%) — families likely to look elsewhere, expect single-tenant / working-renter base with shorter leases.
- Market conditions: Rents flat; 656 active listings in the ZIP; 40 comparable units currently listed for rent nearby; rentals at typical pace (median 24d on market — plan ~3-4 weeks tenant-placement turnaround); 2,111 units permitted in Broward County in 2024 (1,265 in 5+ unit buildings).
- At $2,000/mo this rent would consume 52% of the median local household income ($46k/yr) (locally 5692% of renters already pay >50% of income on rent) — very limited rent-growth headroom before tenants either downsize or default.
Forward outlook
- Local home prices are declining (-3.0%/yr); year-one equity from $1k of loan paydown is wiped out by about $4k of value loss. Plan a longer hold.
- Broward County population projected at +34% by 2050 — long-run rental-demand tailwind backs the buy-and-hold thesis.
Negotiation context
- It's been on market 29 days — a 2% lower offer ($148k) is reasonable based on typical stale-listing flexibility.
- 7 sale attempts since 5y ago with the ask held roughly flat each time — persistent listings suggest the price (not the market) is what's stuck; bring a comps-based counter.
- Current owner paid $102k; 46% above their basis — modest negotiation headroom, anchor on the comps not their cost.
Risks & watch-outs
- Climate carrying-cost: severe wind risk, 99% chance of damaging wind over 30y; extreme-heat days projected 6→20/yr by 2055 (HVAC capex compounding) — expect insurance premiums to compound above CPI over the hold.
Questions for the listing agent
- Built in 1974 — when were the roof, HVAC, electrical panel, plumbing, and water heater last replaced?
- What does the HOA fee cover, when was the last increase, and are there any pending special assessments or reserve-fund shortfalls?
- Any open or pending special assessments — roof, HVAC, plumbing, elevator, façade? What's the per-unit balance and payoff schedule, and is the seller paying it off at close or rolling it to the buyer?
- Is there a deadline driving the sale (1031 exchange, divorce, estate, relocation)? That informs how much negotiation room exists.
- What's the average days-on-market for RENTAL listings here right now (not sales)? A rising rental-DOM trend means longer vacancies and softer asking-rent achievability than the comps imply.
- What's the recent tenant-quality profile in this submarket — average credit score on applications, eviction rate, late-payment / NSF rate, and stable-employment percentage? A property-management company in the area should have these aggregated.
- How much new apartment / multifamily construction is in the pipeline within 1–3 miles? Heavy new supply (>2% of stock underway) typically softens rents 12–24 months out; light construction supports rent growth.
Investment metrics
- 1% rule
- 1.33% ✓
- Cap rate
- 8.63%
- Cash-on-cash
- 8.35%
- DSCR
- 1.37
- GRM
- 6.2
CMA / ARV
No comps found within radius.
Projected returns pro-forma
-3.0% appreciation · 0.26% rent growth · sell at horizon
- IRR
- -7.3%
- Equity multiple
- 0.74×
- Total profit
- $-10,873
- Equity at exit
- $22,351
- IRR
- -2.3%
- Equity multiple
- 0.87×
- Total profit
- $-5,616
- Equity at exit
- $12,961
Cash invested: $41,972 (down + closing). Projections, not guarantees.
Landlord ↔ Tenant lean methodology
- Overall (STATE)
- 87 Strongly Landlord-Friendly
- State Florida
- 87 Strongly Landlord-Friendly · R+3
- County
- — inherits STATE
- City
- — inherits STATE
ZIP-level market 33313
- Rents YoY
- 0.3%
- Active inventory
- 656
- Price-to-rent
- 6.2×
Monthly cashflow live
- Estimated rent
- $2,000 high interval (Pro) →
- Mortgage (P&I)
- −$786
- Tax from tax record
- −$118 /mo · $1,412/yr
- Insurance
- −$62
- HOA
- −$322
- Vacancy / Maint / Mgmt
- −$420
- Net cashflow
- $292
Break-even live
UW: 25.0% down · 7.5% · 30yr · 1.5% tax · 5.0% vac · 8.0% maint · 8.0% mgmt
Financing live
Cash to close
- Down payment
- $37,475
- Closing costs
- $4,497
- Reserves months
- —
- Total cash needed
- —
Loan-product check · same deal, 3 products live
Conventional
25% down · 7.5% · 30yr
- Down + closing
- —
- Monthly P&I
- —
- Monthly cashflow
- —
- DSCR
- —
- Eligible?
- —
Personal DTI + credit; lowest rate.
DSCR
20% down · 8.5% · 30yr
- Down + closing
- —
- Monthly P&I
- —
- Monthly cashflow
- —
- DSCR
- —
- Eligible?
- —
No personal income docs; deal must DSCR.
Hard money
10% down · 12.0% · 12mo
- Down + closing
- —
- Monthly P&I
- —
- Monthly cashflow
- —
- DSCR
- —
- Eligible?
- —
Short-term bridge; refi at stabilization.
Rent comps 40 comps
| Address | Beds | Baths | Sqft | Rent | $/sqft | DOM | Units | Dist |
|---|---|---|---|---|---|---|---|---|
| 3048 Sunrise Lakes Dr E Unit 411 Sunrise, FL | 1.0 | 1.0 | 725 | $1,600 | $2.21 | 3d | 1 | 0.10mi |
| 3048 Sunrise Lakes Dr E Unit 411 Sunrise, FL | 1.0 | 1.0 | 725 | $1,650 | $2.28 | 20d | 1 | 0.10mi |
| 3048 E Sunrise Lakes Dr #412 Sunrise, FL | 1.0 | 1.0 | 725 | $1,400 | $1.93 | 21d | 1 | 0.10mi |
| 7891 Sunrise Lakes Dr N Sunrise, FL | 2.0 | 2.0 | 850 | $2,500 | $2.94 | 24d | 1 | 0.12mi |
| 6885 NW 27th Ct Sunrise, FL | 2.0 | 1.0 | 923 | $2,090 | $2.26 | 11d | 1 | 0.47mi |
| 2534 NW 73rd Ave Sunrise, FL | 1.0 | 1.0 | 950 | $1,750 | $1.84 | 24d | 1 | 0.48mi |
| 2921 NW 68th Ter #1 Sunrise, FL | 2.0 | 2.0 | 975 | $1,900 | $1.95 | 24d | 1 | 0.52mi |
| 2921 NW 68th Ter #1 Sunrise, FL | 2.0 | 2.0 | 975 | $1,900 | $1.95 | 7d | 1 | 0.52mi |
| 7461 NW 23rd St Sunrise, FL | 2.0 | 1.0 | 896 | $2,550 | $2.85 | 13d | 1 | 0.60mi |
| 6701 W Oakland Park Blvd Fort Lauderdale, FL | 1.0–2.0 | 1.0–2.0 | 1000 | $2,389 | $2.39 | 2d | 9 | 0.62mi |
| 8053 W Oakland Park Blvd Unit 5-305 Sunrise, FL | 1.0 | 1.0 | 846 | $2,702 | $3.19 | 24d | 1 | 0.63mi |
| 8053 W Oakland Park Blvd Unit 5-101 Sunrise, FL | 1.0 | 1.0 | 986 | $3,354 | $3.40 | 24d | 1 | 0.63mi |
| 8053 W Oakland Park Blvd Sunrise, FL | 1.0 | 1.0 | 846 | $2,779 | $3.28 | 24d | 1 | 0.63mi |
| 8053 W Oakland Park Blvd Unit 1-204 Sunrise, FL | 1.0 | 1.0 | 735 | $2,450 | $3.33 | 24d | 1 | 0.63mi |
| 8053 W Oakland Park Blvd Unit 6-301 Sunrise, FL | 2.0 | 2.0 | 1124 | $3,411 | $3.03 | 24d | 1 | 0.63mi |
| 8053 W Oakland Park Blvd Unit 1-201 Sunrise, FL | 2.0 | 2.0 | 1107 | $3,223 | $2.91 | 24d | 1 | 0.63mi |
| 8053 W Oakland Park Blvd Unit 6-307 Sunrise, FL | 1.0 | 1.0 | 727 | $2,618 | $3.60 | 24d | 1 | 0.63mi |
| 3671 Environ Blvd #470 Lauderhill, FL | 2.0 | 2.0 | 1100 | $1,875 | $1.70 | 24d | 1 | 0.67mi |
| 8100 Sunrise Lakes Blvd Sunrise, FL | 1.0–2.0 | 1.0–2.0 | 745 | $2,200 | $2.95 | 10d | 2 | 0.68mi |
| 2330 NW 72nd Ave Sunrise, FL | 1.0–2.0 | 1.0 | 742 | $1,900 | $2.56 | 24d | 1 | 0.68mi |
| 8110 Sunrise Lakes Blvd #307 Sunrise, FL | 1.0 | 1.0 | 640 | $1,500 | $2.34 | 17d | 1 | 0.69mi |
| 8110 Sunrise Lakes Blvd #307 Sunrise, FL | 1.0 | 1.0 | 640 | $1,500 | $2.34 | 2d | 1 | 0.69mi |
| 3771 Environ Blvd #348 Lauderhill, FL | 2.0 | 2.0 | 1060 | $1,750 | $1.65 | 20d | 1 | 0.69mi |
| 3771 Environ Blvd Lauderhill, FL | 1.0–2.0 | 2.0 | 920 | $1,750 | $1.90 | 24d | 2 | 0.69mi |
| 3900 NW 76th Ave #107 Sunrise, FL | 2.0 | 2.0 | 1030 | $1,750 | $1.70 | 24d | 1 | 0.70mi |
| 8083-8093 W Oakland Park Blvd Sunrise, FL | 1.0–3.0 | 1.0–2.0 | 1054 | $3,226 | $3.06 | 24d | 37 | 0.71mi |
| 8135 Sunrise Lakes Blvd Sunrise, FL | 1.0–2.0 | 1.0–2.0 | 745 | $1,550 | $2.08 | 24d | 2 | 0.73mi |
| 8135 Sunrise Lakes Blvd #302 Sunrise, FL | 2.0 | 2.0 | 850 | $1,550 | $1.82 | 11d | 1 | 0.74mi |
| 6575 W Oakland Park Blvd #214 Lauderhill, FL | 2.0 | 2.0 | 1000 | $1,900 | $1.90 | 13d | 1 | 0.76mi |
| 6575 W Oakland Park Blvd #218 Lauderhill, FL | 2.0 | 2.0 | 1110 | $2,000 | $1.80 | 24d | 1 | 0.76mi |
| 3801 Environ Blvd #219 Lauderhill, FL | 2.0 | 2.0 | 1100 | $1,700 | $1.55 | 10d | 1 | 0.77mi |
| 7620 NW 21st St Sunrise, FL | 3.0 | 2.0 | 1082 | $2,750 | $2.54 | 14d | 1 | 0.78mi |
| 3220 NW 84th Ave Sunrise, FL | 2.0 | 2.0 | 1115 | $2,150 | $1.93 | 24d | 1 | 0.79mi |
| 6475 W Oakland Park Blvd Lauderhill, FL | 1.0 | 1.5 | 800 | $1,600 | $2.00 | 24d | 1 | 0.79mi |
| 8225 Sunrise Lakes Blvd #303 Sunrise, FL | 2.0 | 2.0 | 850 | $1,600 | $1.88 | 2d | 1 | 0.80mi |
| 8220 Sunrise Lakes Blvd #309 Sunrise, FL | 2.0 | 2.0 | 850 | $1,650 | $1.94 | 24d | 1 | 0.81mi |
| 8310 NW 24th Pl Sunrise, FL | 2.0 | 1.0 | 900 | $2,400 | $2.67 | 18d | 1 | 0.82mi |
| 3232 NW 84th Ave Sunrise, FL | 2.0 | 2.0 | 1115 | $2,000 | $1.79 | 24d | 1 | 0.83mi |
| 3200 NW 84th Ave Sunrise, FL | 2.0 | 2.0 | 1115 | $2,100 | $1.88 | 24d | 1 | 0.84mi |
| 3244 NW 84th Ave Sunrise, FL | 2.0 | 2.0 | 1115 | $2,300 | $2.06 | 24d | 1 | 0.84mi |
HOA detail condo
- Monthly dues
- $322 · $3,864/yr
- Likely covers
- pool
- Assessments
- None detected in remarks — confirm with the listing agent.
Listing history 36 events
-
2026-06-18days on market $149,900 Active 29 DOM
-
2026-06-17days on market $149,900 Active 28 DOM
-
2026-06-16days on market $149,900 Active 27 DOM
-
2026-06-15days on market $149,900 Active 26 DOM
-
2026-06-13days on market $149,900 Active 24 DOM
-
2026-06-09days on market $149,900 Active 20 DOM
-
2026-06-08days on market $149,900 Active 19 DOM
-
2026-06-07days on market $149,900 Active 18 DOM
-
2026-06-04days on market $149,900 Active 15 DOM
-
2026-06-03days on market $149,900 Active 14 DOM
-
2026-06-02days on market $149,900 Active 13 DOM
-
2026-06-01days on market $149,900 Active 12 DOM
-
2026-05-31days on market $149,900 Active 11 DOM
-
2026-05-20$149,900 Active
-
2026-05-17historical
-
2025-11-18$160,000 Active
-
2025-11-12historical
-
2025-02-14historical $1,900
-
2025-02-12$1,900
-
2025-01-17$160,000 Active
-
2024-03-06historical $1,950
-
2024-03-05historical
-
2024-03-04price $180,000
-
2024-03-02price $170,000
-
2024-01-27price $1,950
-
2024-01-23$2,100
-
2023-11-27price $175,000
-
2023-10-25price $177,500
-
2023-10-04$180,000 Active
-
2021-09-16historical
-
2021-09-15soldstatus $102,500 Closed
-
2021-08-07historical Active Under Contract
-
2021-07-15price $102,500
-
2021-06-24price $107,500
-
2021-05-19$110,000 Active
-
1995-10-31soldstatus $34,500
ⓘ Source: listings_history table (triggers on properties + properties_extension) + one-shot
backfill from property_details.listing_events for pre-trigger history.
Tax reassessment forecast FL · Resets to sale price
- Current annual tax
- $1,412 · $118/mo
- Projected year-2 tax
- $1,412 · $118/mo
- Expected delta
- $0/yr ($0/mo · 0.0%)
ⓘ Screening estimate from a state-policy table — verify with the county assessor before closing.
Climate risk First Street
- Flood 1/10 Low FEMA zone X (shaded) · 0% chance over 30 yrs
- Wildfire 1/10 Low
- Heat 9/10 Extreme 6 d/yr ≥105°F today · 20 d/yr by 30 yrs out
- Wind 10/10 Extreme 99% chance of damaging wind over 30 yrs
- Air quality 3/10 Moderate 3 unhealthy d/yr today · 3 by 30 yrs out
Nearby sold comps map
Loading sold comps map…
Walkable amenities ~0.75 mi
Loading nearby amenities…
Taxation est. · year 1
- Rental income
- $24,003
- − Mortgage interest
- −$8,397
- − Property taxes
- −$1,412
- − Insurance
- −$750
- − Repairs & maintenance
- −$1,920
- − Management
- −$1,920
- − HOA
- −$3,864
- − Depreciation
- −$4,361
- Taxable income
- $1,380
- Est. tax owed @ 24.0%
- −$331
- After-tax cash flow
- $3,173/yr
For passive investors: Depreciation is non-cash, so a rental often shows a tax loss while cash-flowing — sheltering income. Rental losses are passive: they offset passive income freely, and up to $25,000/yr can offset ordinary (W-2) income if you actively participate and your MAGI is under $100k (phasing out to $0 by $150k); unused losses carry forward. On sale, claimed depreciation is recaptured at up to 25%, and gains may owe capital-gains tax (a 1031 exchange can defer both). Figures are a year-1 estimate at your 24.0% rate — not tax advice; consult a CPA.
Schools (NCES district)
- District
- Broward
- NCES district ID
- 1200180
- Math proficiency
- 42% ▼ -18.00%
- Reading proficiency
- 53% ▼ -5.00%
- Median HH income
- $52,139
- Composite
- 40.88/100
- National rank
- #3621
- State rank
- #46 of 73 in FL
Livability — Sunrise
- Score
- 83/100
- State rank
- #56
- US rank
- #986
Category grades
Schools grade is shown separately in the Schools card above.
Census & demographics
- Census place
- Sunrise, FL
- County
- Broward County · 1,963,430 people
- City population
- 77,492
- Metro
- Miami-Fort Lauderdale-Pompano Beach, FL
- Population (ZIP)
- 62,807
- Household income
- $46,305
- Rent vs Own
- Severe rent burden
- 5692.0
Population outlook (Broward County) Hauer SSP2
- Today (2025)
- 2,207,033 people
- By 2030
- 2,360,704 · +7.0%
- By 2040
- 2,661,208 · +20.6%
- By 2050
- 2,946,698 · +33.5%
- By 2075
- 3,602,273 · +63.2%
- By 2100
- 3,970,984 · +79.9%
Race, ethnicity, and origin ACS 2023
- Neighborhood character
- Predominantly Black (77%)
- Race & ethnicity
- Black 77% Hispanic / Latino 12% Two or more races 8% White 7% Asian 2%
- Hispanic origin (detail)
- Puerto Rican 2% Cuban 3% Dominican 1%
- Common ancestry
- Hispanic 20%
- Foreign-born
- 39% · Canada, Jamaica, Dominican Republic
- Languages at home
- 66% English-only · French/Haitian/Cajun 22% Spanish 10%
Political lean MEDSL · Broward
- 2024 margin
- D (+17.0) · D 58.0% · R 41.0%
- 2008→2024 swing
- -17.8pp toward R · 2008: 34.7pp · 2024: 17.0pp
- All cycles
- 2024: D+17.0 2020: D+29.8 2016: D+35.0 2012: D+34.9 2008: D+34.7
Not yet ingested
- Civics
- —
Market trends
- HPI YoY
- ▼ -338.15%
- Current HPI
- 288.9345
- Rent YoY
- ▲ 0.26%
- Metro
- Miami-Fort Lauderdale-Pompano Beach, FL
- State GDP YoY
- ▲ 3.28%
- F500 in state
- 36
Industry mix (Fortune 500 HQ in FL)
| Industry | F500 HQs | Revenue |
|---|---|---|
| Industrial Technology | 2 | $29B |
|
||
| Insurance | 2 | $17B |
|
||
| Retail | 1 | $60B |
|
||
| Technology Distribution | 1 | $58B |
|
||
| Homebuilding | 1 | $35B |
|
||
| Technology Manufacturing | 1 | $35B |
|
||
Price history
+334.5% since first listed23 events — show timeline
- 2026-05-20 Listed $149,900 MARMLS
- 2026-05-17 Listing Removed — MARMLS
- 2025-11-18 Listed $160,000 MARMLS
- 2025-11-12 Listing Removed — MARMLS
- 2025-02-14 Rental Removed $1,900 MARMLS
- 2025-02-12 Listed for Rent $1,900 MARMLS
- 2025-01-17 Listed $160,000 MARMLS
- 2024-03-06 Rental Removed $1,950 MARMLS
- 2024-03-05 Listing Removed — MARMLS
- 2024-03-04 Price Changed $180,000 MARMLS
- 2024-03-02 Price Changed $170,000 MARMLS
- 2024-01-27 Price Changed $1,950 MARMLS
- 2024-01-23 Listed for Rent $2,100 MARMLS
- 2023-11-27 Price Changed $175,000 MARMLS
- 2023-10-25 Price Changed $177,500 MARMLS
- 2023-10-04 Listed $180,000 MARMLS
- 2021-09-16 Listing Removed — MARMLS
- 2021-09-15 Sold (MLS) $102,500 MARMLS
- 2021-08-07 Contingent — MARMLS
- 2021-07-15 Price Changed $102,500 MARMLS
- 2021-06-24 Price Changed $107,500 MARMLS
- 2021-05-19 Listed $110,000 MARMLS
- 1995-10-31 Sold (Public Records) $34,500 Public Records
Property tax history
+4.9%/yrLatest (2025): $1,412 · +5.4% YoY. Source: county tax records.
Cash-flow waterfall
monthlySold comps — $/sqft
last 12 mo · ≤1 miLoading sold comps…