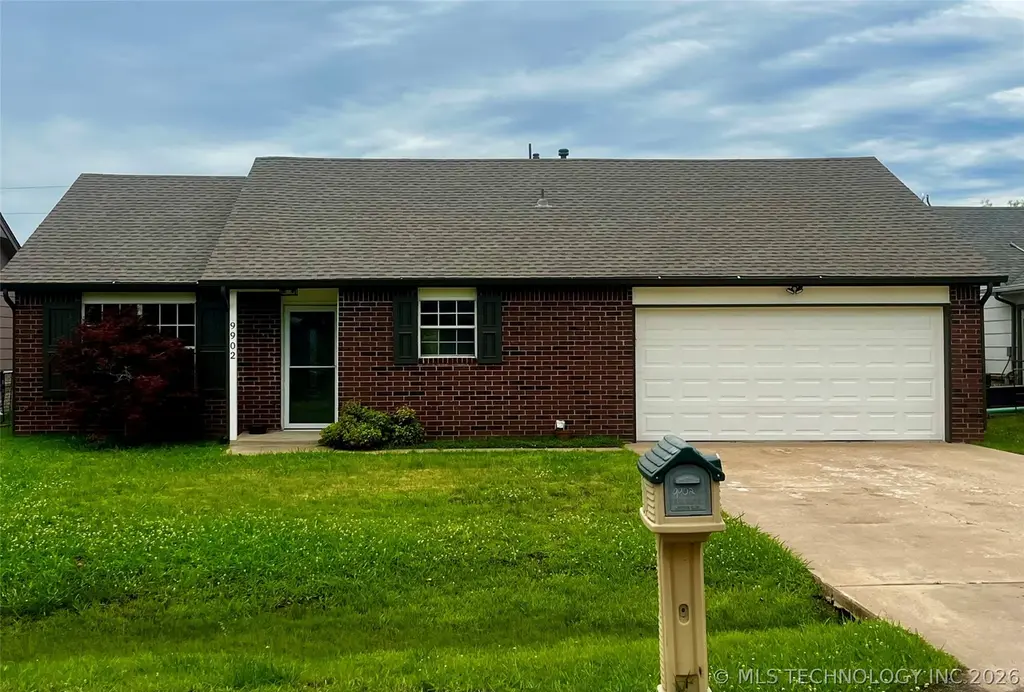
9902 N 43rd Ave E · Tulsa, OK
Flood risk 7/10 · Major
- FEMA flood zone
- X (unshaded)
- Chance of flooding over 30 yrs
- 0.99%
- Est. flood insurance / yr
- $473 – $860
Fire risk 7/10 · Major
- Est. fire insurance / yr
- $2,463 – $4,575
Heat risk 6/10 · Moderate
- Hot days now (above 110°F)
- 7 days/yr
- Hot days in 30 yrs
- 19 days/yr
Wind risk 3/10 · Minor
- Chance of severe wind over 30 yrs
- 4.0%
Air-quality risk 3/10 · Minor
- Unhealthy air days now
- 2 days/yr
- Unhealthy air days in 30 yrs
- 3 days/yr
Risk factors via First Street. Map © Google.
Why this score? — see what drove the D- grade
The composite is a weighted blend of 9 inputs, each scored 0–100. Each bar is that input's sub-score; the figure is the points it added to the 100-point composite (weight × sub-score).
- Cash flow +9.7/30.0
- Appreciation +9.0/10.0
- Livability +3.8/5.0
- DSCR +2.7/10.0
- 1% rule +2.5/10.0
- Rent growth +2.5/5.0
- Condition / age +2.5/5.0
- ARV discount +2.2/15.0
- Schools +2.1/10.0
$217,900
🖨 Deal sheet 📄 Offer letter ✓ Due diligence
Listing remarks MLS
Make this house your home! First time home uyers welcome. Home is immaculant with new lighting, appliances, upgraded flooring. Large fenced in back yard, Vaulted ceilings in living and master. Easy access to Tulsa, Skiatook and Owasso. Move in ready!
Key facts
- 1,182 sq ft lot
- 2 garage spots
- Built 1997
Property features AI
Finance
- Financial info: Pets allowed
- HOA & community: Homeowners association with monthly fee ($46); Community park; Sidewalks in the community
Exterior
- Parking: Attached garage with 2 spaces
- Security: No safety shelter
- Utilities: Cable available; Electricity available; Natural gas available; Water available; Sewer: lagoon; Water source: rural
- Home design: Single-story home; Faces east; Slab foundation
- Construction: Built of brick, Masonite and wood frame; Asphalt/fiberglass roof
- Exterior features: Covered patio and porch; Concrete driveway; Exterior lighting; Barbed wire and chain link fencing
Interior
- Kitchen: Kitchen with island; Oven/Range/Stove; Dishwasher; Disposal
- Bedrooms: Master bedroom with private bath and walk-in closet; Additional bedrooms on the main level (two described as 'Bedroom, No Bath')
- Flooring: Carpet; Wood veneer
- Bathrooms: Master bath with separate shower, bathtub and double sink; Two full hall baths on the main level
- Heating & cooling: Central heating (gas); Central air conditioning
- Interior features: Vaulted ceilings; Ceiling fans; Laminate, quartz and stone counters; Vinyl windows
- Laundry & utility: Interior utility room; Gas dryer hookup; Gas water heater
Neighborhood map
What this means for you Summary
Snapshot
- This is a 3-bed/2.0-bath single-family listed at $218k.
Deal economics
- At list price, monthly cash flow is $-200 ($-2k/yr) — negative.
- To cash-flow at today's rent, offer at most $183k (16.2% below list).
- To meet the 1% rule (rent ≥ 1% of price), the offer needs to be $164k (24.7% below list).
- Recommended offer: $164k (24.7% below list) — sets the bar for 1% rule.
- Cap rate 5.5% vs local median 3.9% in Tulsa — top-decile yield for the area; either an underpriced asset or a hidden risk that comps aren't pricing in. Stress-test before assuming the spread holds.
Location & tenants
- Location reads 75/100 on livability (#13 in OK, #4,058 nationally) — a middle-class / working-renter tenant base. Strengths: amenities A+, commute A+, cost of living A+; Watch: schools F, crime F, employment D-.
- Sperry (rural): math 21% / reading 26% proficiency, ranked #114 of 270 in OK (top 42%) — low school quality limits family demand, transient renter base, plan for 1-2y turnover.
- Market conditions: 62 active listings in the ZIP; 2,818 units permitted in Tulsa County in 2024 (518 in 5+ unit buildings).
Forward outlook
- In year one you build about $19k of equity ($2k loan paydown + $17k appreciation (7.9% local appreciation)).
- Tulsa County population projected at +30% by 2050 — long-run rental-demand tailwind backs the buy-and-hold thesis.
- By year 2, paydown + projected appreciation supports a ~$30k cash-out refi (75% LTV) — recoverable capital for the next deal without selling this one.
Negotiation context
- Only 12 days on market — expect competitive offers; lowballing is unlikely to land.
- 8 sale attempts since 28y ago with the ask held roughly flat each time — persistent listings suggest the price (not the market) is what's stuck; bring a comps-based counter.
- Current owner paid $140k; list at $218k implies a 56% gain — meaningful room to come down on a strong offer.
Risks & watch-outs
- Watch-outs: flood insurance adds $56/mo.
- Climate carrying-cost: major flood risk; major wildfire risk; extreme-heat days projected 7→19/yr by 2055 (HVAC capex compounding) — expect insurance premiums to compound above CPI over the hold.
Questions for the listing agent
- What do current leases actually rent for vs. the listed asking? Can we see a recent rent roll and the last 12 months of T-12 income?
- What's the actual annual flood-insurance premium (NFIP or private), and is the property in a SFHA with mandatory coverage?
- What does the HOA fee cover, when was the last increase, and are there any pending special assessments or reserve-fund shortfalls?
- Is there a deadline driving the sale (1031 exchange, divorce, estate, relocation)? That informs how much negotiation room exists.
- Schools are F-rated, which usually means shorter tenancies and higher turnover. Who's the typical renter profile here, and what's been the actual vacancy rate?
- Crime grade is F in this area — have there been break-ins, vandalism, or insurance claims at this property in the last 3 years? What carrier currently insures it and at what premium?
- The area grade is low — what's the realistic commute time and amenity access for the typical tenant pool here? Any planned neighborhood developments (good or bad) we should know about?
- What's the average days-on-market for RENTAL listings here right now (not sales)? A rising rental-DOM trend means longer vacancies and softer asking-rent achievability than the comps imply.
- What's the recent tenant-quality profile in this submarket — average credit score on applications, eviction rate, late-payment / NSF rate, and stable-employment percentage? A property-management company in the area should have these aggregated.
- How much new for-sale + rental construction is in the pipeline within 1–3 miles? Heavy new supply typically softens prices + rents 12–24 months out; constrained supply supports both.
Investment metrics
- 1% rule
- 0.75% ✗
- Cap rate
- 5.50%
- Cash-on-cash
- -2.84%
- DSCR
- 0.87
- GRM
- 11.1
CMA / ARV
- ARV (on-the-fly)
- $195,030
- Comps found
- 8
Show comp detail 8 sales within ~0.75 mi
| Address | Dist | Beds/Ba | Sqft | Sold | Price | $/sf | Match |
|---|---|---|---|---|---|---|---|
| 10003 N 43rd EastAvenue | 0.09mi | 3/2.0 | 1,204 (+2%) | 4mo | $203,500 | $169 | 90 |
| 9833 N 43rd EastAvenue | 0.04mi | 3/2.0 | 1,219 (+3%) | 6mo | $199,000 | $163 | 88 |
| 9918 N 44th East Ave | 0.06mi | 3/2.0 | 1,134 (-4%) | 7mo | $191,000 | $168 | 84 |
| 10002 N 43rd EastAvenue | 0.09mi | 3/2.0 | 1,205 (+2%) | 13mo | $185,000 | $154 | 82 |
| 10025 N 44th Ave E | 0.19mi | 3/2.0 | 1,195 (+1%) | 19mo | $200,000 | $167 | 74 |
| 4320 E 101st St N | 0.16mi | 3/2.0 | 1,246 (+5%) | 14mo | $206,000 | $165 | 72 |
| 4212 E 101st St | 0.16mi | 3/2.0 | 1,121 (-5%) | 22mo | $170,000 | $152 | 66 |
| 9718 N 44th EastAvenue | 0.16mi | 3/2.0 | 1,100 (-7%) | 18mo | $175,000 | $159 | 66 |
Match score weights: distance 35% · size 25% · config 20% · recency 20%. Top-matched comps best support the ARV.
Projected returns pro-forma
7.92% appreciation · 3.0% rent growth · sell at horizon
- IRR
- 16.8%
- Equity multiple
- 2.25×
- Total profit
- $75,973
- Equity at exit
- $164,416
- IRR
- 16.2%
- Equity multiple
- 4.77×
- Total profit
- $229,897
- Equity at exit
- $325,294
Cash invested: $61,012 (down + closing). Projections, not guarantees.
Landlord ↔ Tenant lean methodology
- Overall (STATE)
- 83 Strongly Landlord-Friendly
- State Oklahoma
- 83 Strongly Landlord-Friendly · R+20
- County
- — inherits STATE
- City
- — inherits STATE
ZIP-level market 74073
- Home prices YoY
- 3.0%
- Active inventory
- 62
- Price-to-rent
- 11.1×
Monthly cashflow live
- Estimated rent
- $1,640 medium interval (Pro) →
- Mortgage (P&I)
- −$1,143
- Tax from tax record
- −$161 /mo · $1,929/yr
- Insurance
- −$91
- Flood insurance flood zone
- −$56 /mo · $666/yr
- HOA
- −$46
- Vacancy / Maint / Mgmt
- −$344
- Net cashflow
- $-200
Break-even live
UW: 25.0% down · 7.5% · 30yr · 1.5% tax · 5.0% vac · 8.0% maint · 8.0% mgmt
Financing live
Cash to close
- Down payment
- $54,475
- Closing costs
- $6,537
- Reserves months
- —
- Total cash needed
- —
Loan-product check · same deal, 3 products live
Conventional
25% down · 7.5% · 30yr
- Down + closing
- —
- Monthly P&I
- —
- Monthly cashflow
- —
- DSCR
- —
- Eligible?
- —
Personal DTI + credit; lowest rate.
DSCR
20% down · 8.5% · 30yr
- Down + closing
- —
- Monthly P&I
- —
- Monthly cashflow
- —
- DSCR
- —
- Eligible?
- —
No personal income docs; deal must DSCR.
Hard money
10% down · 12.0% · 12mo
- Down + closing
- —
- Monthly P&I
- —
- Monthly cashflow
- —
- DSCR
- —
- Eligible?
- —
Short-term bridge; refi at stabilization.
HOA detail
- Monthly dues
- $46 · $552/yr
Listing history 8 events
-
2026-06-15status $217,900 Pending 12 DOM
-
2026-06-15days on market $217,900 Active 12 DOM
-
2026-06-13days on market $217,900 Active 10 DOM
-
2026-06-10days on market $217,900 Active 7 DOM
-
2026-06-09days on market $217,900 Active 6 DOM
-
2026-06-08days on market $217,900 Active 5 DOM
-
2026-06-07remarks 699-char remark
-
2026-06-07$217,900 Active 4 DOM
ⓘ Source: listings_history table (triggers on properties + properties_extension) + one-shot
backfill from property_details.listing_events for pre-trigger history.
Tax reassessment forecast OK · Resets to sale price
- Current annual tax
- $1,929 · $161/mo
- Projected year-2 tax
- $1,961 · $163/mo
- Expected delta
- +$32/yr (+$3/mo · 1.7%)
ⓘ Screening estimate from a state-policy table — verify with the county assessor before closing.
Climate risk First Street
- Flood 7/10 Severe FEMA zone X (unshaded) · 99% chance over 30 yrs
- Wildfire 7/10 Severe
- Heat 6/10 Major 7 d/yr ≥110°F today · 19 d/yr by 30 yrs out
- Wind 3/10 Moderate 4% chance of damaging wind over 30 yrs
- Air quality 3/10 Moderate 2 unhealthy d/yr today · 3 by 30 yrs out
Nearby sold comps map
Loading sold comps map…
Walkable amenities ~0.75 mi
Loading nearby amenities…
Taxation est. · year 1
- Rental income
- $19,680
- − Mortgage interest
- −$12,206
- − Property taxes
- −$1,929
- − Insurance
- −$1,756
- − Repairs & maintenance
- −$1,574
- − Management
- −$1,574
- − HOA
- −$552
- − Depreciation
- −$6,339
- Taxable loss
- −$6,250
- Est. tax savings @ 24.0%
- +$1,500
- After-tax cash flow
- $-902/yr
For passive investors: Depreciation is non-cash, so a rental often shows a tax loss while cash-flowing — sheltering income. Rental losses are passive: they offset passive income freely, and up to $25,000/yr can offset ordinary (W-2) income if you actively participate and your MAGI is under $100k (phasing out to $0 by $150k); unused losses carry forward. On sale, claimed depreciation is recaptured at up to 25%, and gains may owe capital-gains tax (a 1031 exchange can defer both). Figures are a year-1 estimate at your 24.0% rate — not tax advice; consult a CPA.
Schools (NCES district)
- District
- Sperry
- NCES district ID
- 4028170
- Math proficiency
- 21% ▼ -9.00%
- Reading proficiency
- 26% ▼ -10.00%
- Median HH income
- $52,187
- Composite
- 21.01/100
- National rank
- #8455
- State rank
- #114 of 270 in OK
Livability — Tulsa
- Score
- 75/100
- State rank
- #13
- US rank
- #4058
Category grades
Schools grade is shown separately in the Schools card above.
Census & demographics
- City population
- 389,418
- Population (ZIP)
- 5,610
Population outlook (Tulsa County) Hauer SSP2
- Today (2025)
- 723,846 people
- By 2030
- 766,033 · +5.8%
- By 2040
- 851,386 · +17.6%
- By 2050
- 938,389 · +29.6%
- By 2075
- 1,166,011 · +61.1%
- By 2100
- 1,350,277 · +86.5%
Race, ethnicity, and origin ACS 2023
- Neighborhood character
- Predominantly White (67%)
- Race & ethnicity
- White 67% Two or more races 16% Native American 7% Hispanic / Latino 6% Asian 3% Black 2%
- Hispanic origin (detail)
- Mexican 5%
- Common ancestry
- Lithuanian 2% Slovak 2% Iranian 2%
- Foreign-born
- 2% · Canada
- Languages at home
- 93% English-only · Spanish 4% Other Asian/Pacific 2% Russian/Polish/Slavic 1%
Political lean MEDSL · Tulsa
- 2024 margin
- R (+15.2) · D 41.3% · R 56.5% · Other 2.2%
- 2008→2024 swing
- +9.2pp toward D · 2008: -24.5pp · 2024: -15.2pp
- All cycles
- 2024: R+15.2 2020: R+15.6 2016: R+22.9 2012: R+27.4 2008: R+24.5
Not yet ingested
- Civics
- —
Market trends
- HPI YoY
- ▲ 7.92%
- Current HPI
- 268.133
- Rent YoY
- —
- Metro
- —
- State GDP YoY
- ▲ 1.55%
- F500 in state
- 6
Industry mix (Fortune 500 HQ in OK)
| Industry | F500 HQs | Revenue |
|---|---|---|
| Energy | 3 | $48B |
|
||
Price history
+246.4% since first listed21 events — show timeline
- 2026-06-03 Listed $217,900 MLS Technology, Inc.
- 2022-04-26 Sold (Public Records) $140,000 Public Records
- 2022-03-18 Listed $140,000 MLS Technology, Inc.
- 2010-03-01 Sold (Public Records) $105,000 Public Records
- 2010-02-26 Sold (MLS) $105,000 MLS Technology, Inc.
- 2010-02-04 Listing Removed — MLS Technology, Inc.
- 2009-10-16 Listed $106,900 MLS Technology, Inc.
- 2008-09-17 Listing Removed — MLS Technology, Inc.
- 2008-07-20 Listed $105,000 MLS Technology, Inc.
- 2007-09-27 Sold (Public Records) $100,000 Public Records
- 2007-09-25 Sold (MLS) $99,910 MLS Technology, Inc.
- 2007-08-27 Listing Removed — MLS Technology, Inc.
- 2007-07-20 Listed $96,900 MLS Technology, Inc.
- 2004-06-04 Listing Removed — MLS Technology, Inc.
- 2004-03-21 Listed $89,999 MLS Technology, Inc.
- 2002-12-17 Sold (Public Records) $82,500 Public Records
- 2002-12-11 Sold (MLS) $82,300 MLS Technology, Inc.
- 2002-11-07 Listing Removed — MLS Technology, Inc.
- 2002-08-15 Listed $79,999 MLS Technology, Inc.
- 1998-02-11 Listing Removed — MLS Technology, Inc.
- 1998-01-05 Listed $62,900 MLS Technology, Inc.
Property tax history
+5.0%/yrLatest (2025): $1,929 · +5.1% YoY. Source: county tax records.
Cash-flow waterfall
monthlySold comps — $/sqft
last 12 mo · ≤1 miLoading sold comps…