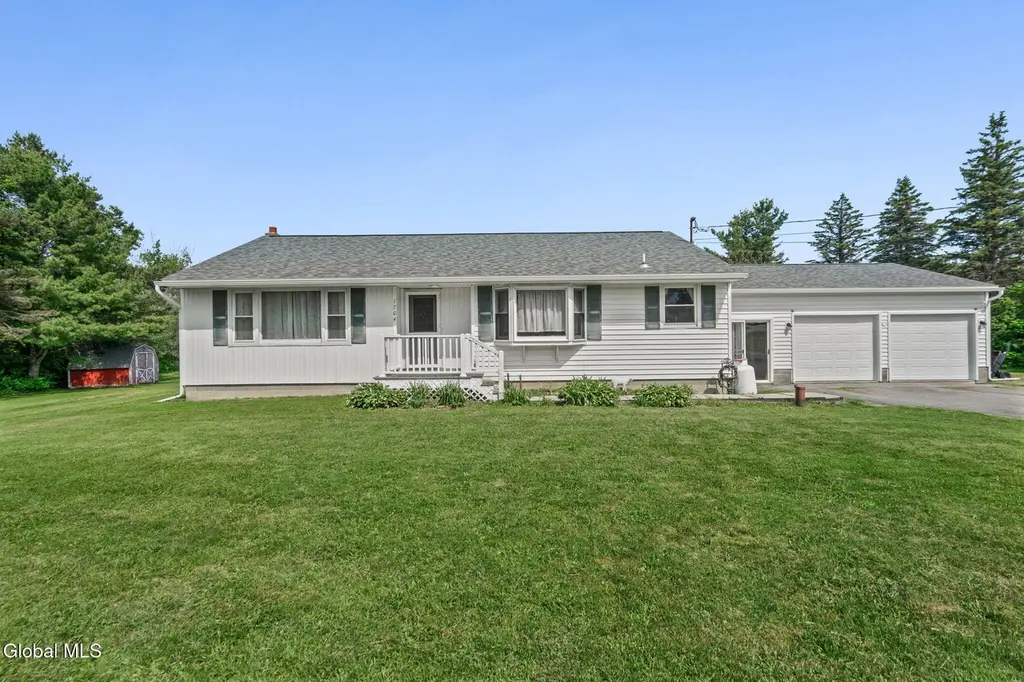
1704 Warners Lake Rd · Altamont, NY
Flood risk 1/10 · Minimal
- FEMA flood zone
- X (unshaded)
- Chance of flooding over 30 yrs
- 0.0%
- Est. flood insurance / yr
- $473 – $860
Fire risk 3/10 · Minor
- Est. fire insurance / yr
- $691 – $1,283
Heat risk 2/10 · Minimal
- Hot days now (above 91°F)
- 5 days/yr
- Hot days in 30 yrs
- 11 days/yr
Wind risk 3/10 · Minor
- Chance of severe wind over 30 yrs
- 5.0%
Air-quality risk 1/10 · Minimal
- Unhealthy air days now
- 0 days/yr
- Unhealthy air days in 30 yrs
- 0 days/yr
Risk factors via First Street. Map © Google.
Why this score? — see what drove the D grade
The composite is a weighted blend of 9 inputs, each scored 0–100. Each bar is that input's sub-score; the figure is the points it added to the 100-point composite (weight × sub-score).
- Appreciation +10.0/10.0
- Cash flow +8.0/30.0
- ARV discount +7.5/15.0
- Schools +4.9/10.0
- Livability +3.6/5.0
- Rent growth +2.5/5.0
- Condition / age +2.5/5.0
- 1% rule +2.4/10.0
- DSCR +2.1/10.0
$299,900
🖨 Deal sheet (PDF) 📄 Offer letter ✓ Due diligence
Listing remarks MLS
SOLD BEFORE PRINT -- Superior Condition
Key facts
- Expansive lot
- One-story living
- Outdoor space
Tags
Property features AI
Exterior
- Parking: Attached 2-car garage; Total parking for 6 vehicles; Off-street paved parking and driveway
- Utilities: Septic tank
- Home design: Single family residence; Updated / remodeled
- Construction: Vinyl siding; Asphalt roof
- Exterior features: Deck; Paved driveway; Exterior lighting; Above-ground pool; Landscaped, level lot (2.6 acres)
Interior
- Kitchen: Dishwasher; Gas oven; Refrigerator
- Bedrooms: Primary bedroom on first floor; Two additional bedrooms on first floor
- Flooring: Wood floors; Ceramic tile
- Bathrooms: One full bathroom on first floor
- Heating & cooling: Oil heating
- Interior features: High-speed internet; Paddle ceiling fan; Solid surface counters; Ceramic tile bath; Sliding doors
- Laundry & utility: Laundry in basement; Full unfinished basement with interior entry
Neighborhood map
What this means for you Summary
Snapshot
- This is a 3-bed/1.0-bath single-family listed at $300k.
Deal economics
- At list price, monthly cash flow is $-306 ($-4k/yr) — negative.
- To cash-flow at today's rent, offer at most $246k (18.0% below list).
- To meet the 1% rule (rent ≥ 1% of price), the offer needs to be $221k (26.3% below list).
- Recommended offer: $221k (26.3% below list) — sets the bar for 1% rule.
- Cap rate 5.1% vs local median 2.9% in Altamont — top-decile yield for the area; either an underpriced asset or a hidden risk that comps aren't pricing in. Stress-test before assuming the spread holds.
Location & tenants
- Location reads 71/100 on livability (#387 in NY) — a middle-class / working-renter tenant base. Strengths: crime A+, employment A+, housing A+; Watch: cost of living D+, amenities F, commute F.
- Berne-Knox-Westerlo Central School District (rural): math 54% / reading 57% proficiency, ranked #275 of 590 in NY (top 47%) — acceptable for families but not a draw, mixed tenant base, ~2y average lease.
- Zoned schools: Berne-Knox-Westerlo Elementary School (math 57% / reading 62%, grade B-, #745 of 2,108 statewide, top 39%, 371 students, 34% FRL); Berne-Knox-Westerlo Junior-Senior High School (math 52% / reading 52%, grade D+, #946 of 1,100 statewide, top 88%, 320 students, 32% FRL) — zoned schools at 33% FRL track the district average.
- Market conditions: 48 active listings in the ZIP; 675 units permitted in Albany County in 2024 (451 in 5+ unit buildings).
Forward outlook
- In year one you build about $32k of equity ($2k loan paydown + $30k appreciation (10.0% local appreciation)).
- Albany County population projected at +9% by 2050 — modest demand growth; plan on rents tracking national, not racing it.
- By year 2, paydown + projected appreciation supports a ~$52k cash-out refi (75% LTV) — recoverable capital for the next deal without selling this one.
Negotiation context
- Only 6 days on market — expect competitive offers; lowballing is unlikely to land.
- 2 sale attempts since 23y ago with the ask held roughly flat each time — persistent listings suggest the price (not the market) is what's stuck; bring a comps-based counter.
- Current owner paid $140k; list at $300k implies a 114% gain — meaningful room to come down on a strong offer.
Questions for the listing agent
- What do current leases actually rent for vs. the listed asking? Can we see a recent rent roll and the last 12 months of T-12 income?
- Built in 1974 — when were the roof, HVAC, electrical panel, plumbing, and water heater last replaced?
- Is there a deadline driving the sale (1031 exchange, divorce, estate, relocation)? That informs how much negotiation room exists.
- Schools are B-rated — typically a magnet for longer-tenancy family renters. What's the average tenant stay here, and is there a school-zone premium baked into asking?
- The area grade is low — what's the realistic commute time and amenity access for the typical tenant pool here? Any planned neighborhood developments (good or bad) we should know about?
- What's the average days-on-market for RENTAL listings here right now (not sales)? A rising rental-DOM trend means longer vacancies and softer asking-rent achievability than the comps imply.
- What's the recent tenant-quality profile in this submarket — average credit score on applications, eviction rate, late-payment / NSF rate, and stable-employment percentage? A property-management company in the area should have these aggregated.
- How much new for-sale + rental construction is in the pipeline within 1–3 miles? Heavy new supply typically softens prices + rents 12–24 months out; constrained supply supports both.
Investment metrics
- 1% rule
- 0.74% ✗
- Cap rate
- 5.07%
- Cash-on-cash
- -4.37%
- DSCR
- 0.81
- GRM
- 11.3
CMA / ARV
No comps found within radius.
Projected returns pro-forma
10.0% appreciation · 3.0% rent growth · sell at horizon
- IRR
- 21.2%
- Equity multiple
- 2.71×
- Total profit
- $143,884
- Equity at exit
- $270,174
- IRR
- 19.2%
- Equity multiple
- 6.23×
- Total profit
- $439,066
- Equity at exit
- $582,640
Cash invested: $83,972 (down + closing). Projections, not guarantees.
Landlord ↔ Tenant lean methodology
- Overall (STATE)
- 15 Strongly Tenant-Friendly
- State New York
- 15 Strongly Tenant-Friendly · D+10
- County
- — inherits STATE
- City
- — inherits STATE
ZIP-level market 12009
- Home prices YoY
- 7.0%
- Active inventory
- 48
- Price-to-rent
- 11.3×
Monthly cashflow live
- Estimated rent
- $2,210 medium interval (Pro) →
- Mortgage (P&I)
- −$1,573
- Tax from tax record
- −$354 /mo · $4,248/yr
- Insurance
- −$125
- HOA
- −$0
- Vacancy / Maint / Mgmt
- −$464
- Net cashflow
- $-306
Break-even live
Sensitivity live
| Price | -10% $-136 | -5% $-221 | +0% $-306 | +5% $-391 | +10% $-475 |
|---|---|---|---|---|---|
| Rent | -10% $-480 | -5% $-393 | +0% $-306 | +5% $-218 | +10% $-131 |
| Rate | -1.0pp $-155 | -0.5pp $-229 | base $-306 | +0.5pp $-383 | +1.0pp $-462 |
UW: 25.0% down · 7.5% · 30yr · 1.5% tax · 5.0% vac · 8.0% maint · 8.0% mgmt
Financing live
Cash to close
- Down payment
- $74,975
- Closing costs
- $8,997
- Reserves months
- —
- Total cash needed
- —
Loan-product check · same deal, 3 products live
Conventional
25% down · 7.5% · 30yr
- Down + closing
- —
- Monthly P&I
- —
- Monthly cashflow
- —
- DSCR
- —
- Eligible?
- —
Personal DTI + credit; lowest rate.
DSCR
20% down · 8.5% · 30yr
- Down + closing
- —
- Monthly P&I
- —
- Monthly cashflow
- —
- DSCR
- —
- Eligible?
- —
No personal income docs; deal must DSCR.
Hard money
10% down · 12.0% · 12mo
- Down + closing
- —
- Monthly P&I
- —
- Monthly cashflow
- —
- DSCR
- —
- Eligible?
- —
Short-term bridge; refi at stabilization.
Listing history 6 events
-
2026-06-17status $299,900 Pending 6 DOM
-
2026-06-16days on market $299,900 Active 6 DOM
-
2026-06-15days on market $299,900 Active 5 DOM
-
2026-06-13days on market $299,900 Active 3 DOM
-
2026-06-12remarks 662-char remark
-
2026-06-12$299,900 Active 2 DOM
ⓘ Source: listings_history table (triggers on properties + properties_extension) + one-shot
backfill from property_details.listing_events for pre-trigger history.
Tax reassessment forecast NY · Partial reset (capped growth)
- Current annual tax
- $4,248 · $354/mo
- Projected year-2 tax
- $4,658 · $388/mo
- Expected delta
- +$410/yr (+$34/mo · 9.7%)
ⓘ Screening estimate from a state-policy table — verify with the county assessor before closing.
Climate risk First Street
- Flood 1/10 Low FEMA zone X (unshaded) · 0% chance over 30 yrs
- Wildfire 3/10 Moderate
- Heat 2/10 Low 5 d/yr ≥91°F today · 11 d/yr by 30 yrs out
- Wind 3/10 Moderate 5% chance of damaging wind over 30 yrs
- Air quality 1/10 Low 0 unhealthy d/yr today · 0 by 30 yrs out
Nearby sold comps map
Loading sold comps map…
Walkable amenities ~0.75 mi
Loading nearby amenities…
Taxation est. · year 1
- Rental income
- $26,520
- − Mortgage interest
- −$16,799
- − Property taxes
- −$4,248
- − Insurance
- −$1,500
- − Repairs & maintenance
- −$2,122
- − Management
- −$2,122
- − Depreciation
- −$8,724
- Taxable loss
- −$8,993
- Est. tax savings @ 24.0%
- +$2,158
- After-tax cash flow
- $-1,510/yr
For passive investors: Depreciation is non-cash, so a rental often shows a tax loss while cash-flowing — sheltering income. Rental losses are passive: they offset passive income freely, and up to $25,000/yr can offset ordinary (W-2) income if you actively participate and your MAGI is under $100k (phasing out to $0 by $150k); unused losses carry forward. On sale, claimed depreciation is recaptured at up to 25%, and gains may owe capital-gains tax (a 1031 exchange can defer both). Figures are a year-1 estimate at your 24.0% rate — not tax advice; consult a CPA.
Schools (NCES district)
- District
- Berne-Knox-Westerlo Central School District
- NCES district ID
- 3604650
- Math proficiency
- 54% ▲ 1.00%
- Reading proficiency
- 57% ▲ 3.00%
- Median HH income
- $68,684
- Composite
- 49.13/100
- National rank
- #2046
- State rank
- #275 of 590 in NY
Livability — Altamont
- Score
- 71/100
- State rank
- #387
- US rank
- #6655
Category grades
Schools grade is shown separately in the Schools card above.
Census & demographics
- City population
- 8,068
- Population (ZIP)
- 8,068
Population outlook (Albany County) Hauer SSP2
- Today (2025)
- 320,794 people
- By 2030
- 327,401 · +2.1%
- By 2040
- 338,218 · +5.4%
- By 2050
- 348,467 · +8.6%
- By 2075
- 381,693 · +19.0%
- By 2100
- 393,809 · +22.8%
Race, ethnicity, and origin ACS 2023
- Neighborhood character
- Predominantly White (83%)
- Race & ethnicity
- White 83% Asian 7% Two or more races 5% Hispanic / Latino 3% Black 3%
- Common ancestry
- Romanian 8% Iranian 4% Lithuanian 4%
- Foreign-born
- 7% · Canada, China, South Korea
- Languages at home
- 92% English-only · Spanish 2% Other Asian/Pacific 2% Korean 1%
Political lean MEDSL · Albany
- 2024 margin
- Strong D (+25.8) · D 62.9% · R 37.1%
- 2008→2024 swing
- -3.6pp toward R · 2008: 29.4pp · 2024: 25.8pp
- All cycles
- 2024: D+25.8 2020: D+31.4 2016: D+24.3 2012: D+31.0 2008: D+29.4
Not yet ingested
- Civics
- —
Market trends
- HPI YoY
- ▲ 18.85%
- Current HPI
- 290.1144
- Rent YoY
- —
- Metro
- —
- State GDP YoY
- ▲ 2.60%
- F500 in state
- 92
Industry mix (Fortune 500 HQ in NY)
| Industry | F500 HQs | Revenue |
|---|---|---|
| Financial Services | 10 | $950B |
|
||
| Consumer Goods | 9 | $162B |
|
||
| Insurance | 4 | $225B |
|
||
| Telecommunications | 2 | $144B |
|
||
| Pharmaceuticals | 2 | $112B |
|
||
| Media / Entertainment | 2 | $69B |
|
||
Price history
+122.3% since first listed5 events — show timeline
- 2026-06-10 Listed $299,900 Global MLS
- 2003-11-17 Sold (Public Records) $139,900 Public Records
- 2003-09-25 Sold (MLS) $139,500 Global MLS
- 2003-07-02 Listing Removed — Global MLS
- 2003-07-02 Listed $134,900 Global MLS
Property tax history
+0.7%/yrLatest (2025): $4,248 · -0.8% YoY. Source: county tax records.
Cash-flow waterfall
monthlySold comps — $/sqft
last 12 mo · ≤1 miLoading sold comps…